| Param | Original file | Final file |
|---|---|---|
| Filename | modeM0/AS1T03_291T01_9000004278_29802cztM0_level2.evt | modeM0/AS1T03_291T01_9000004278_29802cztM0_level2_quad_clean.evt |
| Size (bytes) | 781,274,880 | 69,894,720 |
| Size | 745.1 MB | 66.7 MB |
| Events in quadrant A | 3,520,818 | 461,132 |
| Events in quadrant B | 8,096,977 | 446,368 |
| Events in quadrant C | 3,606,358 | 430,819 |
| Events in quadrant D | 8,002,167 | 327,821 |
| Mode SS | |||
|---|---|---|---|
| Quadrant | BADHDUFLAG | Total packets | Discarded packets |
| A | 0 | 132 | 0 |
| B | 0 | 132 | 0 |
| C | 0 | 132 | 0 |
| D | 0 | 132 | 0 |
| Mode M0 | |||
|---|---|---|---|
| Quadrant | BADHDUFLAG | Total packets | Discarded packets |
| A | 0 | 14596 | 1 |
| B | 0 | 28365 | 1 |
| C | 0 | 14826 | 1 |
| D | 0 | 28377 | 1 |
| Mode M9 | |||
|---|---|---|---|
| Quadrant | BADHDUFLAG | Total packets | Discarded packets |
| A | 0 | 12 | 0 |
| B | 0 | 12 | 0 |
| C | 0 | 12 | 0 |
| D | 0 | 12 | 0 |
| Quadrant | Total seconds | Saturated seconds | Saturation percentage |
|---|---|---|---|
| A | 6441 | 91 | 1.412824% |
| B | 6441 | 1441 | 22.372302% |
| C | 6441 | 228 | 3.539823% |
| D | 6441 | 1465 | 22.744915% |
Noise dominated data is calculated using 1-second bins in cleaned event files. If a bin has >2000 counts, and if more than 50% of those come from <1% of pixels, then it is considered to be noise-dominated and hence unusable.
| Quadrant | # 1 sec bins | Bins with >0 counts | Bins with >2000 counts | High rate bins dominated by noise | Noise dominated (total time) | Noise dominated (detector-on time) | Marked lightcurve |
|---|---|---|---|---|---|---|---|
| A | 7666 | 6442 | 8 | 8 | 0.10% | 0.12% | 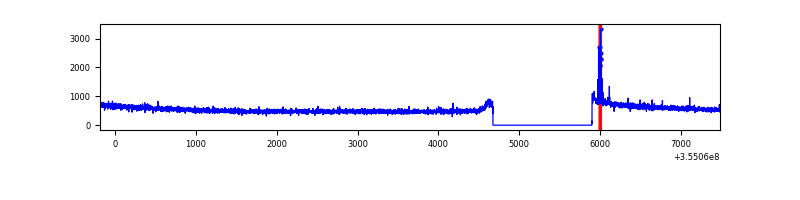 |
| B | 7666 | 6442 | 1032 | 1032 | 13.46% | 16.02% | 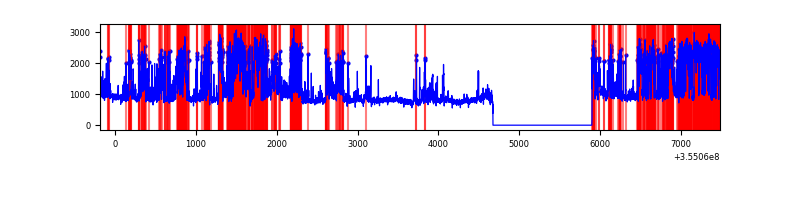 |
| C | 7666 | 6442 | 20 | 20 | 0.26% | 0.31% | 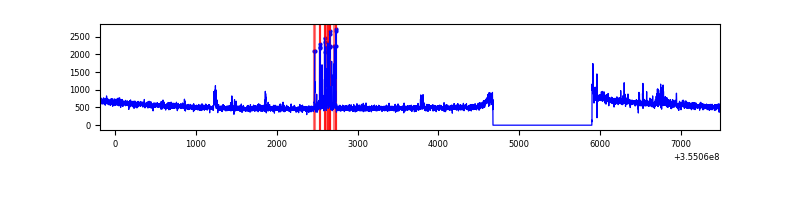 |
| D | 7666 | 6442 | 1439 | 1439 | 18.77% | 22.34% | 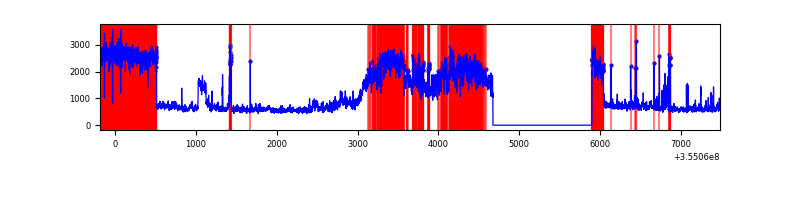 |
Top three noisy pixels from each quadrant. If the there are fewer than three noisy pixels in the level2.evt file, extra rows are filled as -1
| Pixel properties | Quadrant properties | ||||||
|---|---|---|---|---|---|---|---|
| Quadrant | DetID | PixID | Counts | Sigma | Mean | Median | Sigma |
| A | 12 | 96 | 37163 | 203.63 | 903 | 889 | 178.1 |
| A | 13 | 254 | 14087 | 74.09 | 903 | 889 | 178.1 |
| A | 3 | 137 | 7973 | 39.77 | 903 | 889 | 178.1 |
| B | 0 | 189 | 2781897 | 18192.55 | 828 | 810 | 152.9 |
| B | 6 | 159 | 1736478 | 11353.91 | 828 | 810 | 152.9 |
| B | 0 | 229 | 215510 | 1404.47 | 828 | 810 | 152.9 |
| C | 14 | 238 | 170963 | 893.42 | 834 | 842 | 190.4 |
| C | 10 | 22 | 118035 | 615.46 | 834 | 842 | 190.4 |
| C | 14 | 254 | 44485 | 229.2 | 834 | 842 | 190.4 |
| D | 7 | 238 | 4377003 | 25172.61 | 751 | 733 | 173.9 |
| D | 8 | 195 | 453634 | 2605.12 | 751 | 733 | 173.9 |
| D | 1 | 52 | 154155 | 882.49 | 751 | 733 | 173.9 |
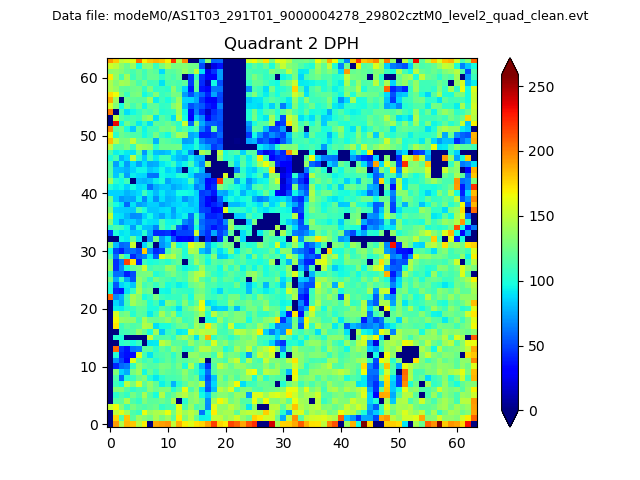
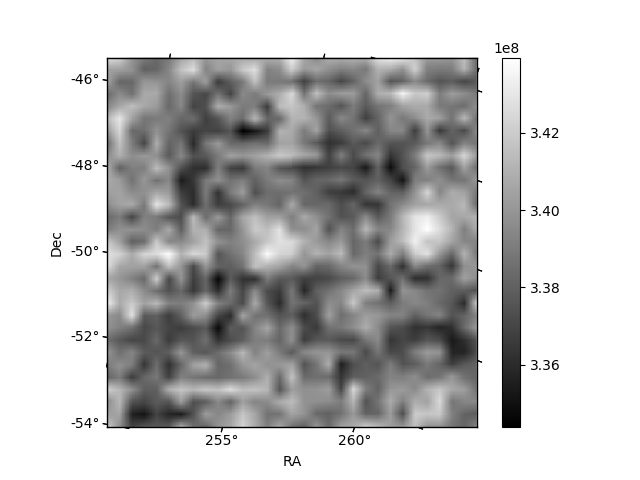
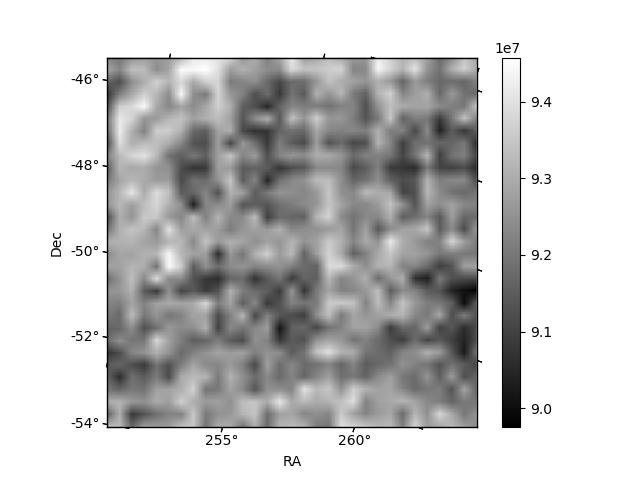
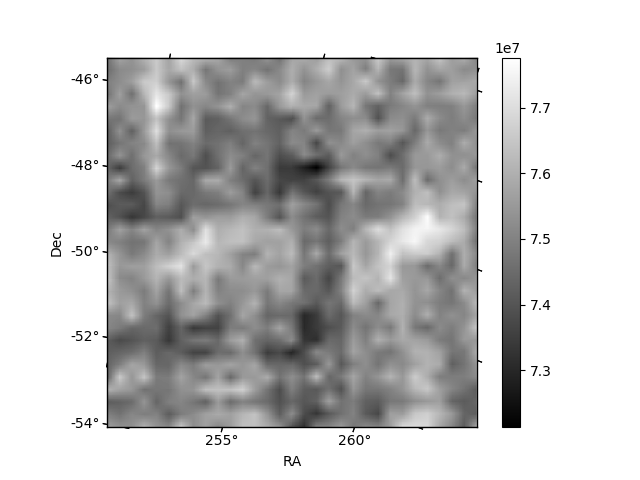
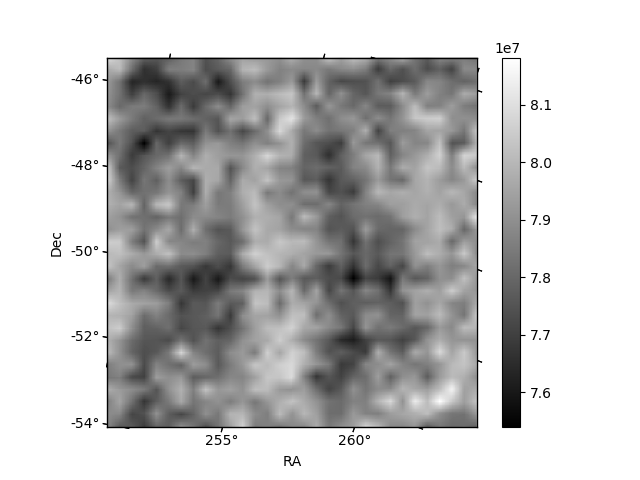
Histogram calculated using DETX and DETY for each event in the final _common_clean file
| Quadrant A | 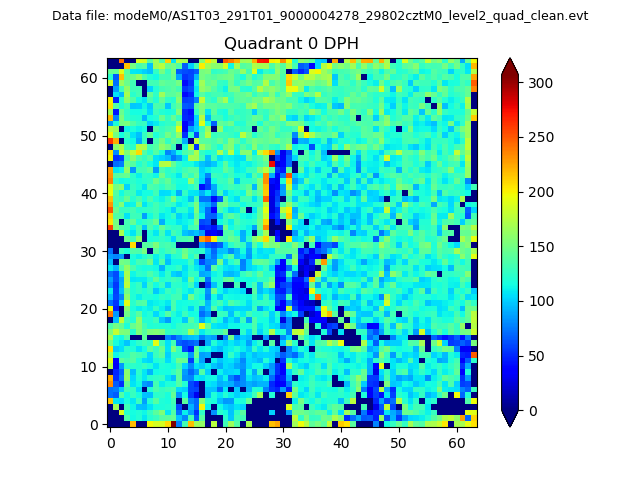 |
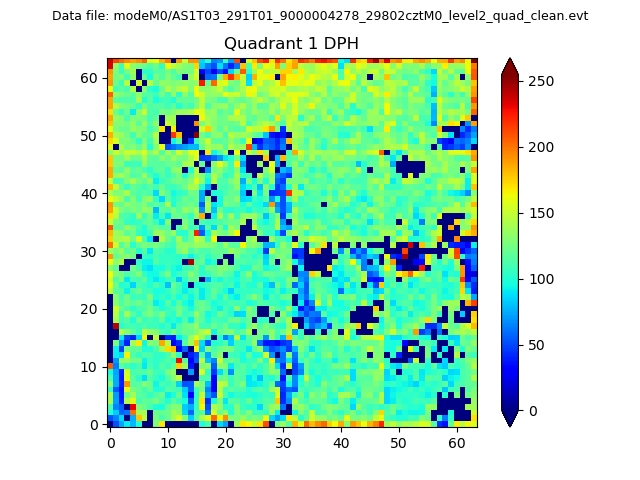 |
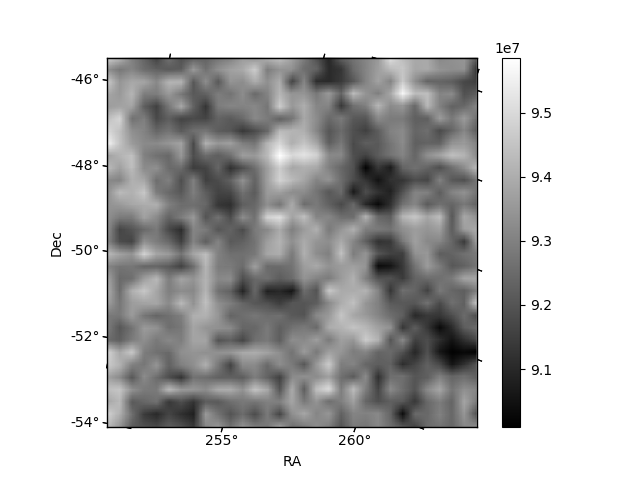
Quadrant B |
|---|---|---|---|
| Quadrant D | 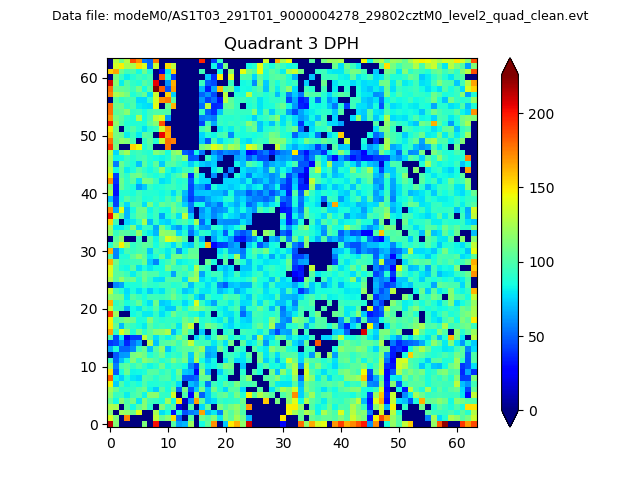 |
 |
Quadrant C |
| Plot type | Count rate plots | Images |
|---|---|---|
| Comparison with Poisson distribution Blue bars denote a histogram of data divided into 1 sec bins. Red curve is a Poisson curve with rate = median count rate of data. |
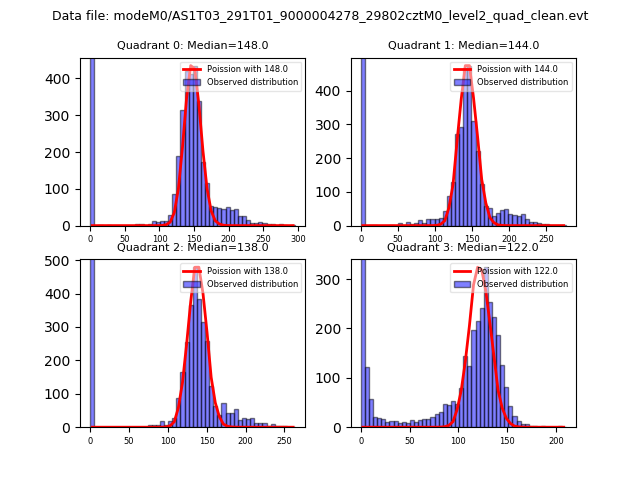 |
 |
| Quadrant-wise count rates Data is divided into 100 sec bins |
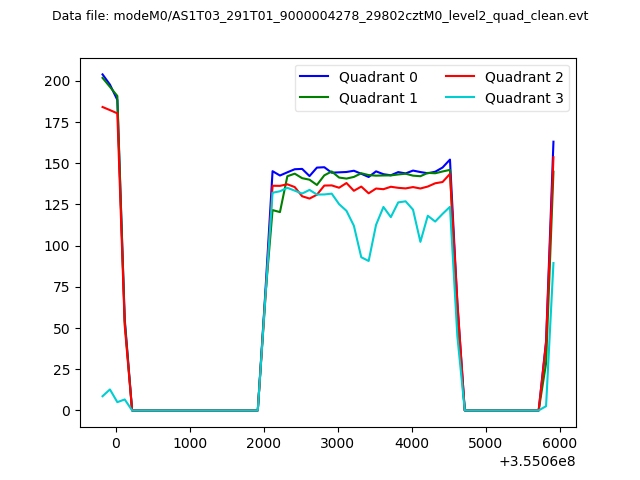 |
|
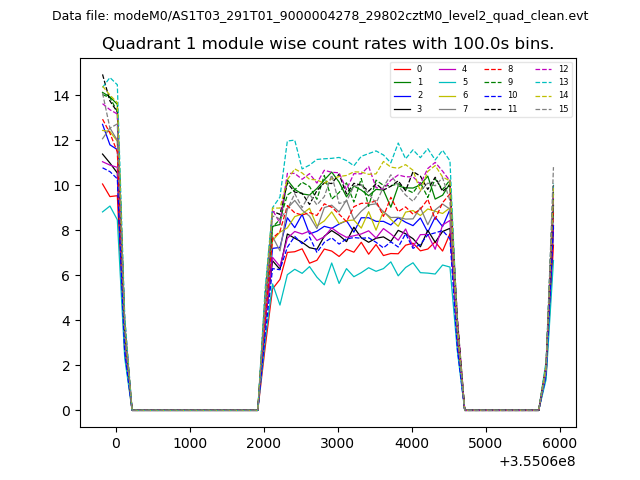
| Module-wise count rates for Quadrant A Data is divided into 100 sec bins |
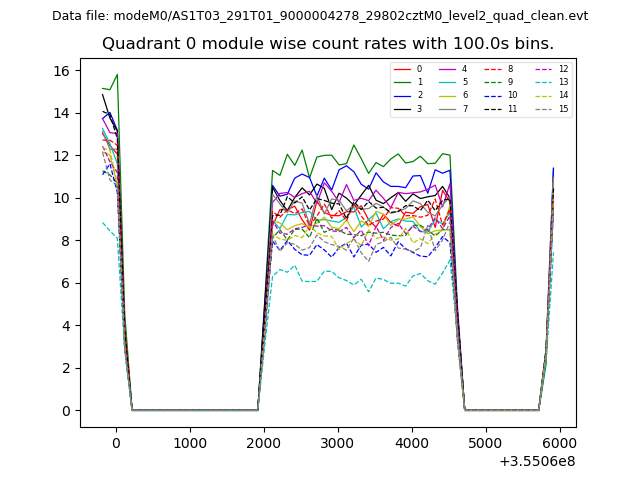 |
 |
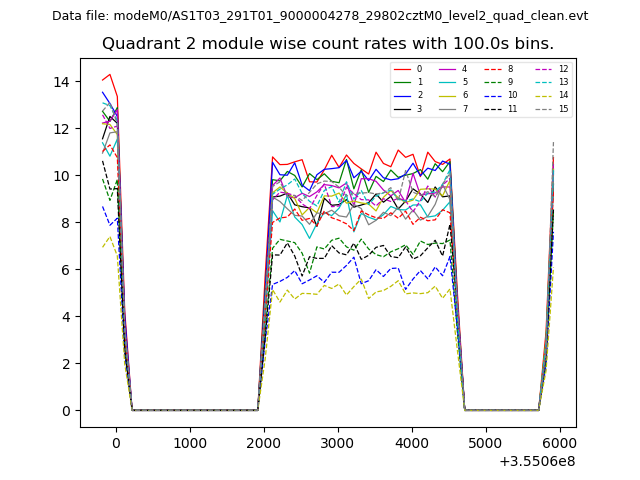
| Module-wise count rates for Quadrant B Data is divided into 100 sec bins |
 |
 |
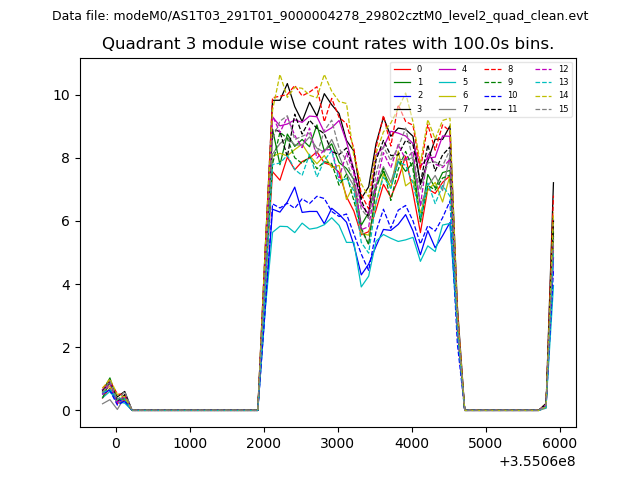
| Module-wise count rates for Quadrant C Data is divided into 100 sec bins |
 |
 |
| Module-wise count rates for Quadrant D Data is divided into 100 sec bins |
 |
 |
| Parameter | Plot |
|---|---|
| CZT HV Monitor | 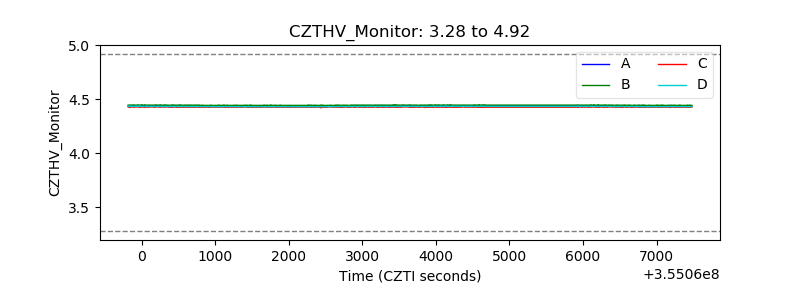 |
| D_VDD | 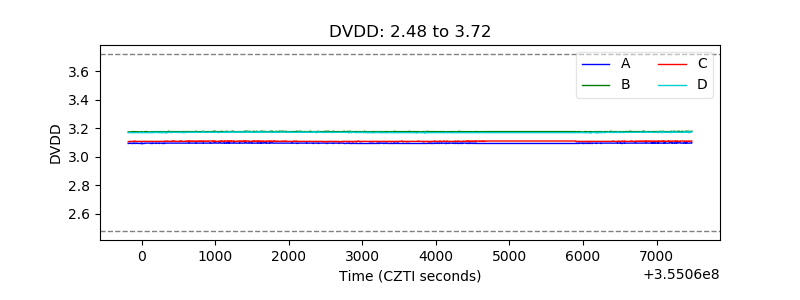 |
| Temperature 1 | 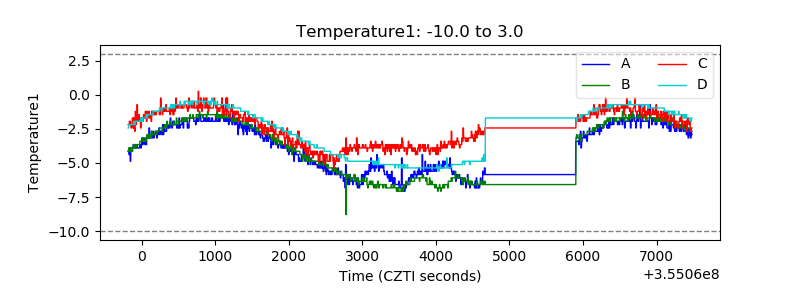 |
| Veto HV Monitor | 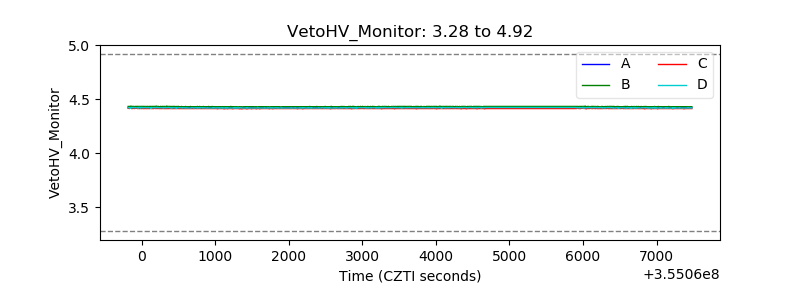 |
| Veto LLD | 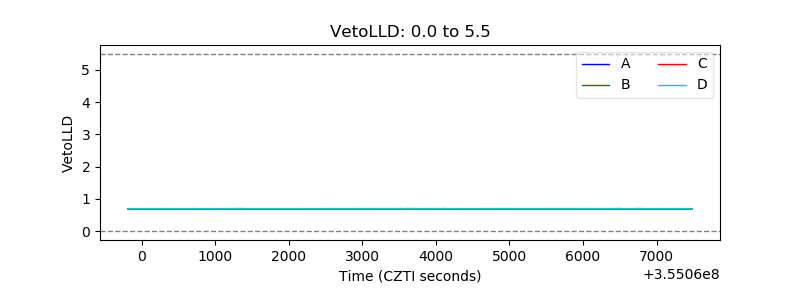 |
| Alpha Counter | 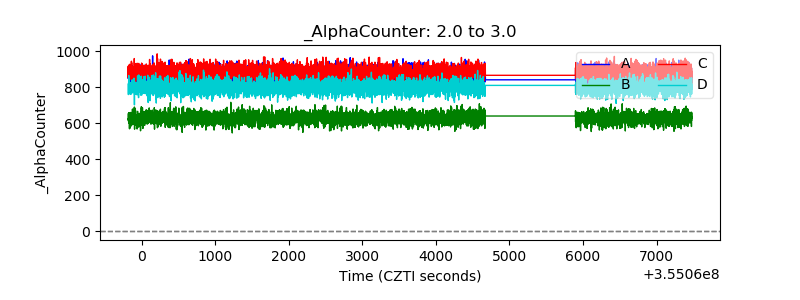 |
| _CPM_Rate | 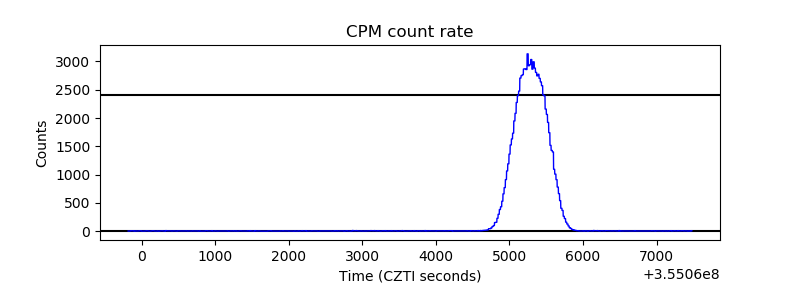 |
| CZT Counter | 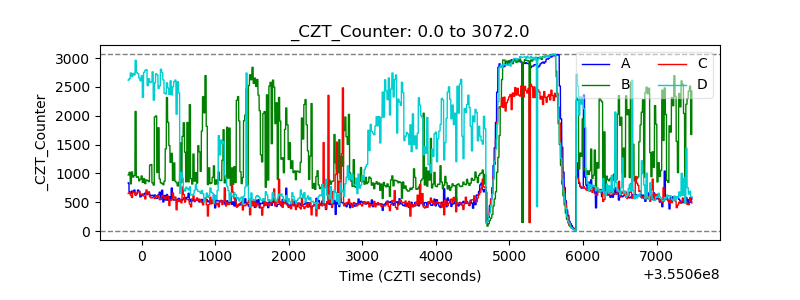 |
| +2.5 Volts monitor |  |
| +5 Volts monitor |  |
| _ROLL_ROT | 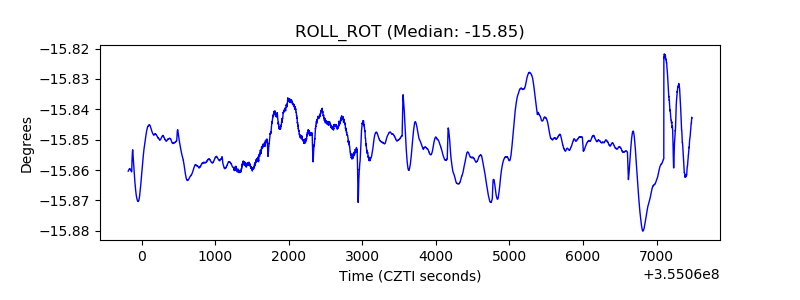 |
| _Roll_DEC | 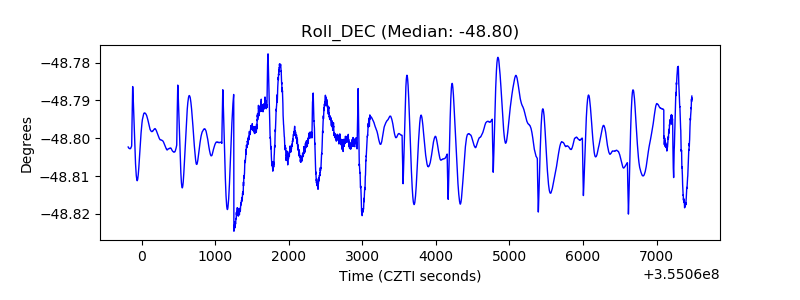 |
| _Roll_RA | 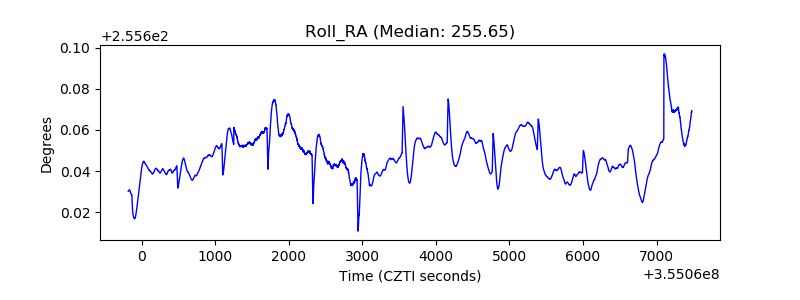 |
| Veto Counter | 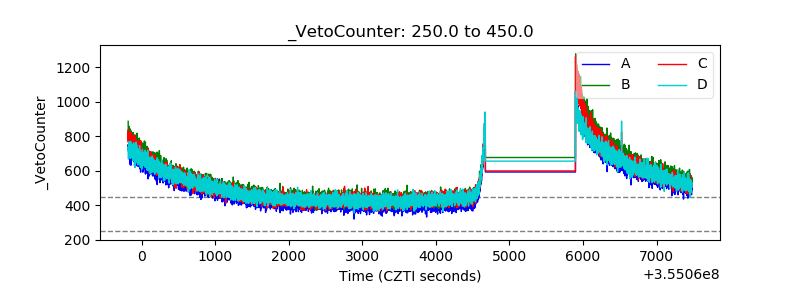 |