| Param | Original file | Final file |
|---|---|---|
| Filename | modeM0/AS1T03_291T01_9000004278_29803cztM0_level2.evt | modeM0/AS1T03_291T01_9000004278_29803cztM0_level2_quad_clean.evt |
| Size (bytes) | 737,490,240 | 72,241,920 |
| Size | 703.3 MB | 68.9 MB |
| Events in quadrant A | 3,672,861 | 469,036 |
| Events in quadrant B | 9,838,559 | 422,045 |
| Events in quadrant C | 3,762,615 | 430,554 |
| Events in quadrant D | 4,628,488 | 418,433 |
| Mode SS | |||
|---|---|---|---|
| Quadrant | BADHDUFLAG | Total packets | Discarded packets |
| A | 0 | 130 | 0 |
| B | 0 | 130 | 0 |
| C | 0 | 130 | 0 |
| D | 0 | 130 | 0 |
| Mode M0 | |||
|---|---|---|---|
| Quadrant | BADHDUFLAG | Total packets | Discarded packets |
| A | 0 | 15032 | 2 |
| B | 0 | 33585 | 2 |
| C | 0 | 15301 | 2 |
| D | 0 | 18199 | 2 |
| Mode M9 | |||
|---|---|---|---|
| Quadrant | BADHDUFLAG | Total packets | Discarded packets |
| A | 0 | 13 | 0 |
| B | 0 | 14 | 0 |
| C | 0 | 14 | 0 |
| D | 0 | 14 | 0 |
| Quadrant | Total seconds | Saturated seconds | Saturation percentage |
|---|---|---|---|
| A | 6404 | 93 | 1.452217% |
| B | 6404 | 2365 | 36.930044% |
| C | 6404 | 267 | 4.169269% |
| D | 6404 | 234 | 3.653966% |
Noise dominated data is calculated using 1-second bins in cleaned event files. If a bin has >2000 counts, and if more than 50% of those come from <1% of pixels, then it is considered to be noise-dominated and hence unusable.
| Quadrant | # 1 sec bins | Bins with >0 counts | Bins with >2000 counts | High rate bins dominated by noise | Noise dominated (total time) | Noise dominated (detector-on time) | Marked lightcurve |
|---|---|---|---|---|---|---|---|
| A | 7719 | 6405 | 8 | 8 | 0.10% | 0.12% | 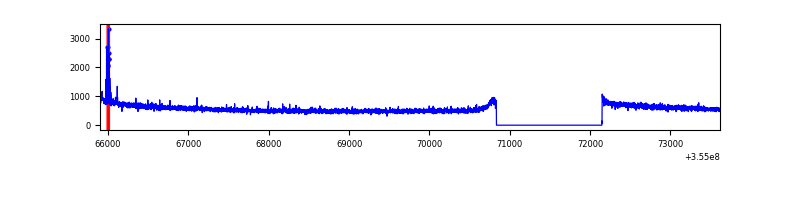 |
| B | 7719 | 6405 | 1755 | 1755 | 22.74% | 27.40% | 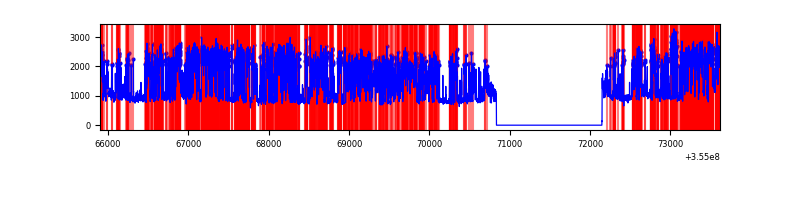 |
| C | 7719 | 6405 | 13 | 13 | 0.17% | 0.20% | 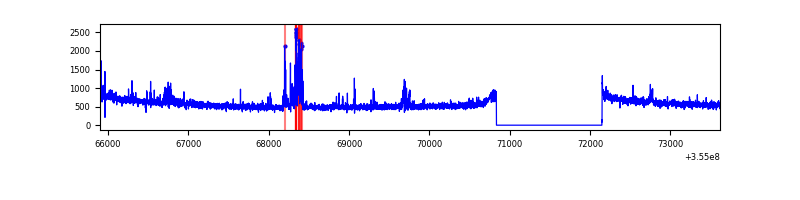 |
| D | 7719 | 6405 | 140 | 140 | 1.81% | 2.19% | 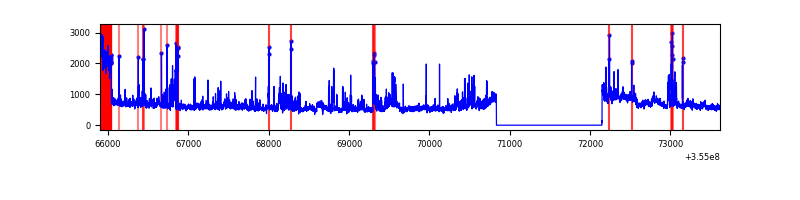 |
Top three noisy pixels from each quadrant. If the there are fewer than three noisy pixels in the level2.evt file, extra rows are filled as -1
| Pixel properties | Quadrant properties | ||||||
|---|---|---|---|---|---|---|---|
| Quadrant | DetID | PixID | Counts | Sigma | Mean | Median | Sigma |
| A | 12 | 96 | 38504 | 205.21 | 941 | 927 | 183.1 |
| A | 13 | 254 | 14970 | 76.69 | 941 | 927 | 183.1 |
| A | 3 | 137 | 8240 | 39.94 | 941 | 927 | 183.1 |
| B | 0 | 189 | 4482290 | 29506.42 | 831 | 815 | 151.9 |
| B | 6 | 159 | 1694308 | 11150.1 | 831 | 815 | 151.9 |
| B | 0 | 229 | 352170 | 2313.35 | 831 | 815 | 151.9 |
| C | 14 | 238 | 196065 | 1000.19 | 863 | 872 | 195.2 |
| C | 10 | 22 | 112250 | 570.71 | 863 | 872 | 195.2 |
| C | 14 | 254 | 72424 | 366.64 | 863 | 872 | 195.2 |
| D | 8 | 195 | 510872 | 2531.78 | 874 | 856 | 201.4 |
| D | 7 | 80 | 348623 | 1726.36 | 874 | 856 | 201.4 |
| D | 7 | 238 | 240014 | 1187.21 | 874 | 856 | 201.4 |
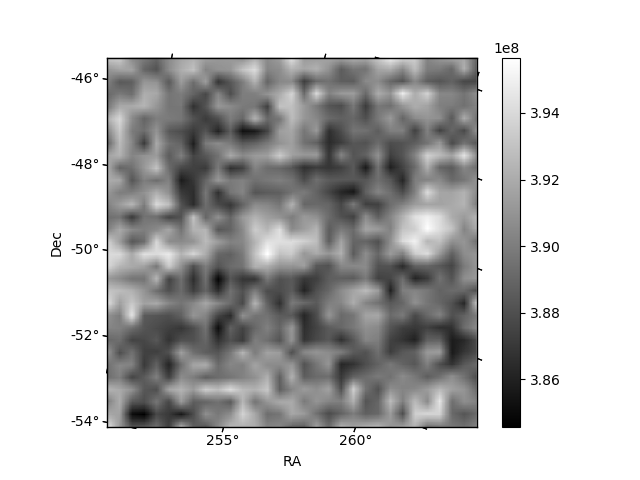
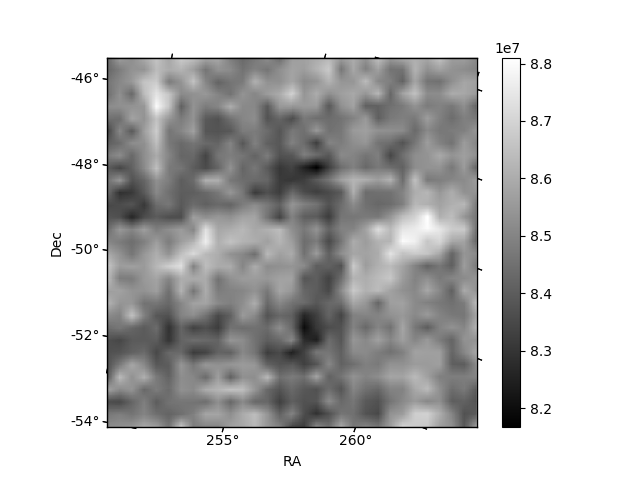
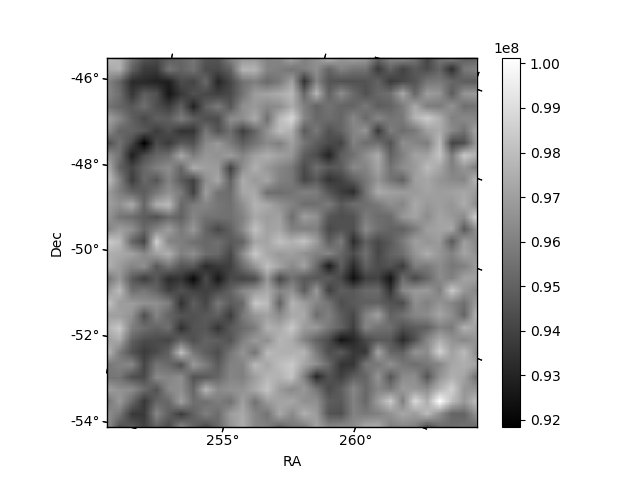
Histogram calculated using DETX and DETY for each event in the final _common_clean file
| Quadrant A | 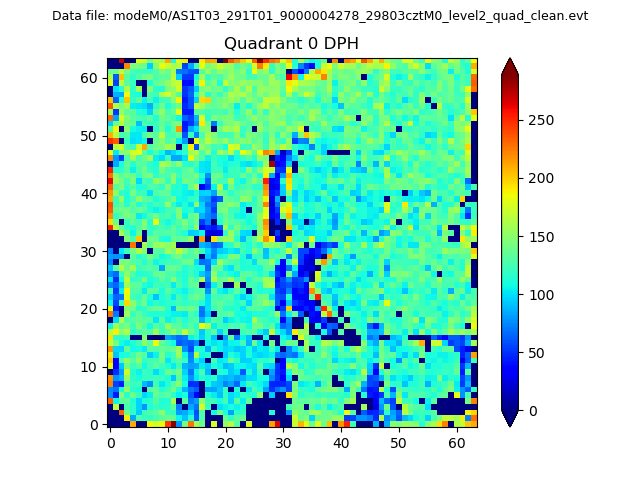 |
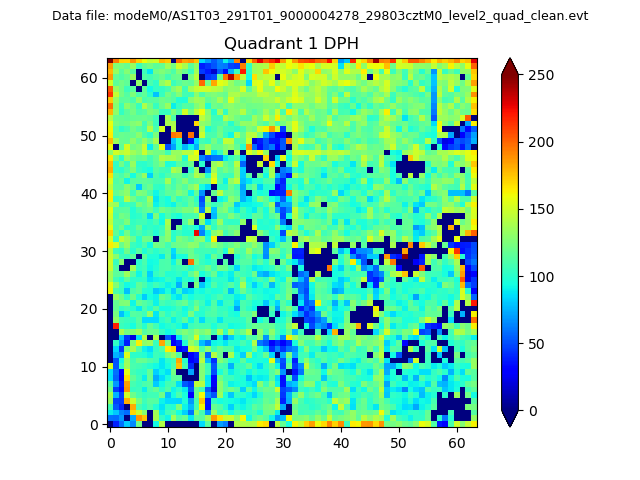 |
Quadrant B |
|---|---|---|---|
| Quadrant D | 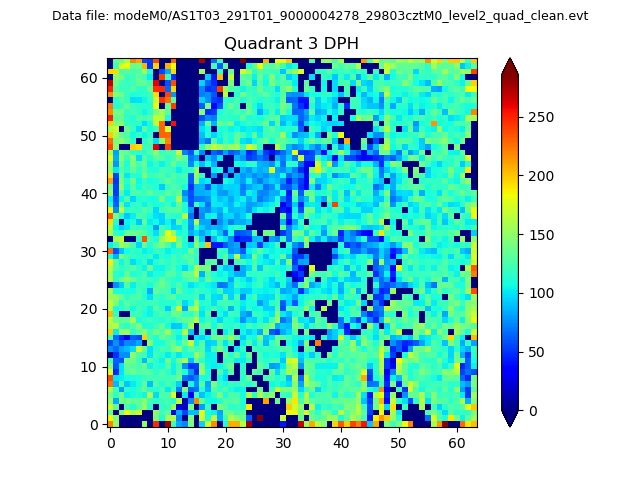 |
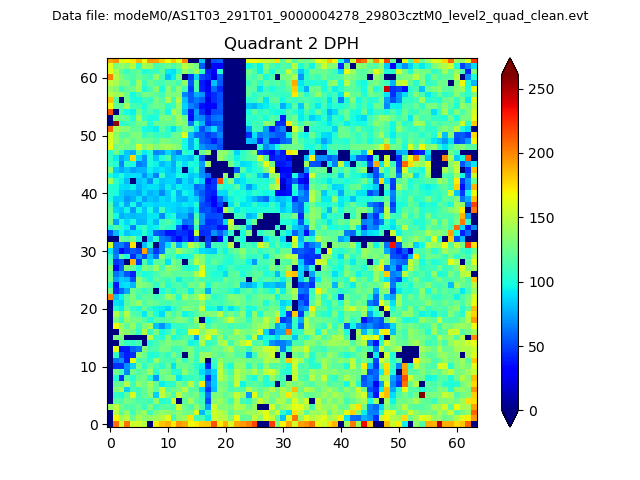 |
Quadrant C |
| Plot type | Count rate plots | Images |
|---|---|---|
| Comparison with Poisson distribution Blue bars denote a histogram of data divided into 1 sec bins. Red curve is a Poisson curve with rate = median count rate of data. |
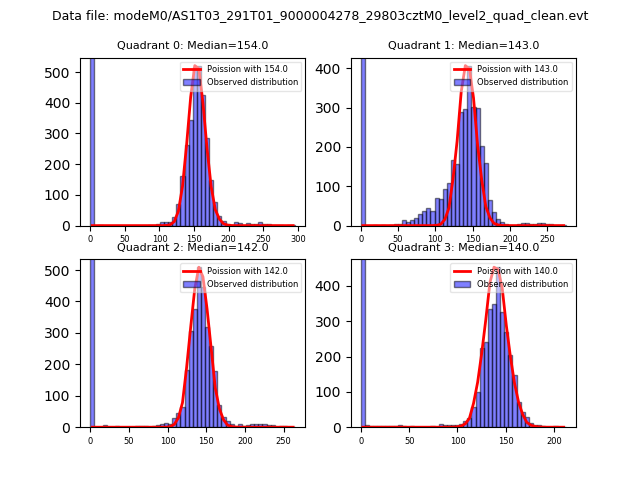 |
 |
| Quadrant-wise count rates Data is divided into 100 sec bins |
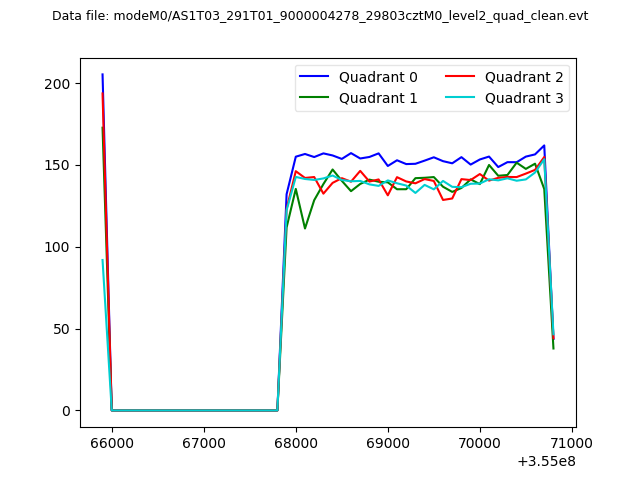 |
|
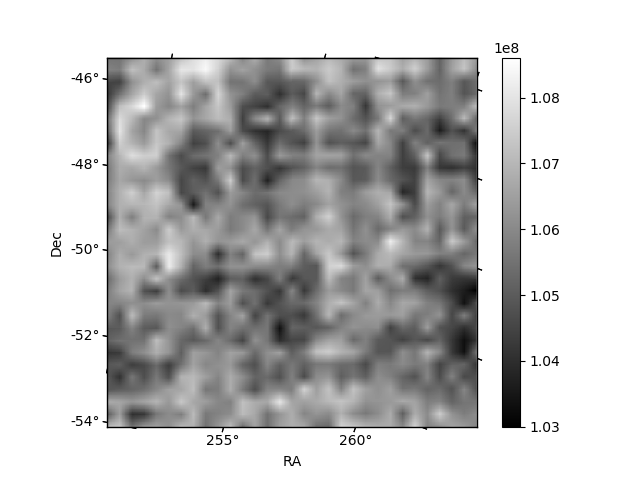
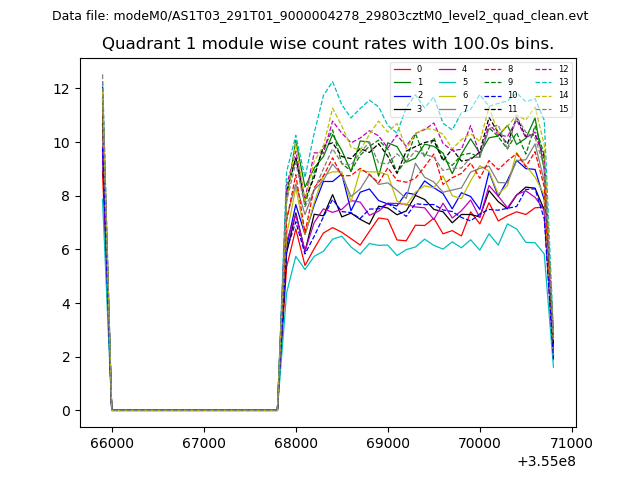
| Module-wise count rates for Quadrant A Data is divided into 100 sec bins |
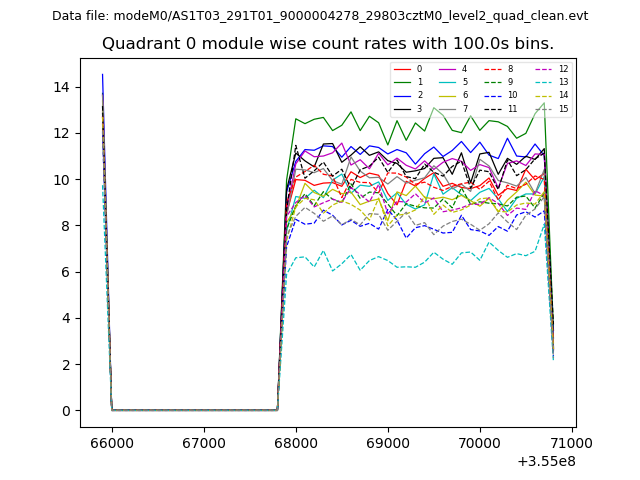 |
 |
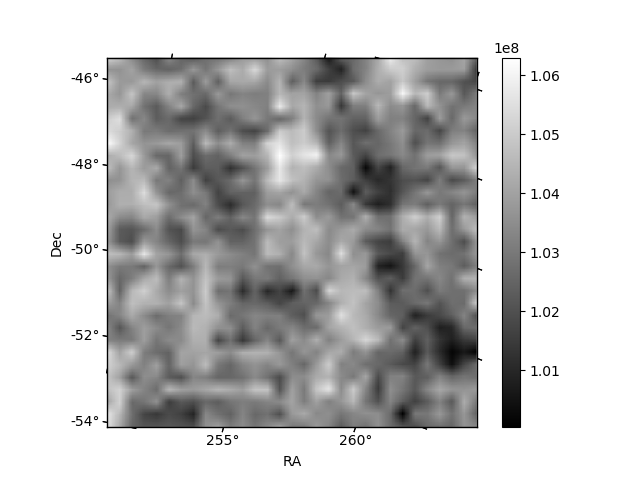
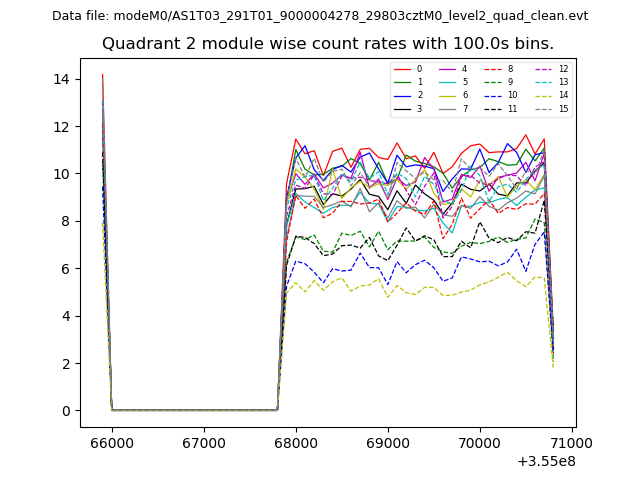
| Module-wise count rates for Quadrant B Data is divided into 100 sec bins |
 |
 |
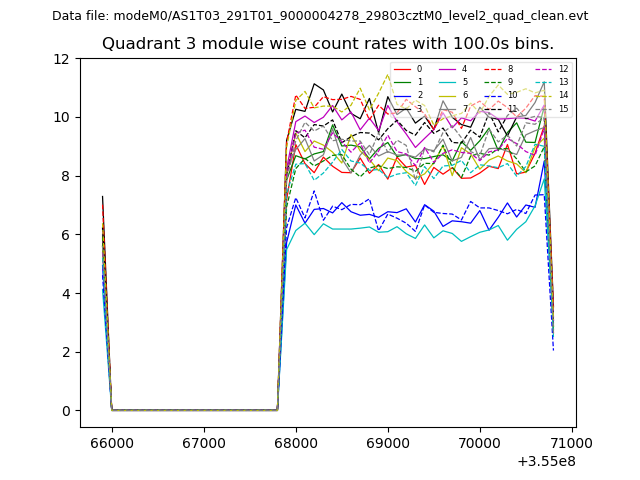
| Module-wise count rates for Quadrant C Data is divided into 100 sec bins |
 |
 |
| Module-wise count rates for Quadrant D Data is divided into 100 sec bins |
 |
 |
| Parameter | Plot |
|---|---|
| CZT HV Monitor | 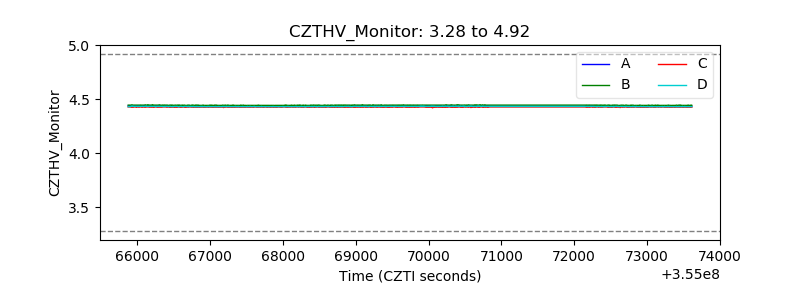 |
| D_VDD | 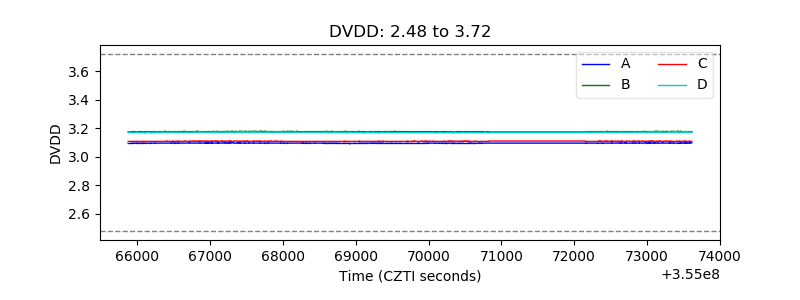 |
| Temperature 1 | 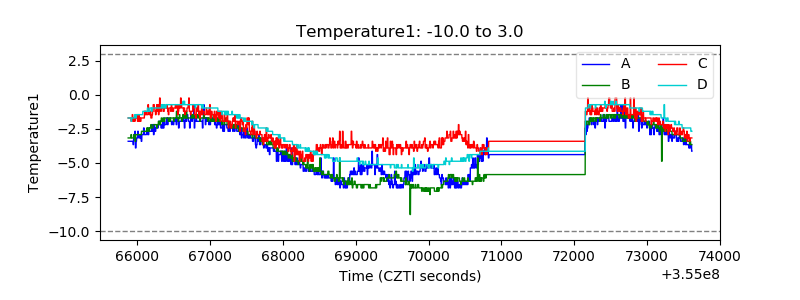 |
| Veto HV Monitor | 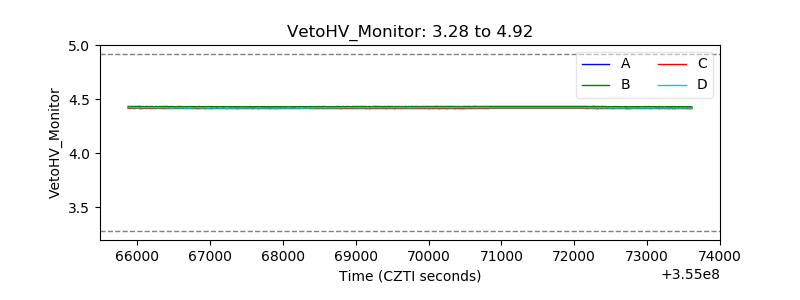 |
| Veto LLD | 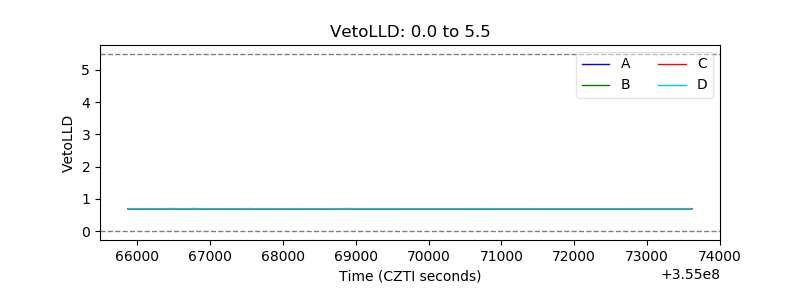 |
| Alpha Counter | 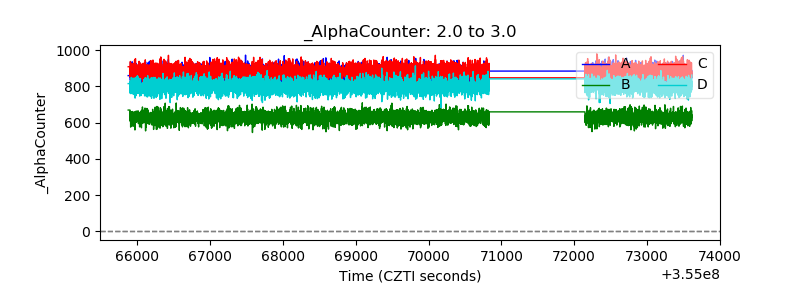 |
| _CPM_Rate | 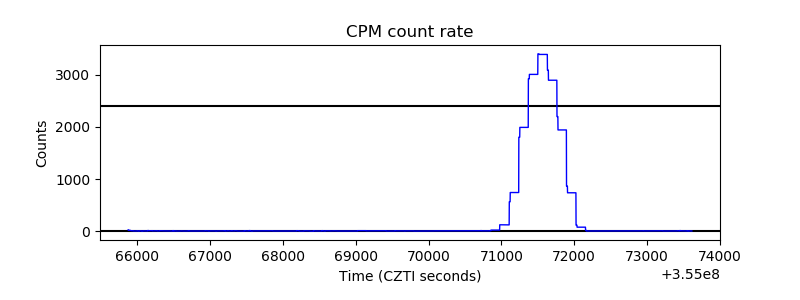 |
| CZT Counter | 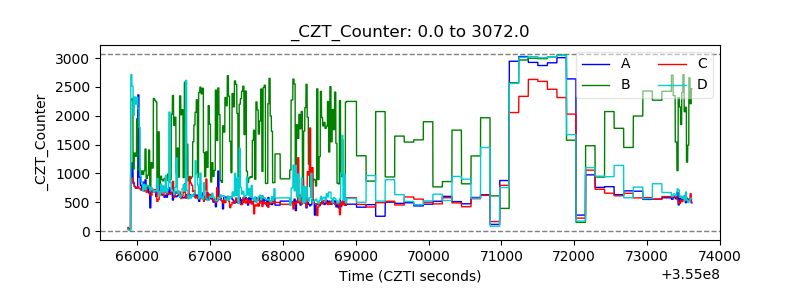 |
| +2.5 Volts monitor | 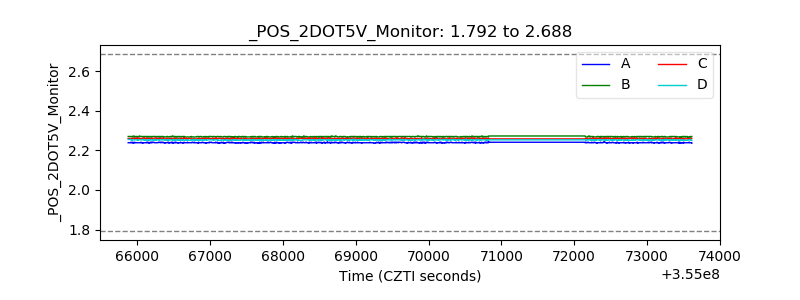 |
| +5 Volts monitor |  |
| _ROLL_ROT | 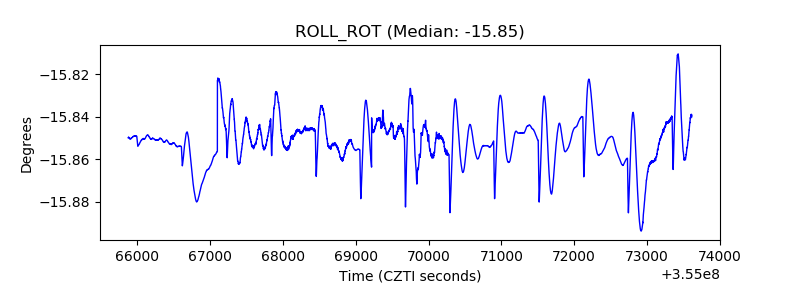 |
| _Roll_DEC | 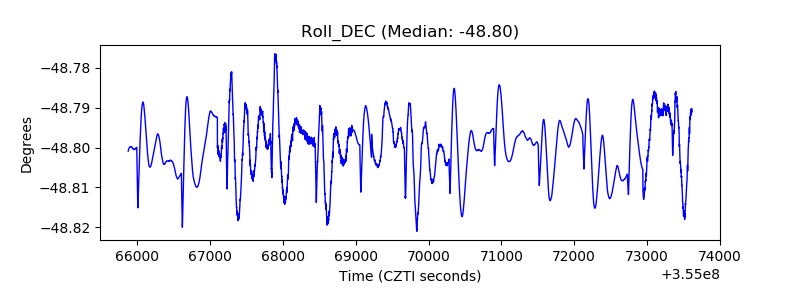 |
| _Roll_RA | 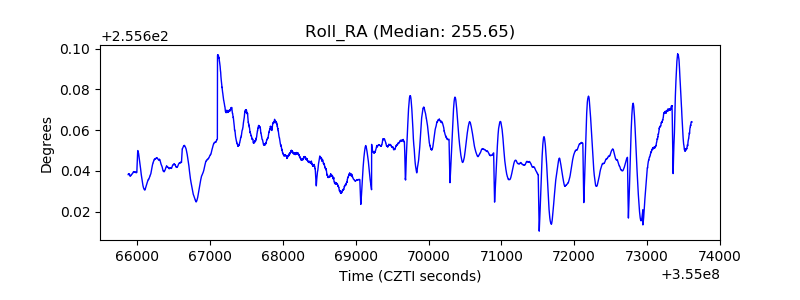 |
| Veto Counter | 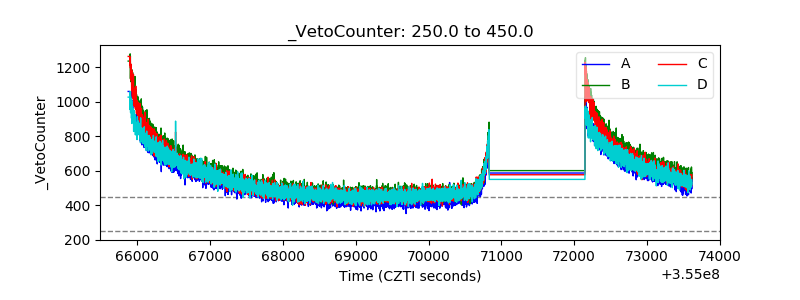 |