| Param | Original file | Final file |
|---|---|---|
| Filename | modeM0/AS1T03_291T01_9000004278_29804cztM0_level2.evt | modeM0/AS1T03_291T01_9000004278_29804cztM0_level2_quad_clean.evt |
| Size (bytes) | 772,937,280 | 78,603,840 |
| Size | 737.1 MB | 75.0 MB |
| Events in quadrant A | 3,504,987 | 531,609 |
| Events in quadrant B | 10,101,935 | 443,823 |
| Events in quadrant C | 3,564,344 | 492,085 |
| Events in quadrant D | 5,819,423 | 480,043 |
| Mode SS | |||
|---|---|---|---|
| Quadrant | BADHDUFLAG | Total packets | Discarded packets |
| A | 0 | 126 | 0 |
| B | 0 | 126 | 0 |
| C | 0 | 126 | 0 |
| D | 0 | 126 | 0 |
| Mode M0 | |||
|---|---|---|---|
| Quadrant | BADHDUFLAG | Total packets | Discarded packets |
| A | 0 | 14321 | 2 |
| B | 0 | 34220 | 4 |
| C | 0 | 14418 | 2 |
| D | 0 | 21269 | 2 |
| Mode M9 | |||
|---|---|---|---|
| Quadrant | BADHDUFLAG | Total packets | Discarded packets |
| A | 0 | 14 | 0 |
| B | 0 | 14 | 0 |
| C | 0 | 14 | 0 |
| D | 0 | 14 | 0 |
| Quadrant | Total seconds | Saturated seconds | Saturation percentage |
|---|---|---|---|
| A | 6187 | 89 | 1.438500% |
| B | 6187 | 3023 | 48.860514% |
| C | 6187 | 172 | 2.780023% |
| D | 6187 | 811 | 13.108130% |
Noise dominated data is calculated using 1-second bins in cleaned event files. If a bin has >2000 counts, and if more than 50% of those come from <1% of pixels, then it is considered to be noise-dominated and hence unusable.
| Quadrant | # 1 sec bins | Bins with >0 counts | Bins with >2000 counts | High rate bins dominated by noise | Noise dominated (total time) | Noise dominated (detector-on time) | Marked lightcurve |
|---|---|---|---|---|---|---|---|
| A | 7522 | 6188 | 0 | 0 | 0.00% | 0.00% | 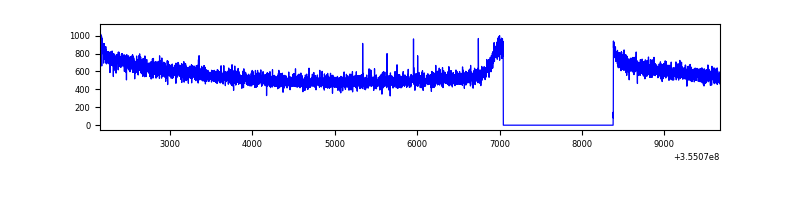 |
| B | 7522 | 6188 | 2320 | 2320 | 30.84% | 37.49% | 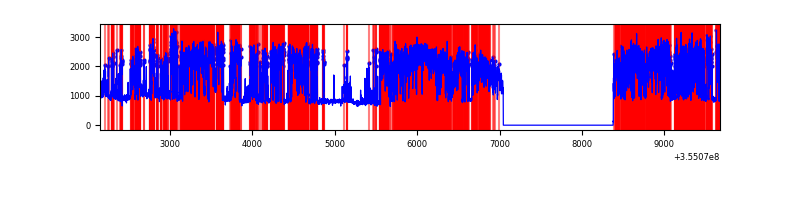 |
| C | 7522 | 6188 | 7 | 7 | 0.09% | 0.11% | 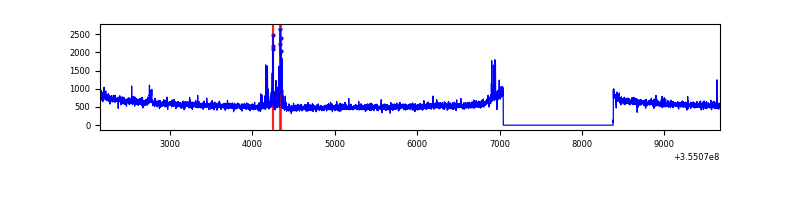 |
| D | 7522 | 6188 | 771 | 771 | 10.25% | 12.46% | 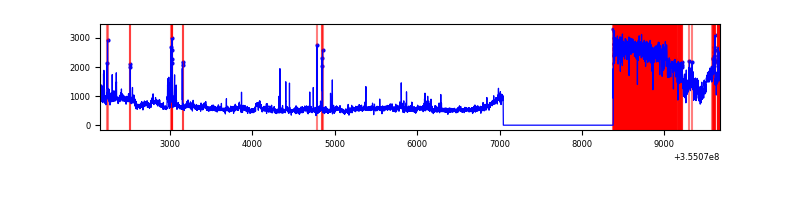 |
Top three noisy pixels from each quadrant. If the there are fewer than three noisy pixels in the level2.evt file, extra rows are filled as -1
| Pixel properties | Quadrant properties | ||||||
|---|---|---|---|---|---|---|---|
| Quadrant | DetID | PixID | Counts | Sigma | Mean | Median | Sigma |
| A | 13 | 254 | 14487 | 76.17 | 907 | 891 | 178.5 |
| A | 3 | 137 | 8054 | 40.13 | 907 | 891 | 178.5 |
| A | 0 | 226 | 7658 | 37.91 | 907 | 891 | 178.5 |
| B | 0 | 189 | 5228537 | 37872.39 | 757 | 743 | 138.0 |
| B | 6 | 159 | 1602056 | 11600.6 | 757 | 743 | 138.0 |
| B | 0 | 229 | 278310 | 2010.81 | 757 | 743 | 138.0 |
| C | 14 | 238 | 151945 | 797.84 | 839 | 845 | 189.4 |
| C | 10 | 22 | 105202 | 551.03 | 839 | 845 | 189.4 |
| C | 14 | 254 | 16822 | 84.36 | 839 | 845 | 189.4 |
| D | 7 | 238 | 2076610 | 11194.5 | 788 | 770 | 185.4 |
| D | 8 | 195 | 480904 | 2589.25 | 788 | 770 | 185.4 |
| D | 7 | 80 | 165858 | 890.28 | 788 | 770 | 185.4 |
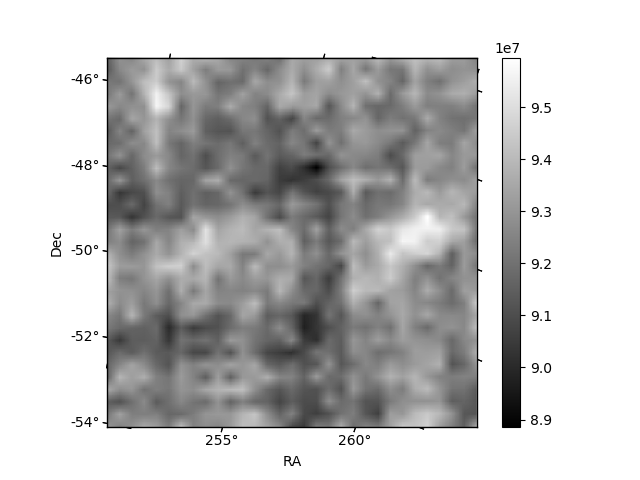
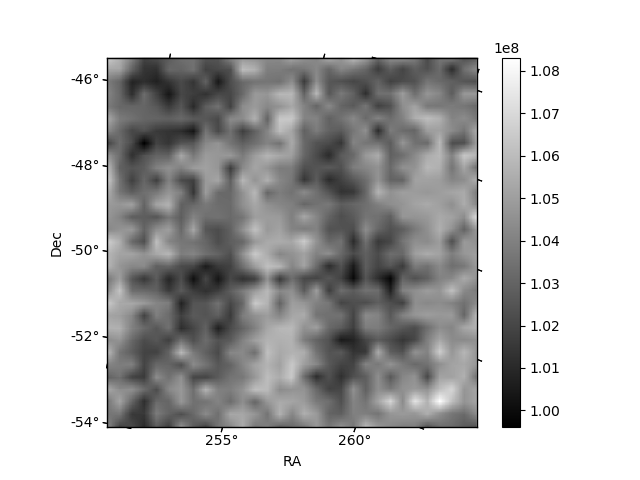
Histogram calculated using DETX and DETY for each event in the final _common_clean file
| Quadrant A |  |
 |
Quadrant B |
|---|---|---|---|
| Quadrant D |  |
 |
Quadrant C |
| Plot type | Count rate plots | Images |
|---|---|---|
| Comparison with Poisson distribution Blue bars denote a histogram of data divided into 1 sec bins. Red curve is a Poisson curve with rate = median count rate of data. |
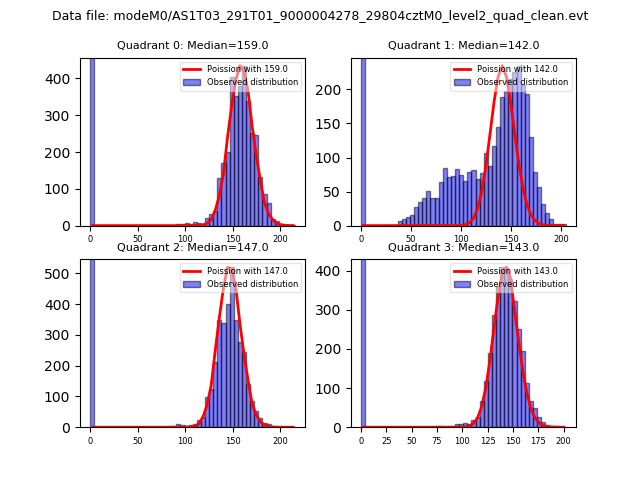 |
 |
| Quadrant-wise count rates Data is divided into 100 sec bins |
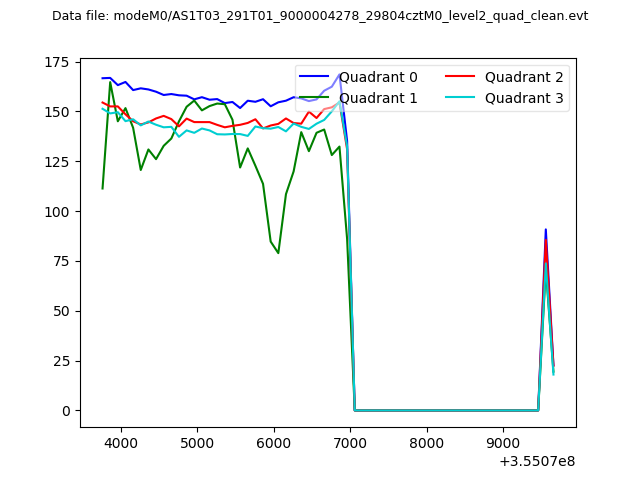 |
|
| Module-wise count rates for Quadrant A Data is divided into 100 sec bins |
 |
 |
| Module-wise count rates for Quadrant B Data is divided into 100 sec bins |
 |
 |
| Module-wise count rates for Quadrant C Data is divided into 100 sec bins |
 |
 |
| Module-wise count rates for Quadrant D Data is divided into 100 sec bins |
 |
 |
| Parameter | Plot |
|---|---|
| CZT HV Monitor |  |
| D_VDD | 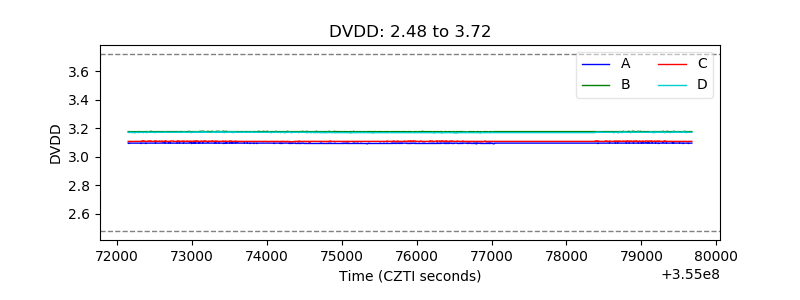 |
| Temperature 1 |  |
| Veto HV Monitor |  |
| Veto LLD |  |
| Alpha Counter |  |
| _CPM_Rate | 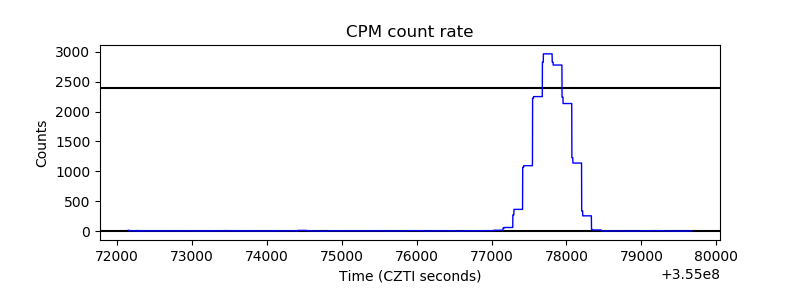 |
| CZT Counter |  |
| +2.5 Volts monitor |  |
| +5 Volts monitor |  |
| _ROLL_ROT |  |
| _Roll_DEC |  |
| _Roll_RA |  |
| Veto Counter |  |