| Param | Original file | Final file |
|---|---|---|
| Filename | modeM0/AS1T03_291T01_9000004278_29805cztM0_level2.evt | modeM0/AS1T03_291T01_9000004278_29805cztM0_level2_quad_clean.evt |
| Size (bytes) | 912,706,560 | 88,632,000 |
| Size | 870.4 MB | 84.5 MB |
| Events in quadrant A | 3,168,588 | 664,842 |
| Events in quadrant B | 8,417,980 | 620,800 |
| Events in quadrant C | 3,272,340 | 617,502 |
| Events in quadrant D | 12,377,359 | 358,650 |
| Mode SS | |||
|---|---|---|---|
| Quadrant | BADHDUFLAG | Total packets | Discarded packets |
| A | 0 | 124 | 0 |
| B | 0 | 124 | 0 |
| C | 0 | 124 | 0 |
| D | 0 | 124 | 0 |
| Mode M0 | |||
|---|---|---|---|
| Quadrant | BADHDUFLAG | Total packets | Discarded packets |
| A | 0 | 12972 | 1 |
| B | 0 | 29136 | 3 |
| C | 0 | 13217 | 1 |
| D | 0 | 40927 | 1 |
| Mode M9 | |||
|---|---|---|---|
| Quadrant | BADHDUFLAG | Total packets | Discarded packets |
| A | 0 | 13 | 0 |
| B | 0 | 13 | 0 |
| C | 0 | 13 | 0 |
| D | 0 | 13 | 0 |
| Quadrant | Total seconds | Saturated seconds | Saturation percentage |
|---|---|---|---|
| A | 6018 | 49 | 0.814224% |
| B | 6017 | 1604 | 26.657803% |
| C | 6017 | 105 | 1.745056% |
| D | 6018 | 3428 | 56.962446% |
Noise dominated data is calculated using 1-second bins in cleaned event files. If a bin has >2000 counts, and if more than 50% of those come from <1% of pixels, then it is considered to be noise-dominated and hence unusable.
| Quadrant | # 1 sec bins | Bins with >0 counts | Bins with >2000 counts | High rate bins dominated by noise | Noise dominated (total time) | Noise dominated (detector-on time) | Marked lightcurve |
|---|---|---|---|---|---|---|---|
| A | 7343 | 6019 | 0 | 0 | 0.00% | 0.00% | 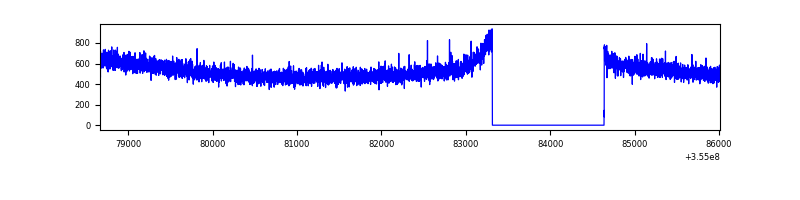 |
| B | 7342 | 6018 | 1085 | 1085 | 14.78% | 18.03% | 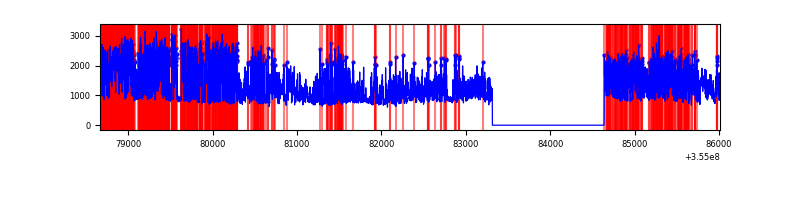 |
| C | 7342 | 6018 | 17 | 17 | 0.23% | 0.28% | 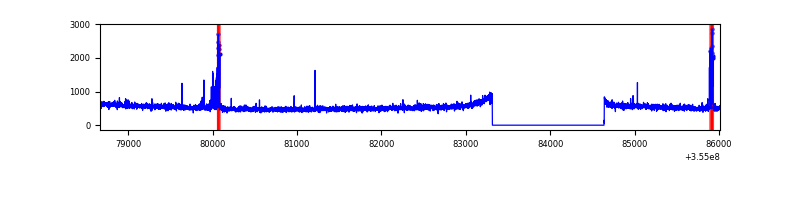 |
| D | 7343 | 6019 | 3640 | 3640 | 49.57% | 60.48% | 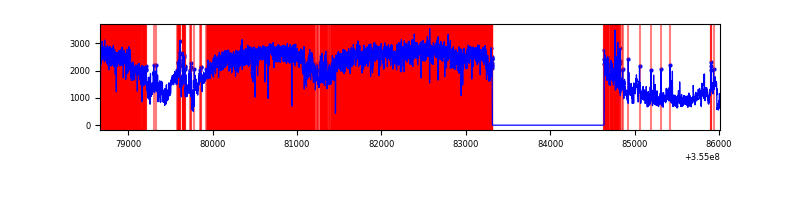 |
Top three noisy pixels from each quadrant. If the there are fewer than three noisy pixels in the level2.evt file, extra rows are filled as -1
| Pixel properties | Quadrant properties | ||||||
|---|---|---|---|---|---|---|---|
| Quadrant | DetID | PixID | Counts | Sigma | Mean | Median | Sigma |
| A | 13 | 254 | 12998 | 75.38 | 820 | 806 | 161.7 |
| A | 3 | 137 | 7361 | 40.53 | 820 | 806 | 161.7 |
| A | 0 | 226 | 7184 | 39.44 | 820 | 806 | 161.7 |
| B | 0 | 189 | 3641508 | 26343.67 | 751 | 736 | 138.2 |
| B | 6 | 159 | 1722880 | 12460.98 | 751 | 736 | 138.2 |
| B | 0 | 229 | 70017 | 501.3 | 751 | 736 | 138.2 |
| C | 14 | 238 | 132621 | 743.48 | 772 | 780 | 177.3 |
| C | 10 | 22 | 97466 | 545.23 | 772 | 780 | 177.3 |
| C | 3 | 233 | 15396 | 82.42 | 772 | 780 | 177.3 |
| D | 7 | 238 | 9585040 | 72904.39 | 555 | 540 | 131.5 |
| D | 8 | 195 | 379636 | 2883.59 | 555 | 540 | 131.5 |
| D | 7 | 80 | 100498 | 760.33 | 555 | 540 | 131.5 |
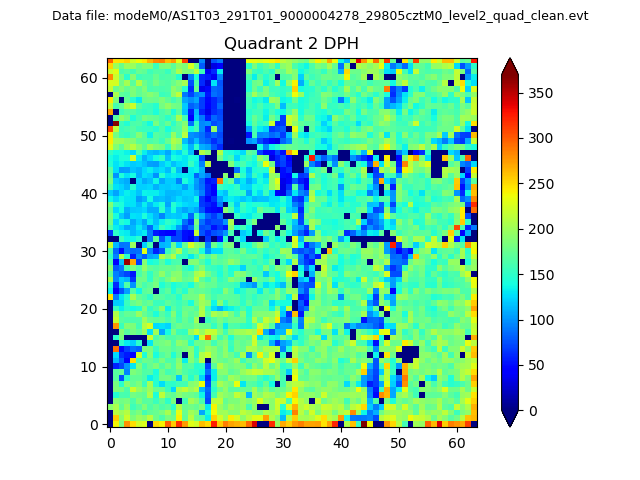
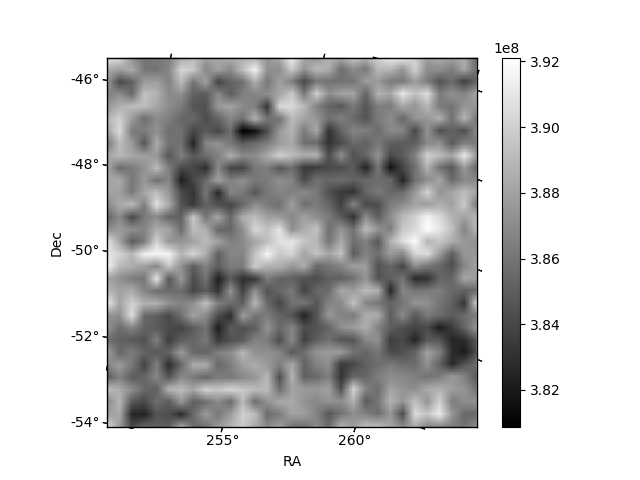
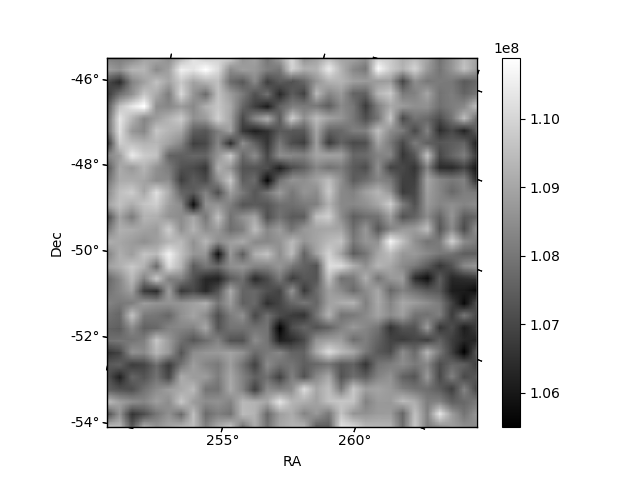
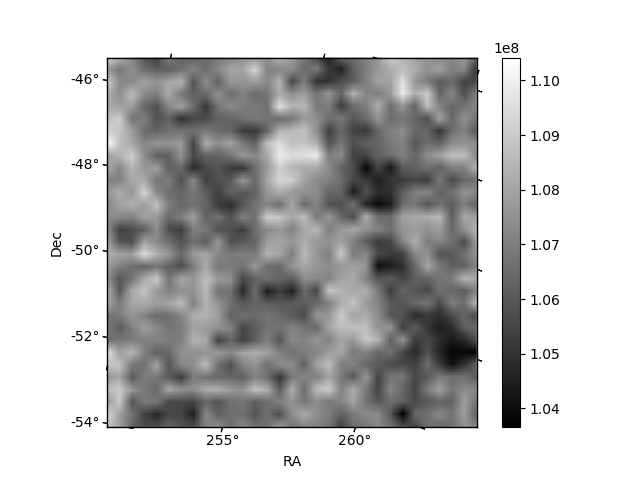
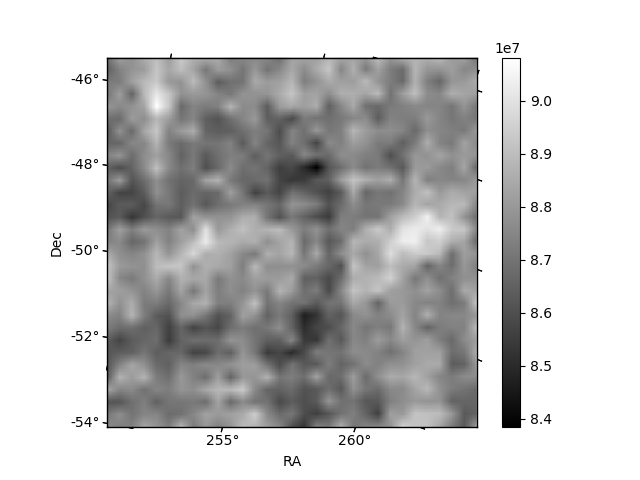
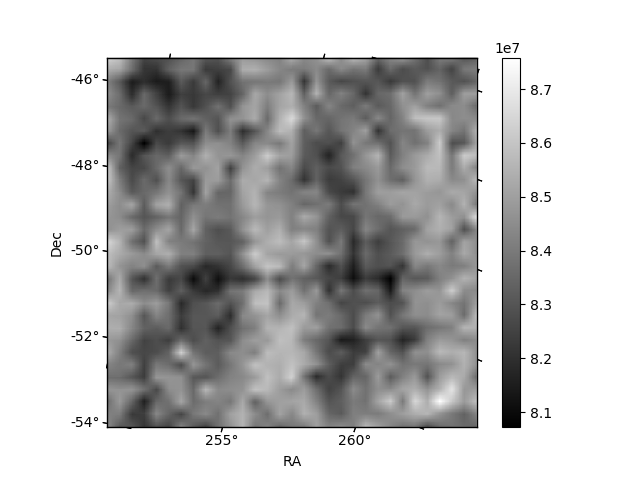
Histogram calculated using DETX and DETY for each event in the final _common_clean file
| Quadrant A | 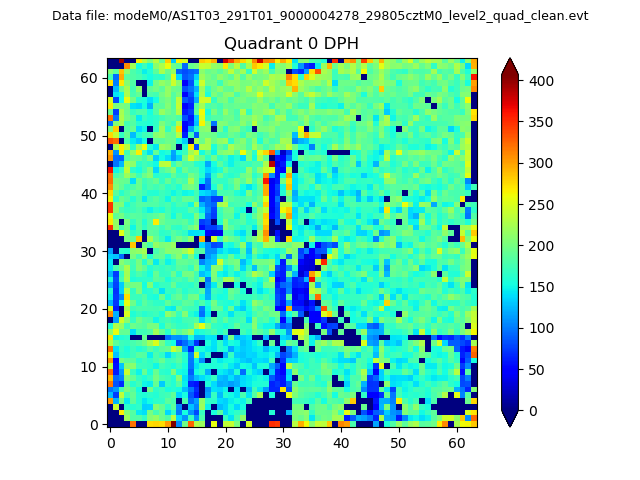 |
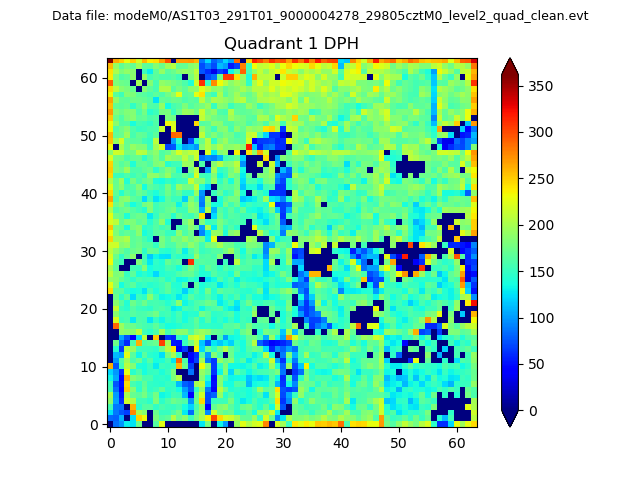 |
Quadrant B |
|---|---|---|---|
| Quadrant D | 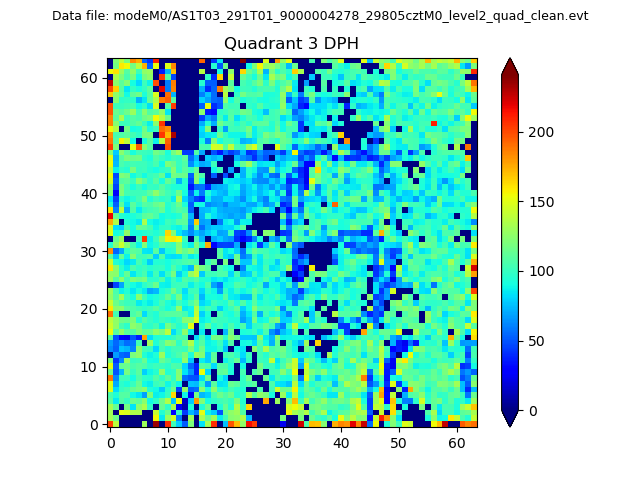 |
 |
Quadrant C |
| Plot type | Count rate plots | Images |
|---|---|---|
| Comparison with Poisson distribution Blue bars denote a histogram of data divided into 1 sec bins. Red curve is a Poisson curve with rate = median count rate of data. |
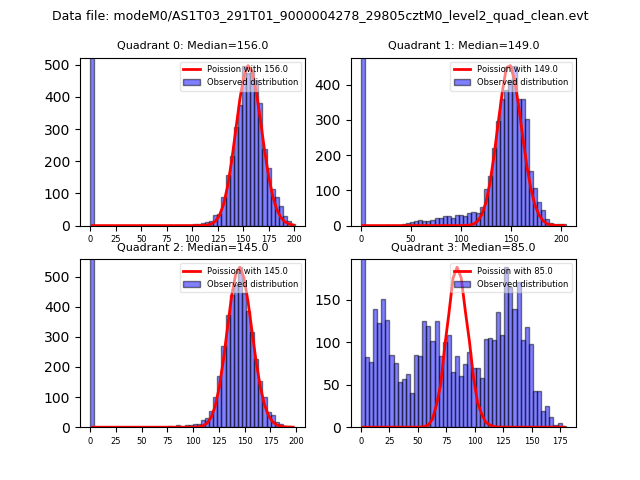 |
 |
| Quadrant-wise count rates Data is divided into 100 sec bins |
 |
|
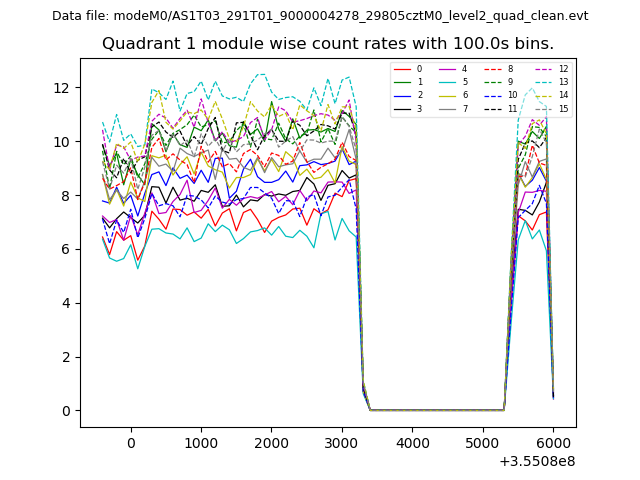
| Module-wise count rates for Quadrant A Data is divided into 100 sec bins |
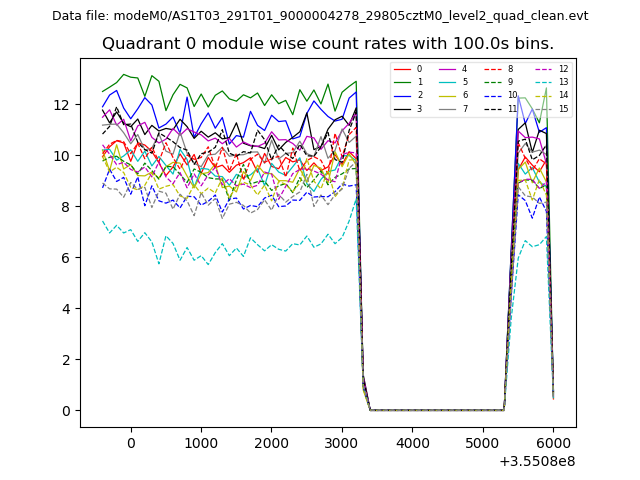 |
 |
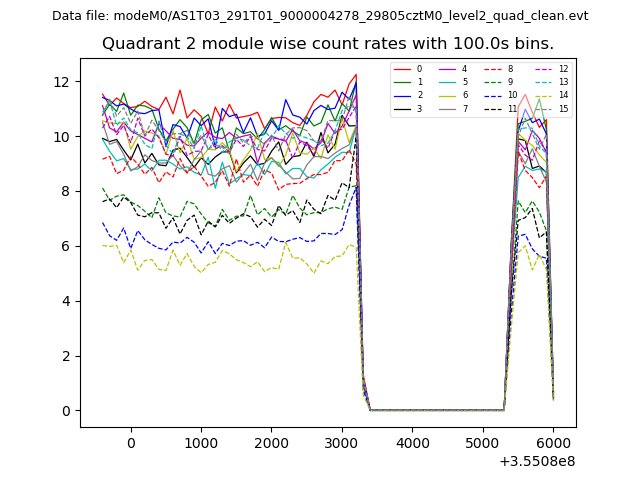
| Module-wise count rates for Quadrant B Data is divided into 100 sec bins |
 |
 |
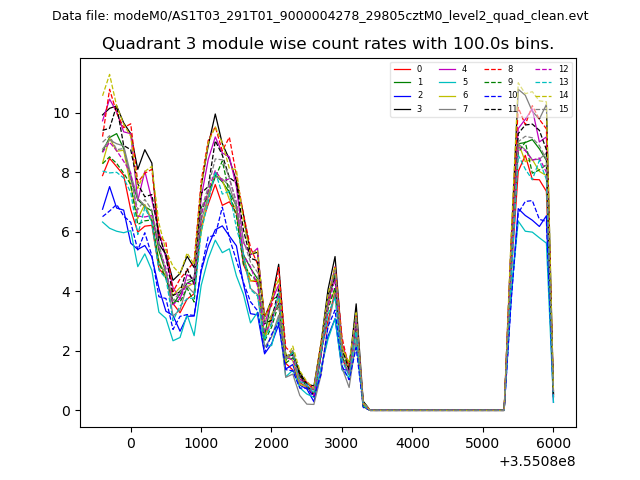
| Module-wise count rates for Quadrant C Data is divided into 100 sec bins |
 |
 |
| Module-wise count rates for Quadrant D Data is divided into 100 sec bins |
 |
 |
| Parameter | Plot |
|---|---|
| CZT HV Monitor | 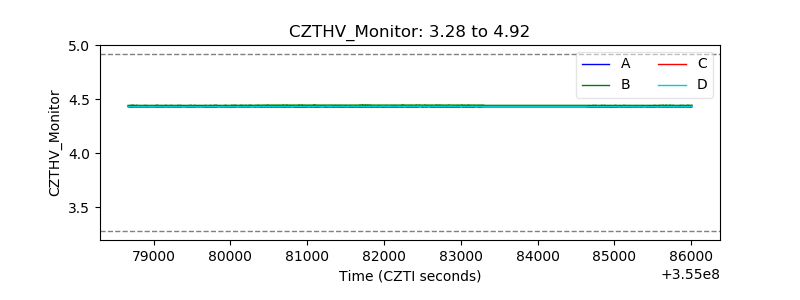 |
| D_VDD | 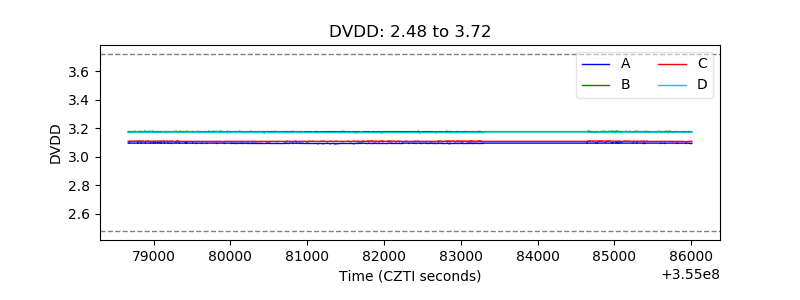 |
| Temperature 1 | 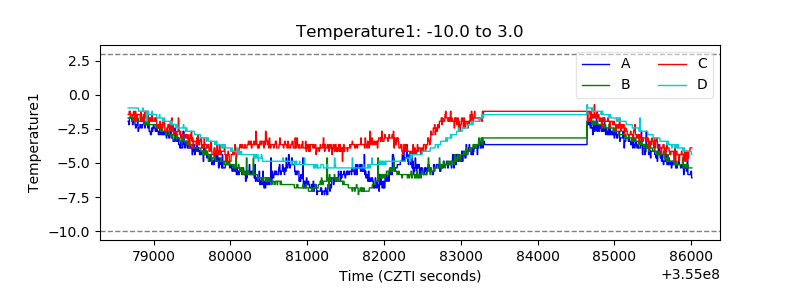 |
| Veto HV Monitor | 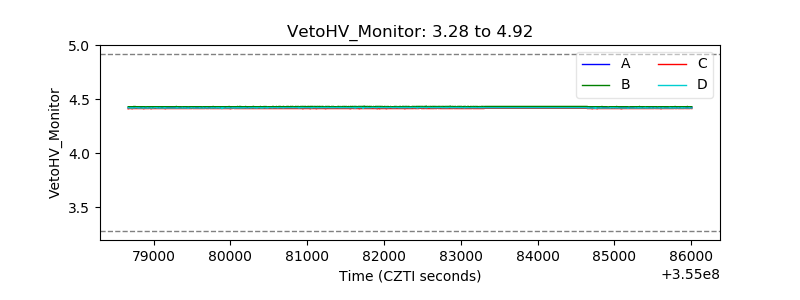 |
| Veto LLD | 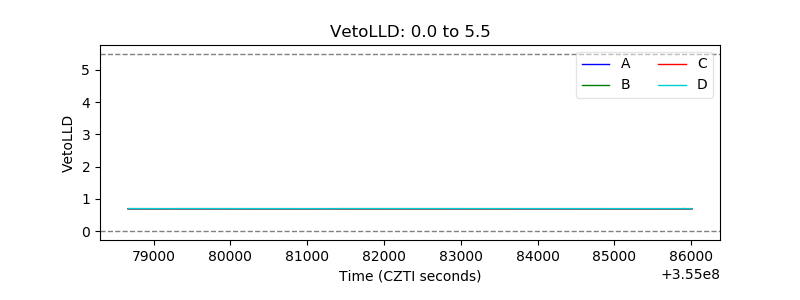 |
| Alpha Counter | 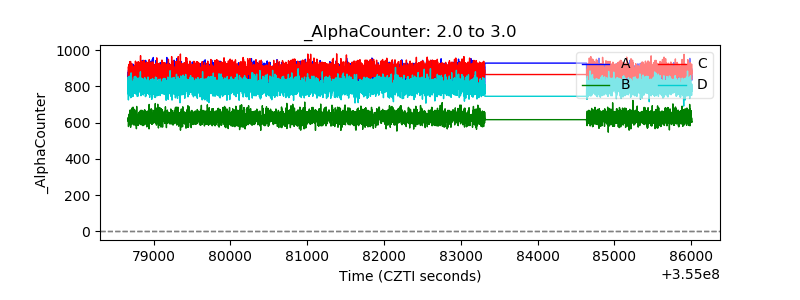 |
| _CPM_Rate |  |
| CZT Counter | 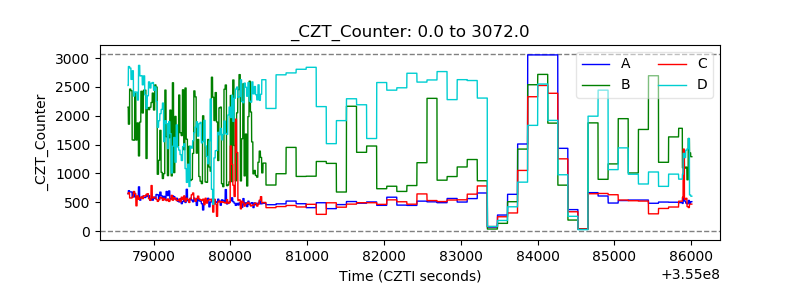 |
| +2.5 Volts monitor | 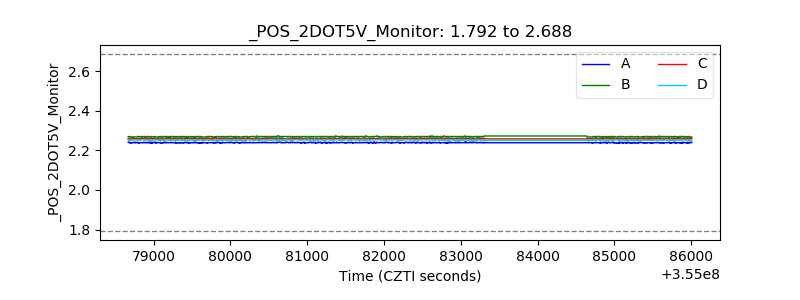 |
| +5 Volts monitor |  |
| _ROLL_ROT | 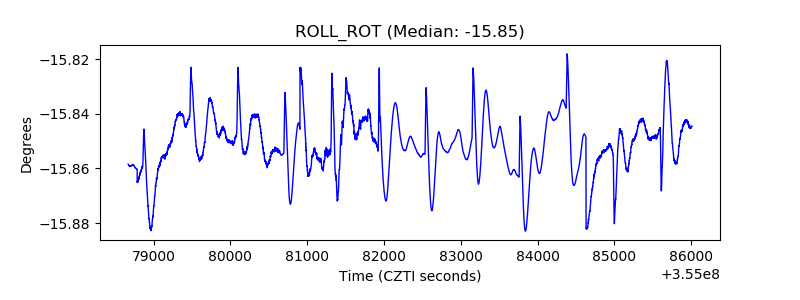 |
| _Roll_DEC | 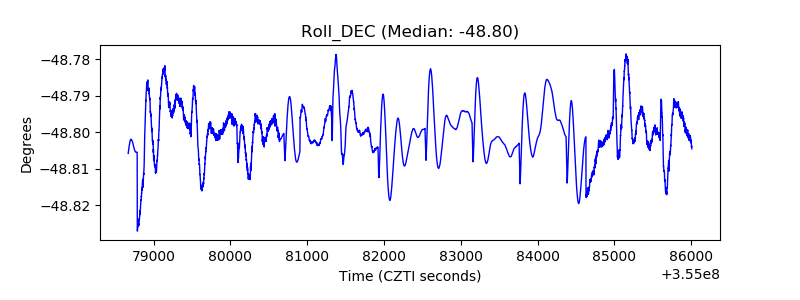 |
| _Roll_RA | 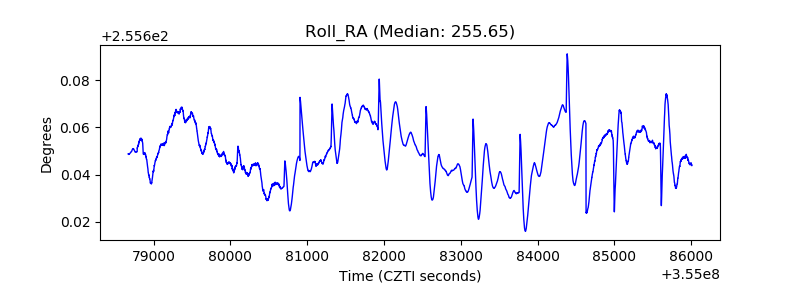 |
| Veto Counter | 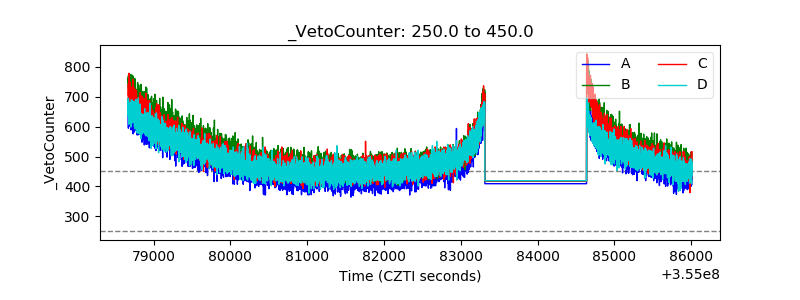 |