| Param | Original file | Final file |
|---|---|---|
| Filename | modeM0/AS1T03_291T01_9000004278_29806cztM0_level2.evt | modeM0/AS1T03_291T01_9000004278_29806cztM0_level2_quad_clean.evt |
| Size (bytes) | 892,984,320 | 97,418,880 |
| Size | 851.6 MB | 92.9 MB |
| Events in quadrant A | 3,289,348 | 711,039 |
| Events in quadrant B | 9,522,061 | 649,674 |
| Events in quadrant C | 3,424,175 | 667,776 |
| Events in quadrant D | 10,364,630 | 460,725 |
| Mode SS | |||
|---|---|---|---|
| Quadrant | BADHDUFLAG | Total packets | Discarded packets |
| A | 0 | 134 | 0 |
| B | 0 | 134 | 0 |
| C | 0 | 134 | 0 |
| D | 0 | 134 | 0 |
| Mode M0 | |||
|---|---|---|---|
| Quadrant | BADHDUFLAG | Total packets | Discarded packets |
| A | 0 | 13808 | 2 |
| B | 0 | 32822 | 2 |
| C | 0 | 14101 | 3 |
| D | 0 | 35343 | 2 |
| Mode M9 | |||
|---|---|---|---|
| Quadrant | BADHDUFLAG | Total packets | Discarded packets |
| A | 0 | 20 | 0 |
| B | 0 | 21 | 0 |
| C | 0 | 21 | 0 |
| D | 0 | 21 | 0 |
| Quadrant | Total seconds | Saturated seconds | Saturation percentage |
|---|---|---|---|
| A | 6588 | 44 | 0.667881% |
| B | 6588 | 1954 | 29.659988% |
| C | 6587 | 97 | 1.472598% |
| D | 6587 | 2743 | 41.642629% |
Noise dominated data is calculated using 1-second bins in cleaned event files. If a bin has >2000 counts, and if more than 50% of those come from <1% of pixels, then it is considered to be noise-dominated and hence unusable.
| Quadrant | # 1 sec bins | Bins with >0 counts | Bins with >2000 counts | High rate bins dominated by noise | Noise dominated (total time) | Noise dominated (detector-on time) | Marked lightcurve |
|---|---|---|---|---|---|---|---|
| A | 7653 | 6589 | 0 | 0 | 0.00% | 0.00% | 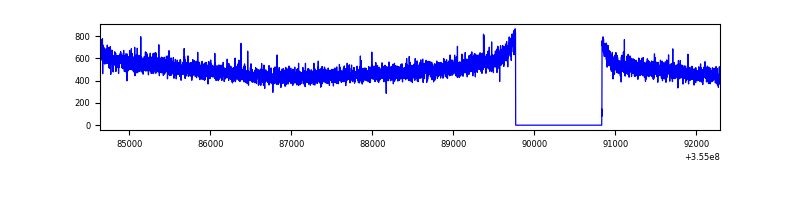 |
| B | 7653 | 6589 | 1183 | 1183 | 15.46% | 17.95% | 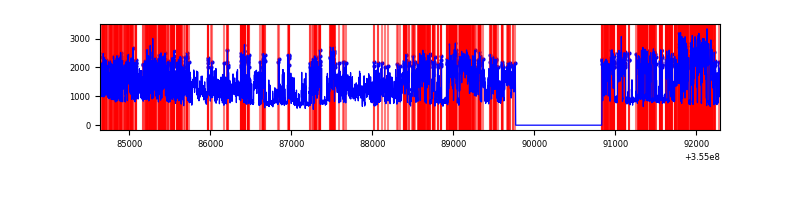 |
| C | 7652 | 6588 | 19 | 19 | 0.25% | 0.29% | 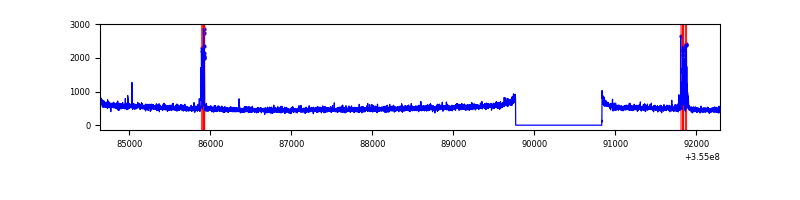 |
| D | 7652 | 6588 | 2653 | 2653 | 34.67% | 40.27% | 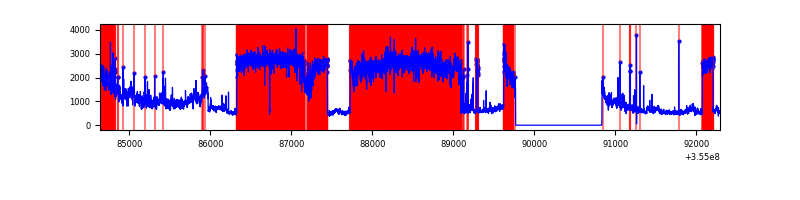 |
Top three noisy pixels from each quadrant. If the there are fewer than three noisy pixels in the level2.evt file, extra rows are filled as -1
| Pixel properties | Quadrant properties | ||||||
|---|---|---|---|---|---|---|---|
| Quadrant | DetID | PixID | Counts | Sigma | Mean | Median | Sigma |
| A | 13 | 254 | 13284 | 73.77 | 853 | 839 | 168.7 |
| A | 3 | 137 | 7985 | 42.36 | 853 | 839 | 168.7 |
| A | 0 | 226 | 7293 | 38.26 | 853 | 839 | 168.7 |
| B | 0 | 189 | 4355878 | 29601.49 | 784 | 767 | 147.1 |
| B | 6 | 159 | 1875204 | 12740.46 | 784 | 767 | 147.1 |
| B | 15 | 33 | 77762 | 523.33 | 784 | 767 | 147.1 |
| C | 14 | 238 | 136779 | 723.42 | 808 | 815 | 187.9 |
| C | 10 | 22 | 101846 | 537.55 | 808 | 815 | 187.9 |
| C | 3 | 233 | 20352 | 103.95 | 808 | 815 | 187.9 |
| D | 7 | 238 | 7156085 | 46204.09 | 654 | 638 | 154.9 |
| D | 8 | 195 | 453137 | 2921.87 | 654 | 638 | 154.9 |
| D | 13 | 138 | 73260 | 468.93 | 654 | 638 | 154.9 |
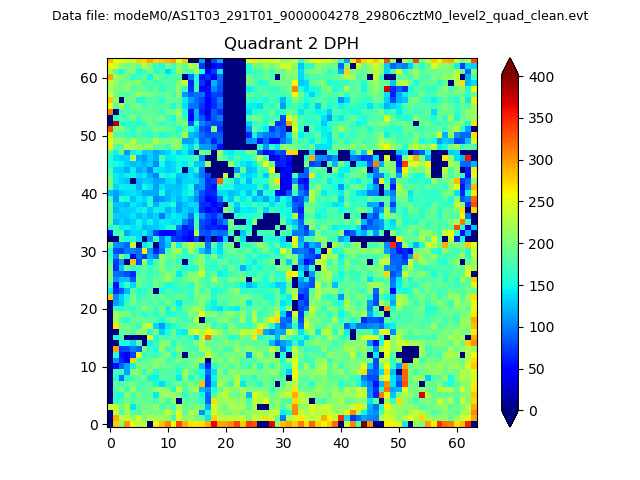
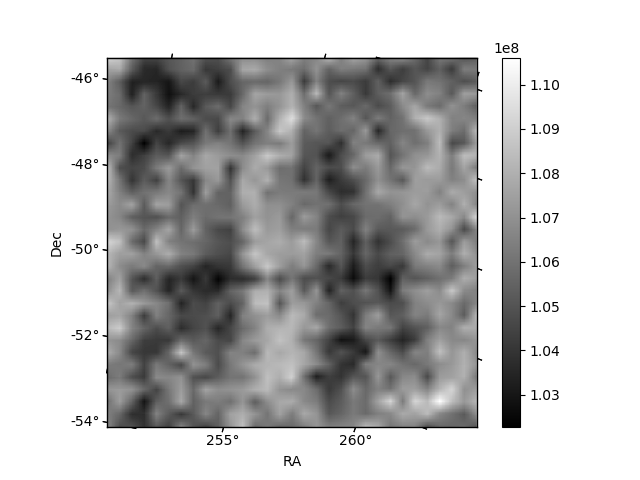
Histogram calculated using DETX and DETY for each event in the final _common_clean file
| Quadrant A | 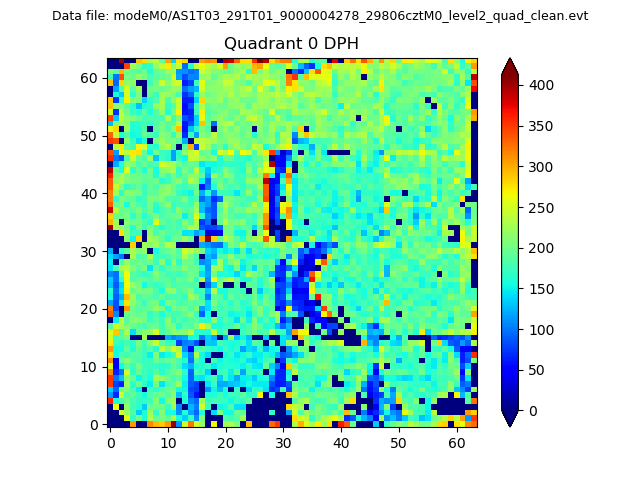 |
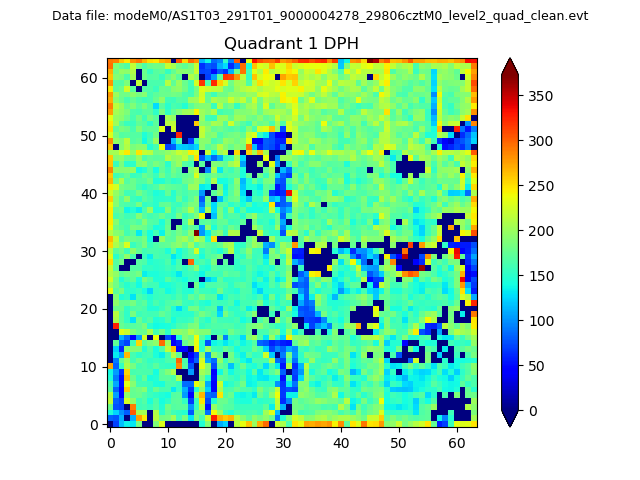 |
Quadrant B |
|---|---|---|---|
| Quadrant D | 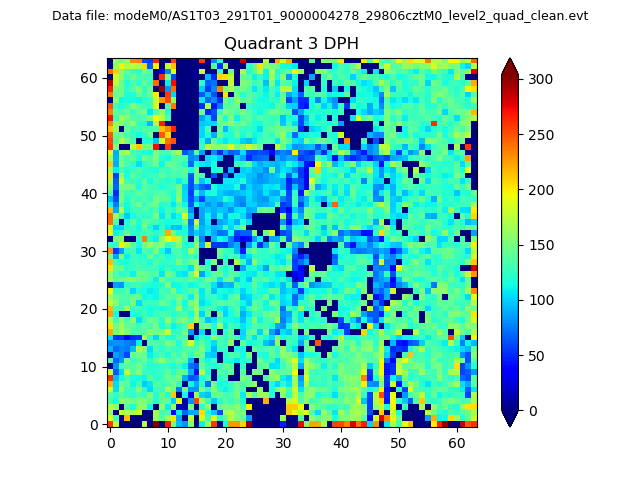 |
 |
Quadrant C |
| Plot type | Count rate plots | Images |
|---|---|---|
| Comparison with Poisson distribution Blue bars denote a histogram of data divided into 1 sec bins. Red curve is a Poisson curve with rate = median count rate of data. |
 |
 |
| Quadrant-wise count rates Data is divided into 100 sec bins |
 |
|
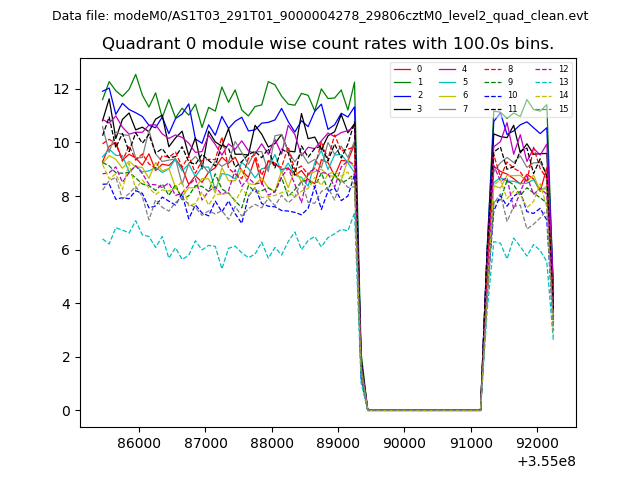
| Module-wise count rates for Quadrant A Data is divided into 100 sec bins |
 |
 |
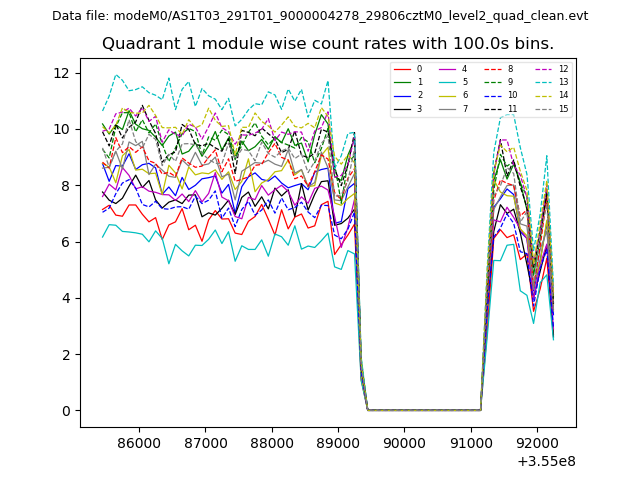
| Module-wise count rates for Quadrant B Data is divided into 100 sec bins |
 |
 |
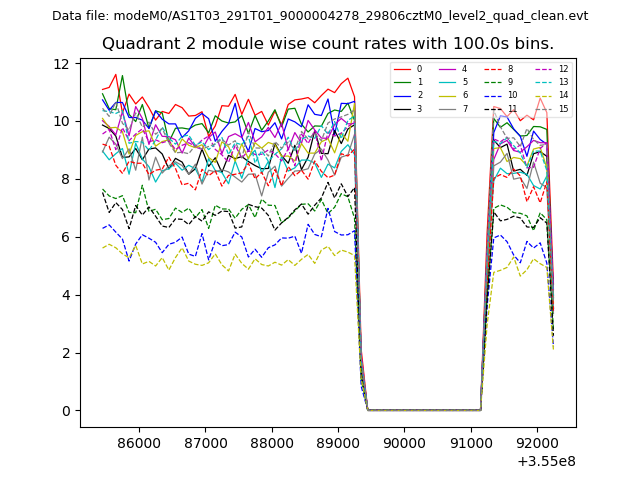
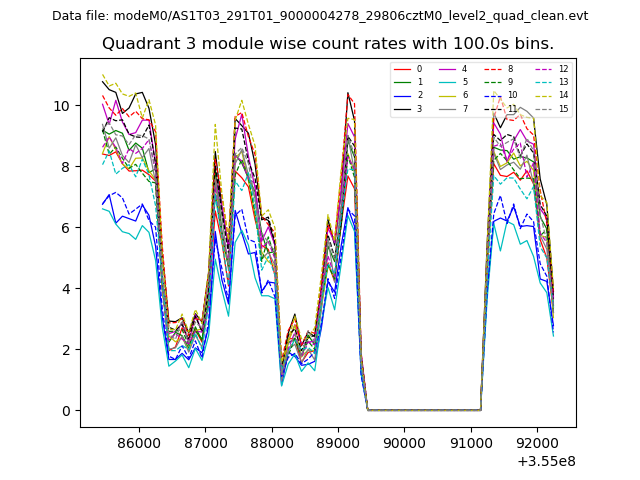
| Module-wise count rates for Quadrant C Data is divided into 100 sec bins |
 |
 |
| Module-wise count rates for Quadrant D Data is divided into 100 sec bins |
 |
 |
| Parameter | Plot |
|---|---|
| CZT HV Monitor | 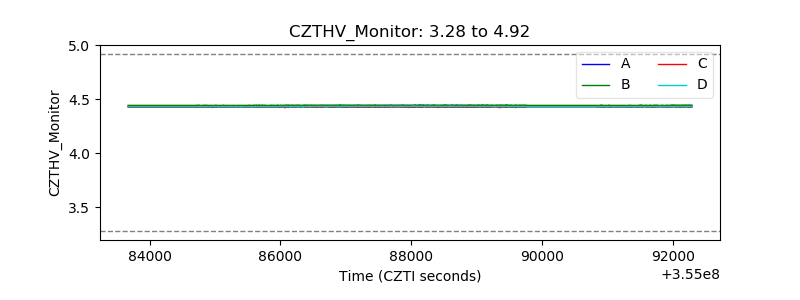 |
| D_VDD | 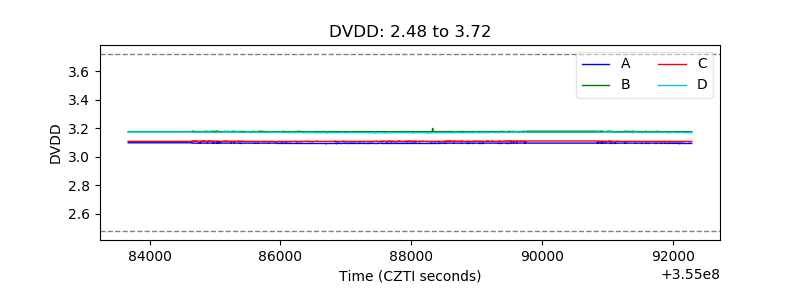 |
| Temperature 1 | 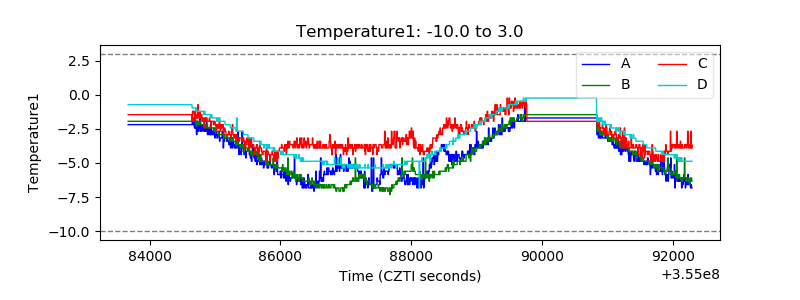 |
| Veto HV Monitor | 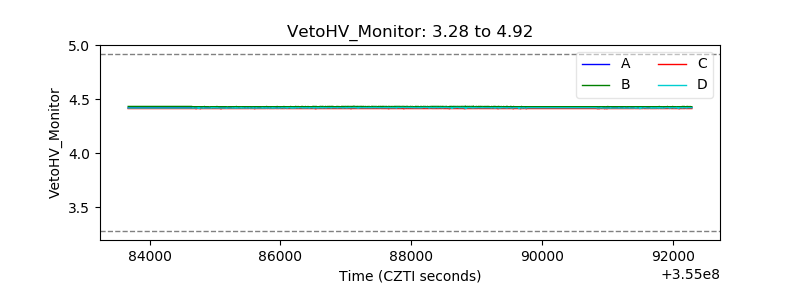 |
| Veto LLD | 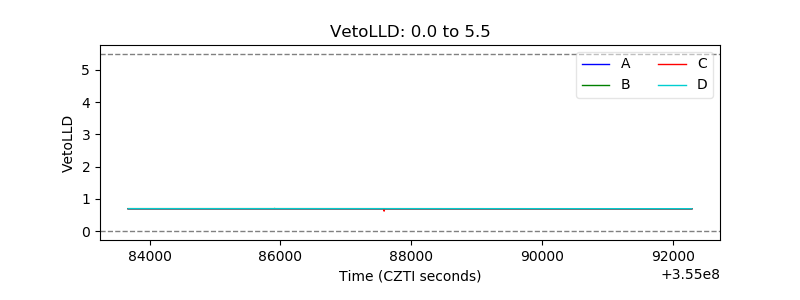 |
| Alpha Counter | 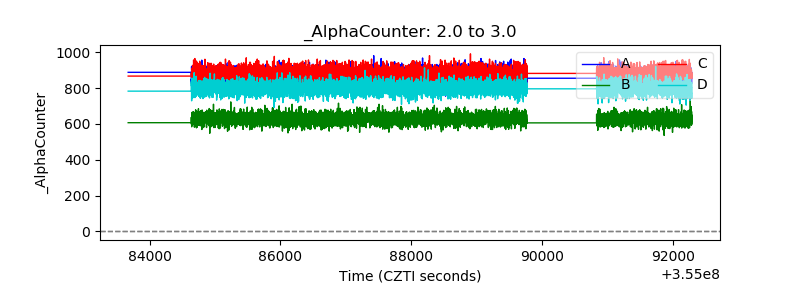 |
| _CPM_Rate |  |
| CZT Counter | 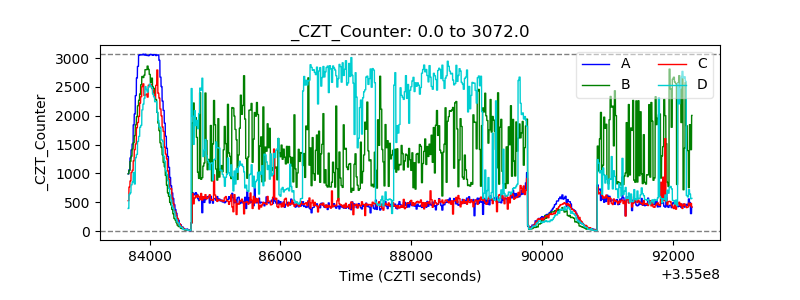 |
| +2.5 Volts monitor |  |
| +5 Volts monitor |  |
| _ROLL_ROT | 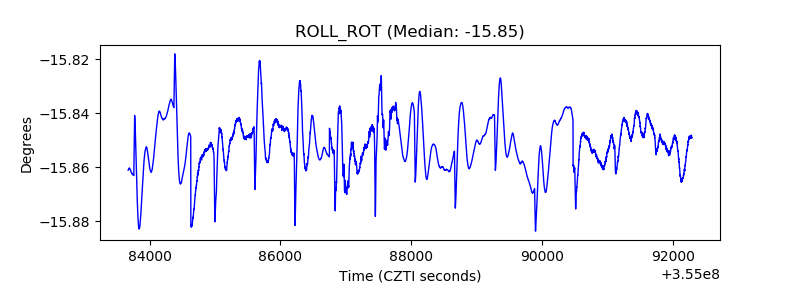 |
| _Roll_DEC | 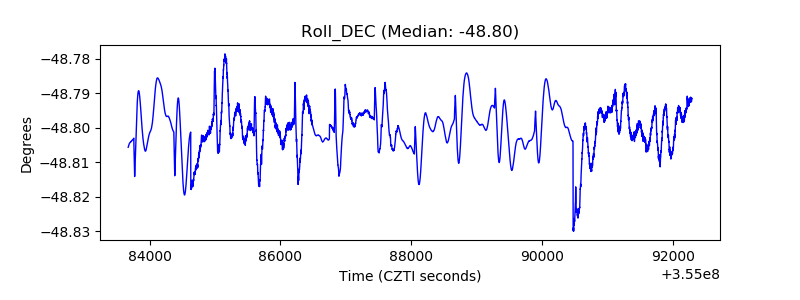 |
| _Roll_RA | 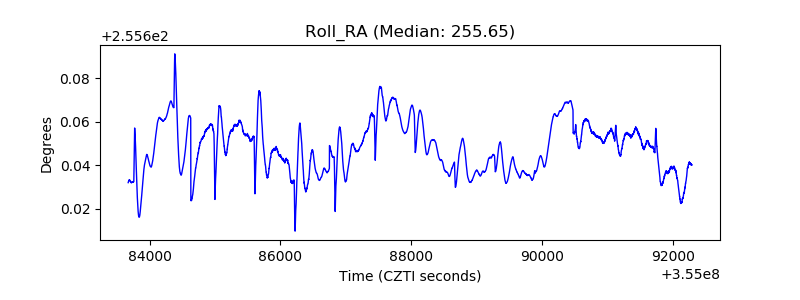 |
| Veto Counter | 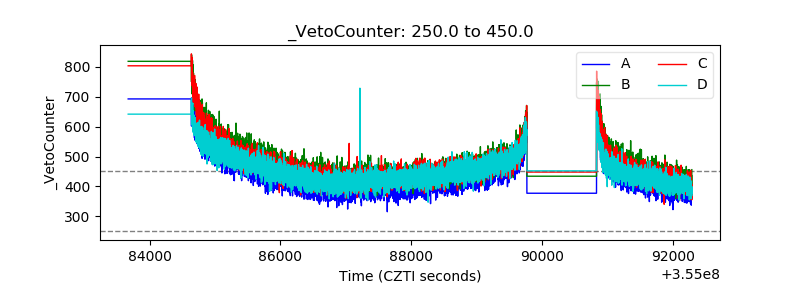 |