| Param | Original file | Final file |
|---|---|---|
| Filename | modeM0/AS1T03_291T01_9000004278_29807cztM0_level2.evt | modeM0/AS1T03_291T01_9000004278_29807cztM0_level2_quad_clean.evt |
| Size (bytes) | 834,828,480 | 101,283,840 |
| Size | 796.2 MB | 96.6 MB |
| Events in quadrant A | 3,274,011 | 725,190 |
| Events in quadrant B | 7,948,843 | 680,315 |
| Events in quadrant C | 3,390,558 | 685,675 |
| Events in quadrant D | 10,205,290 | 495,783 |
| Mode SS | |||
|---|---|---|---|
| Quadrant | BADHDUFLAG | Total packets | Discarded packets |
| A | 0 | 140 | 0 |
| B | 0 | 140 | 0 |
| C | 0 | 140 | 0 |
| D | 0 | 140 | 0 |
| Mode M0 | |||
|---|---|---|---|
| Quadrant | BADHDUFLAG | Total packets | Discarded packets |
| A | 0 | 14071 | 1 |
| B | 0 | 28194 | 1 |
| C | 0 | 14294 | 1 |
| D | 0 | 34818 | 1 |
| Mode M9 | |||
|---|---|---|---|
| Quadrant | BADHDUFLAG | Total packets | Discarded packets |
| A | 0 | 6 | 0 |
| B | 0 | 6 | 0 |
| C | 0 | 6 | 0 |
| D | 0 | 6 | 0 |
| Quadrant | Total seconds | Saturated seconds | Saturation percentage |
|---|---|---|---|
| A | 6875 | 22 | 0.320000% |
| B | 6876 | 982 | 14.281559% |
| C | 6876 | 76 | 1.105294% |
| D | 6876 | 2843 | 41.346713% |
Noise dominated data is calculated using 1-second bins in cleaned event files. If a bin has >2000 counts, and if more than 50% of those come from <1% of pixels, then it is considered to be noise-dominated and hence unusable.
| Quadrant | # 1 sec bins | Bins with >0 counts | Bins with >2000 counts | High rate bins dominated by noise | Noise dominated (total time) | Noise dominated (detector-on time) | Marked lightcurve |
|---|---|---|---|---|---|---|---|
| A | 7545 | 6876 | 0 | 0 | 0.00% | 0.00% | 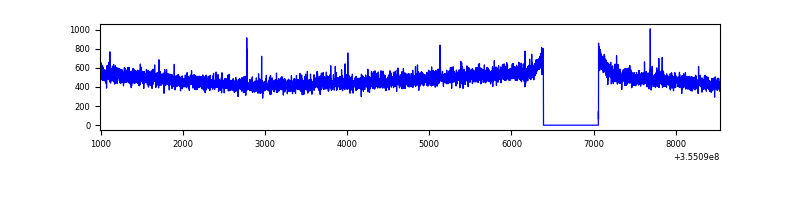 |
| B | 7546 | 6877 | 770 | 770 | 10.20% | 11.20% | 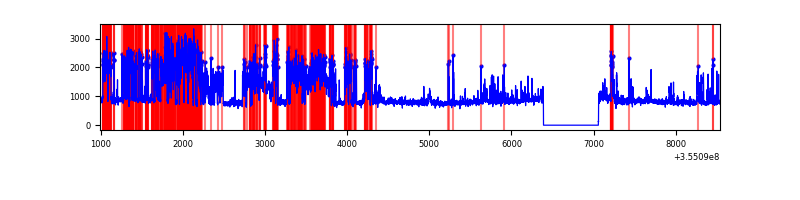 |
| C | 7546 | 6877 | 9 | 9 | 0.12% | 0.13% | 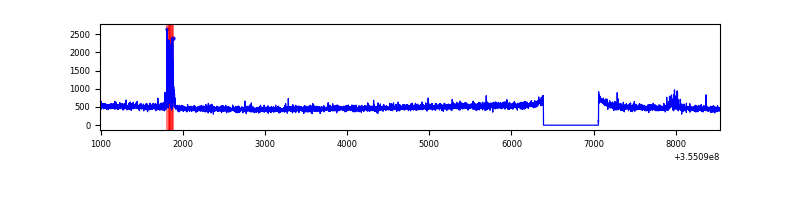 |
| D | 7546 | 6877 | 2727 | 2727 | 36.14% | 39.65% | 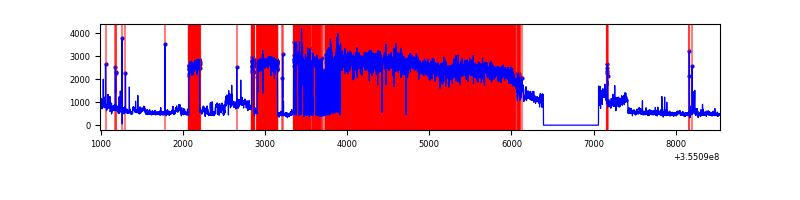 |
Top three noisy pixels from each quadrant. If the there are fewer than three noisy pixels in the level2.evt file, extra rows are filled as -1
| Pixel properties | Quadrant properties | ||||||
|---|---|---|---|---|---|---|---|
| Quadrant | DetID | PixID | Counts | Sigma | Mean | Median | Sigma |
| A | 13 | 254 | 14049 | 78.11 | 847 | 832 | 169.2 |
| A | 3 | 137 | 8329 | 44.3 | 847 | 832 | 169.2 |
| A | 0 | 226 | 7126 | 37.19 | 847 | 832 | 169.2 |
| B | 0 | 189 | 2607510 | 17071.17 | 811 | 793 | 152.7 |
| B | 6 | 159 | 1998744 | 13084.41 | 811 | 793 | 152.7 |
| B | 0 | 229 | 88063 | 571.52 | 811 | 793 | 152.7 |
| C | 14 | 238 | 140915 | 742.74 | 808 | 812 | 188.6 |
| C | 10 | 22 | 59217 | 309.63 | 808 | 812 | 188.6 |
| C | 14 | 254 | 17014 | 85.89 | 808 | 812 | 188.6 |
| D | 7 | 238 | 7112559 | 46416.28 | 638 | 621 | 153.2 |
| D | 8 | 195 | 473086 | 3083.56 | 638 | 621 | 153.2 |
| D | 2 | 250 | 57111 | 368.68 | 638 | 621 | 153.2 |
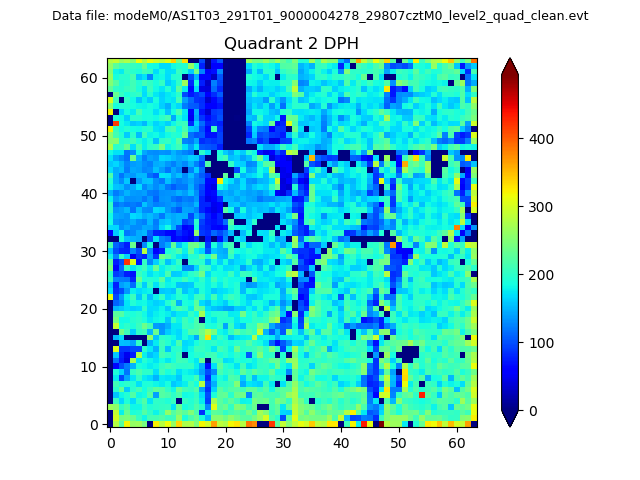
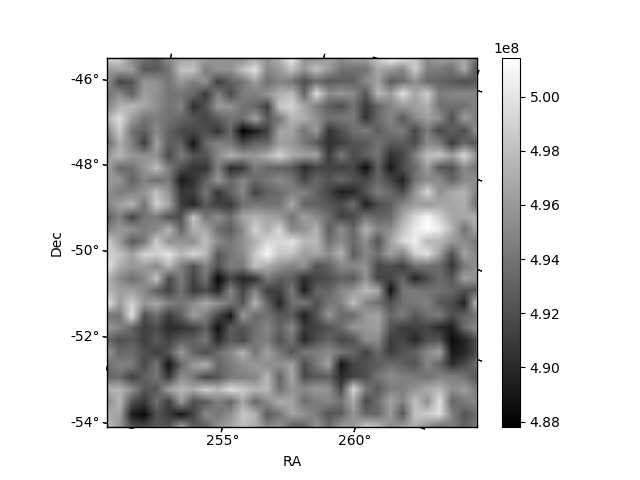
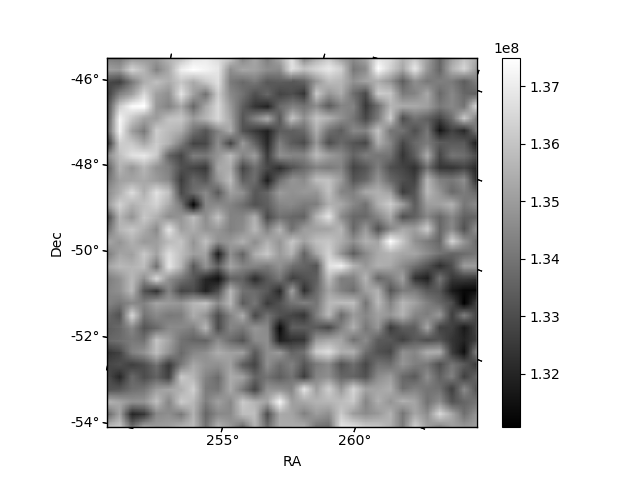
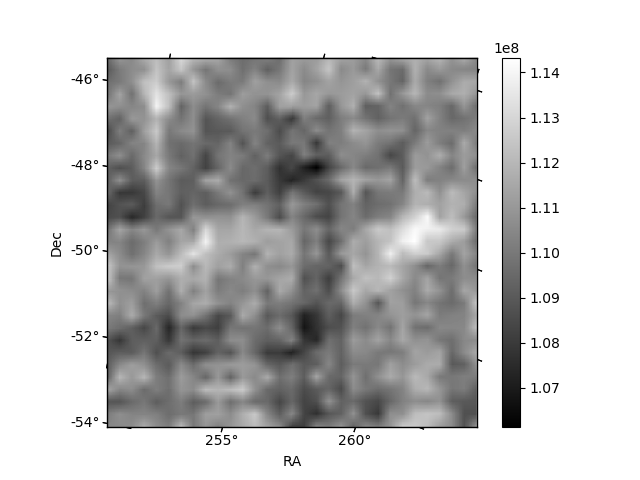
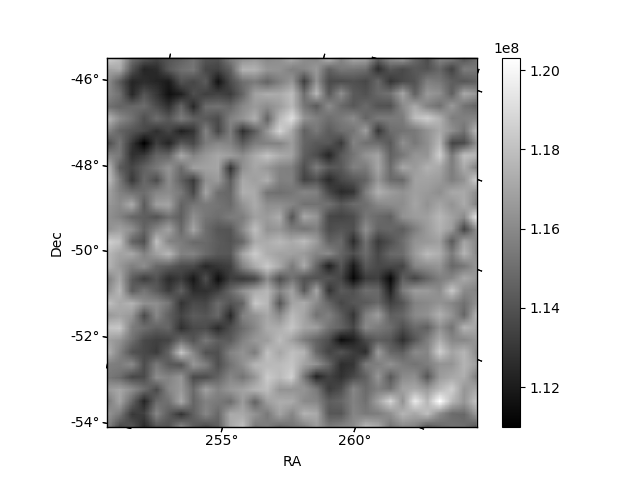
Histogram calculated using DETX and DETY for each event in the final _common_clean file
| Quadrant A | 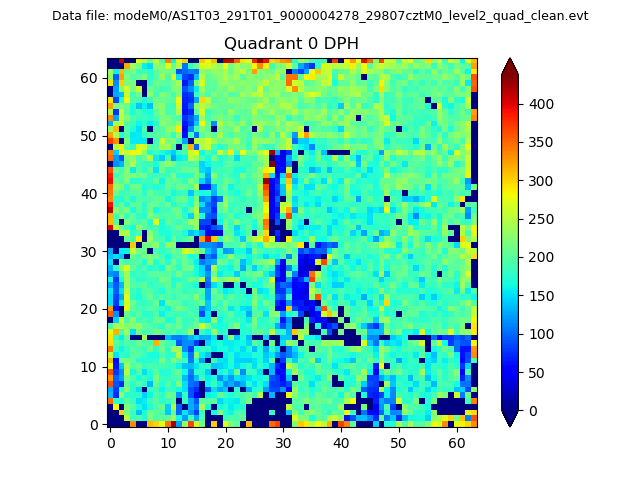 |
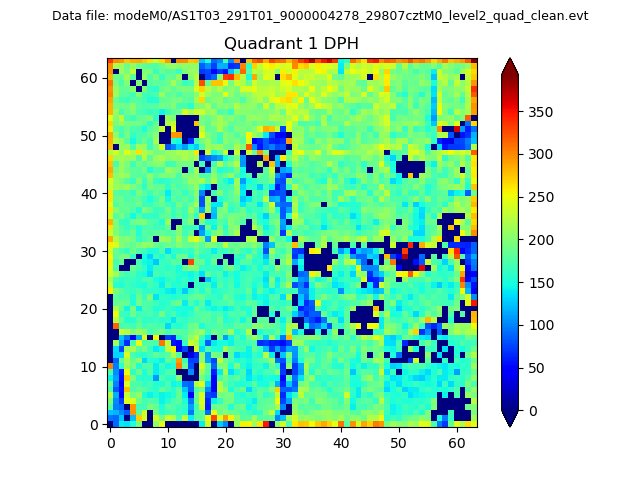 |
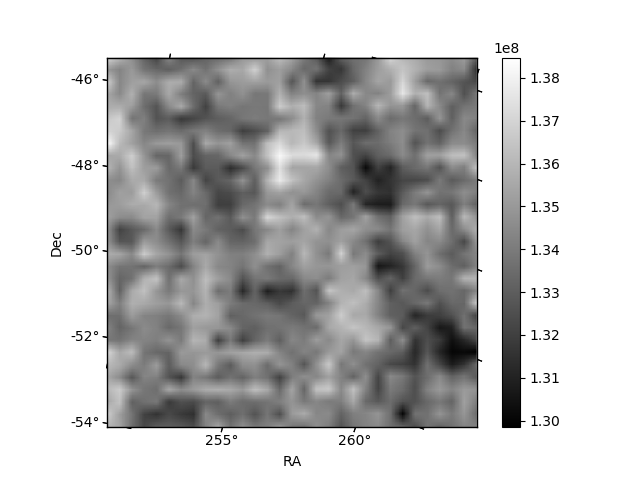
Quadrant B |
|---|---|---|---|
| Quadrant D | 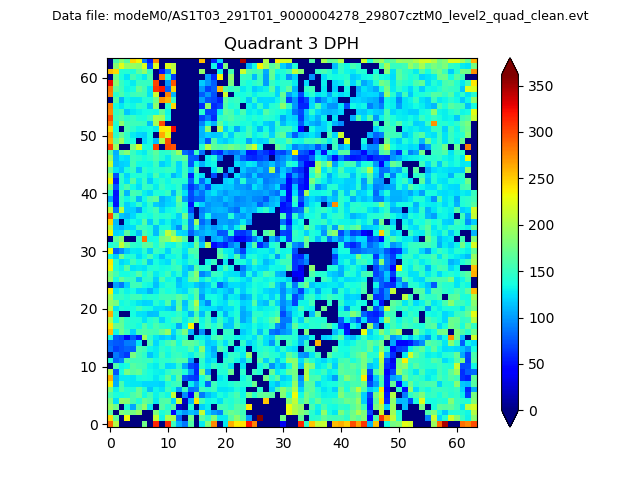 |
 |
Quadrant C |
| Plot type | Count rate plots | Images |
|---|---|---|
| Comparison with Poisson distribution Blue bars denote a histogram of data divided into 1 sec bins. Red curve is a Poisson curve with rate = median count rate of data. |
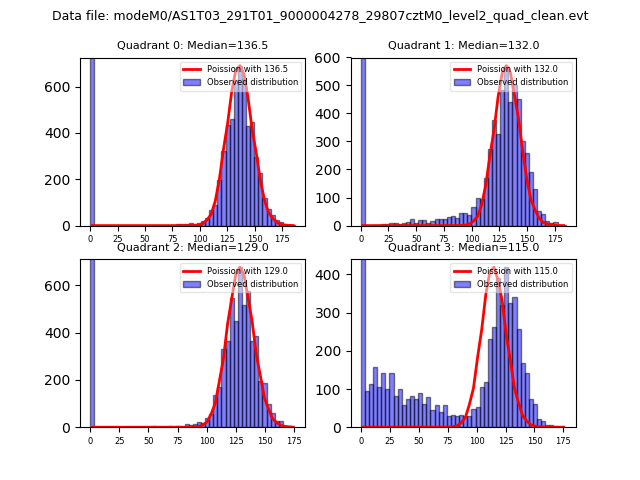 |
 |
| Quadrant-wise count rates Data is divided into 100 sec bins |
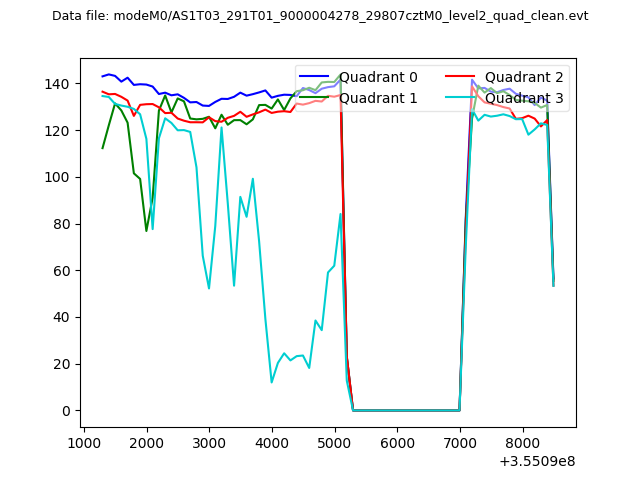 |
|
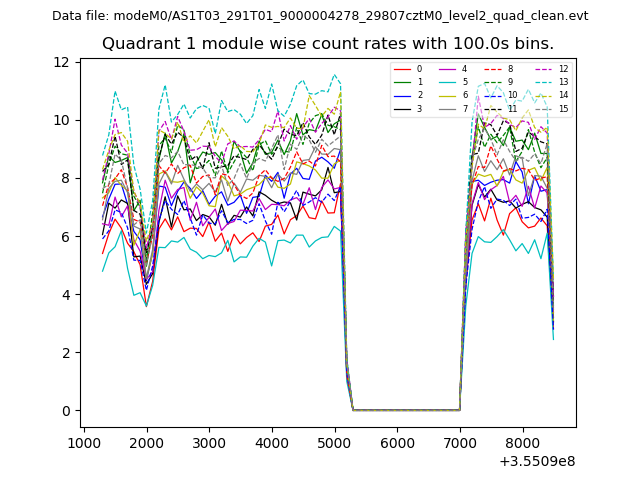
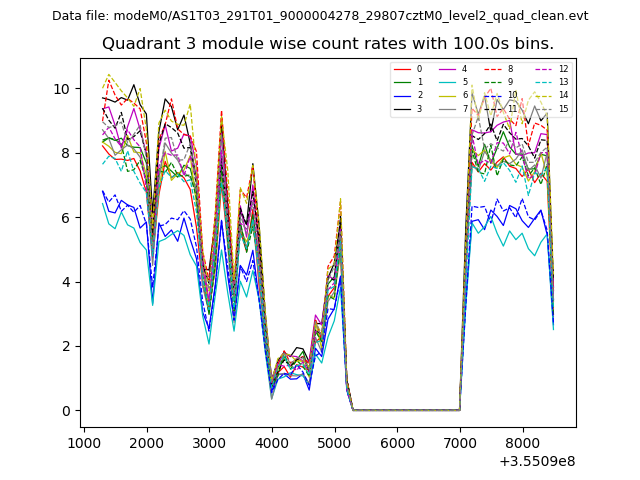
| Module-wise count rates for Quadrant A Data is divided into 100 sec bins |
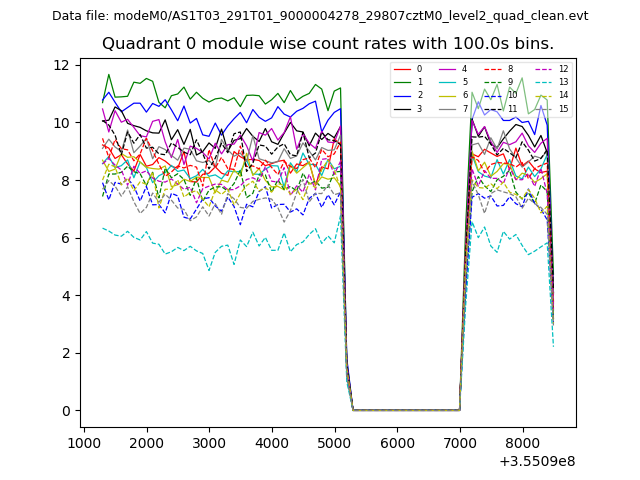 |
 |
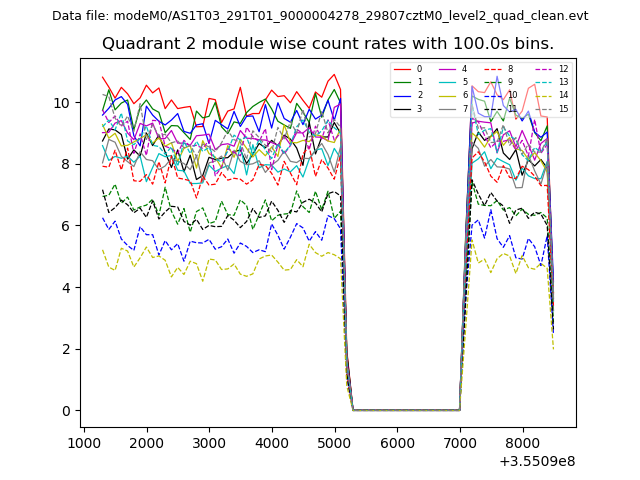
| Module-wise count rates for Quadrant B Data is divided into 100 sec bins |
 |
 |
| Module-wise count rates for Quadrant C Data is divided into 100 sec bins |
 |
 |
| Module-wise count rates for Quadrant D Data is divided into 100 sec bins |
 |
 |
| Parameter | Plot |
|---|---|
| CZT HV Monitor | 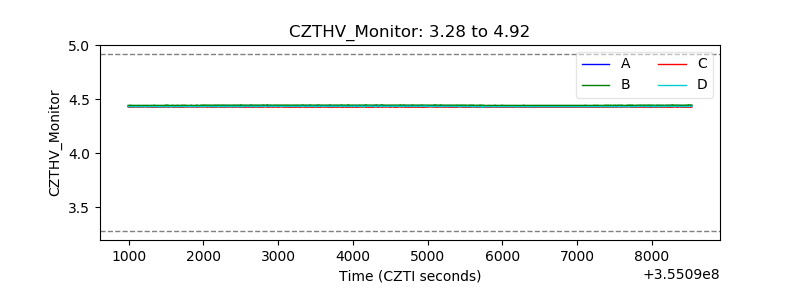 |
| D_VDD | 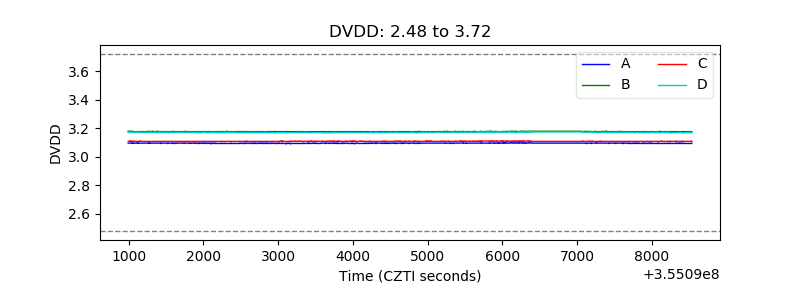 |
| Temperature 1 | 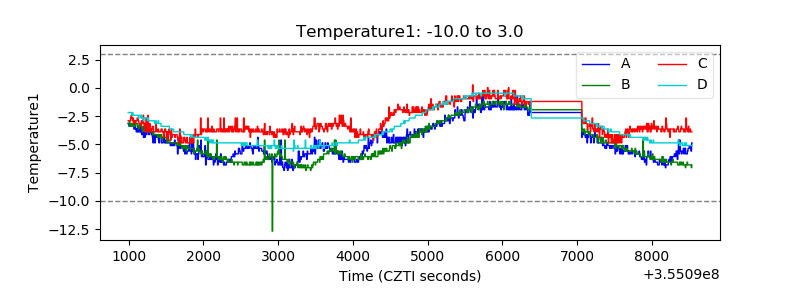 |
| Veto HV Monitor | 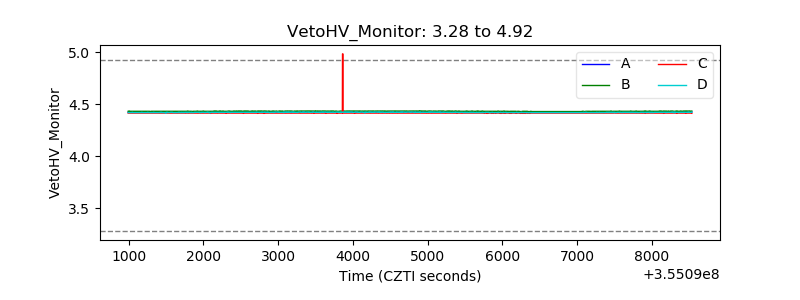 |
| Veto LLD | 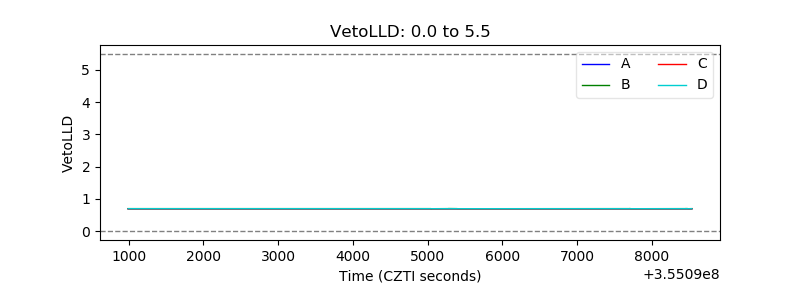 |
| Alpha Counter | 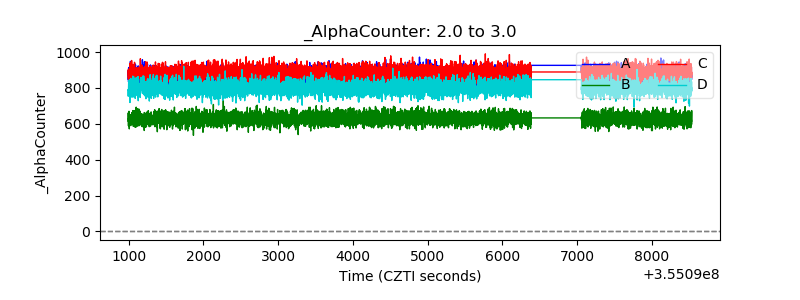 |
| _CPM_Rate | 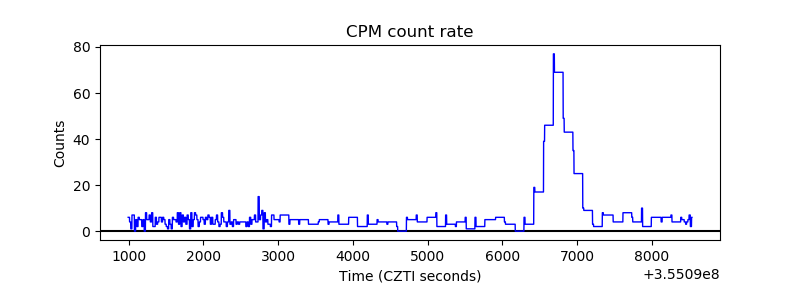 |
| CZT Counter | 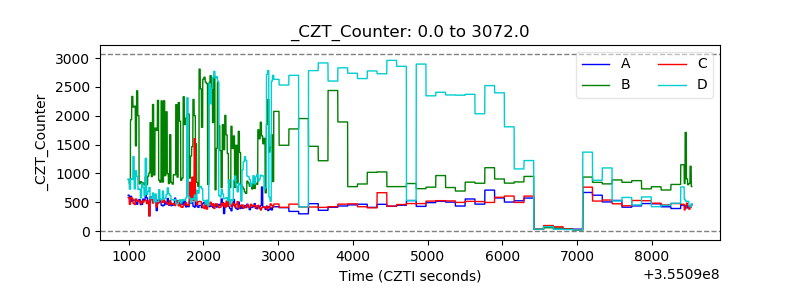 |
| +2.5 Volts monitor | 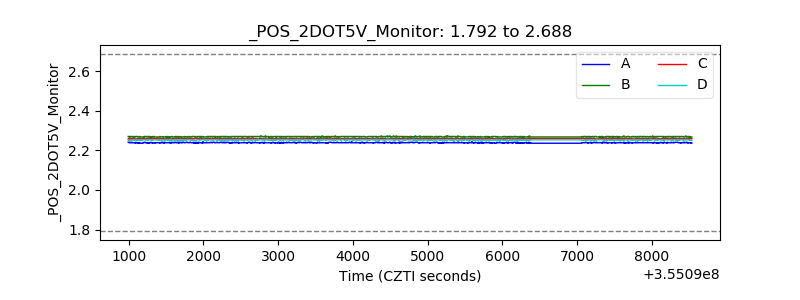 |
| +5 Volts monitor | 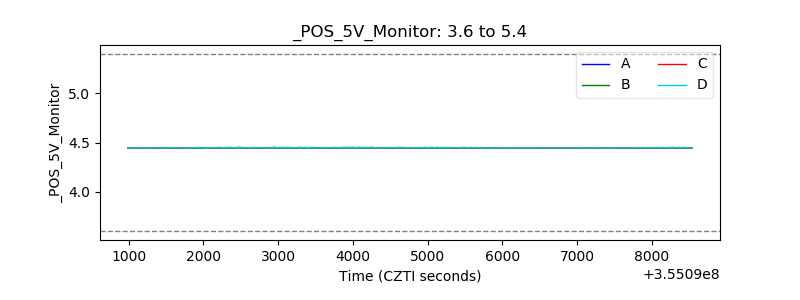 |
| _ROLL_ROT | 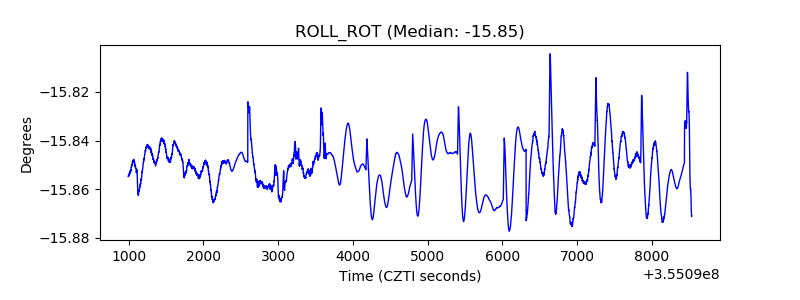 |
| _Roll_DEC | 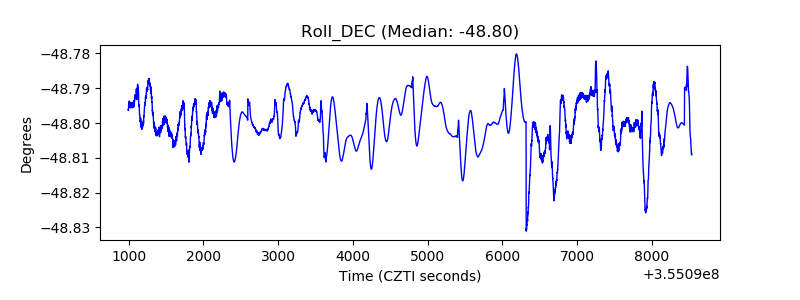 |
| _Roll_RA | 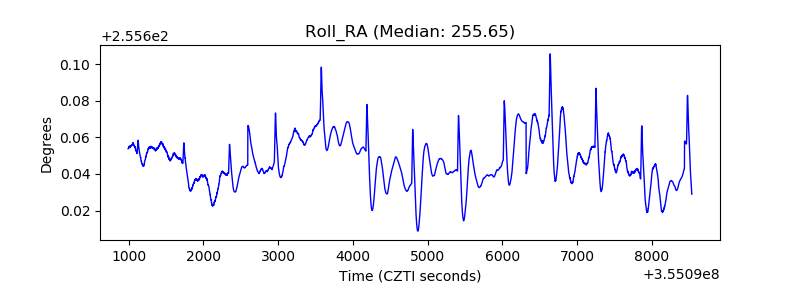 |
| Veto Counter | 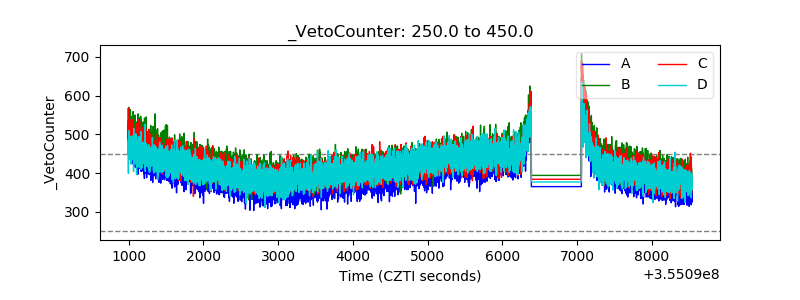 |