| Param | Original file | Final file |
|---|---|---|
| Filename | modeM0/AS1T03_291T01_9000004278_29808cztM0_level2.evt | modeM0/AS1T03_291T01_9000004278_29808cztM0_level2_quad_clean.evt |
| Size (bytes) | 771,180,480 | 111,234,240 |
| Size | 735.5 MB | 106.1 MB |
| Events in quadrant A | 3,676,842 | 758,879 |
| Events in quadrant B | 6,963,831 | 742,392 |
| Events in quadrant C | 3,784,288 | 717,497 |
| Events in quadrant D | 8,411,950 | 615,479 |
| Mode SS | |||
|---|---|---|---|
| Quadrant | BADHDUFLAG | Total packets | Discarded packets |
| A | 0 | 158 | 0 |
| B | 0 | 158 | 0 |
| C | 0 | 158 | 0 |
| D | 0 | 158 | 0 |
| Mode M0 | |||
|---|---|---|---|
| Quadrant | BADHDUFLAG | Total packets | Discarded packets |
| A | 0 | 15926 | 2 |
| B | 0 | 26114 | 2 |
| C | 0 | 16010 | 2 |
| D | 0 | 30056 | 2 |
| Mode M9 | |||
|---|---|---|---|
| Quadrant | BADHDUFLAG | Total packets | Discarded packets |
| A | 0 | 6 | 0 |
| B | 0 | 7 | 0 |
| C | 0 | 7 | 0 |
| D | 0 | 7 | 0 |
| Quadrant | Total seconds | Saturated seconds | Saturation percentage |
|---|---|---|---|
| A | 7674 | 61 | 0.794892% |
| B | 7673 | 588 | 7.663235% |
| C | 7673 | 170 | 2.215561% |
| D | 7673 | 1535 | 20.005213% |
Noise dominated data is calculated using 1-second bins in cleaned event files. If a bin has >2000 counts, and if more than 50% of those come from <1% of pixels, then it is considered to be noise-dominated and hence unusable.
| Quadrant | # 1 sec bins | Bins with >0 counts | Bins with >2000 counts | High rate bins dominated by noise | Noise dominated (total time) | Noise dominated (detector-on time) | Marked lightcurve |
|---|---|---|---|---|---|---|---|
| A | 7774 | 7675 | 0 | 0 | 0.00% | 0.00% | 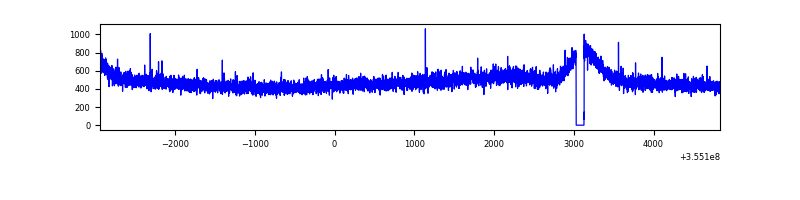 |
| B | 7773 | 7674 | 228 | 228 | 2.93% | 2.97% | 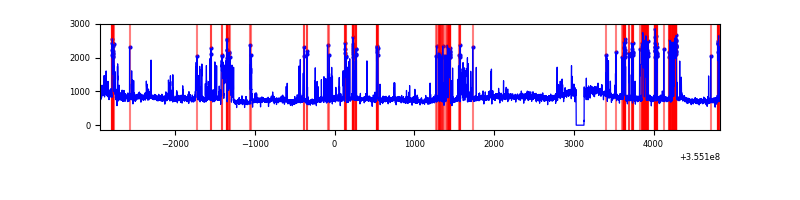 |
| C | 7773 | 7674 | 0 | 0 | 0.00% | 0.00% | 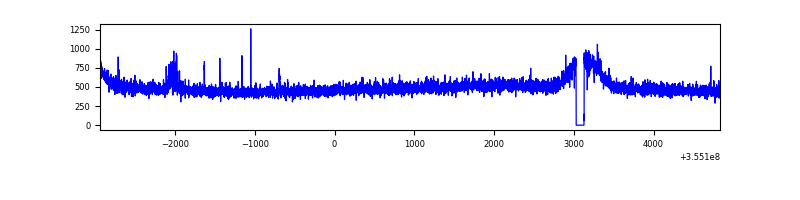 |
| D | 7773 | 7674 | 1430 | 1430 | 18.40% | 18.63% | 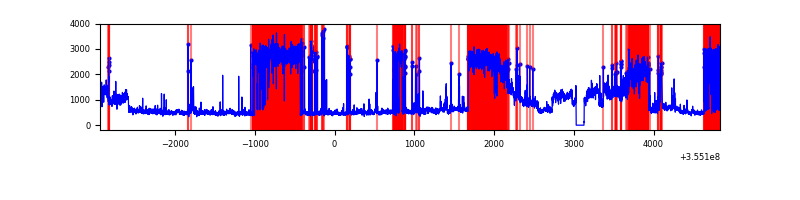 |
Top three noisy pixels from each quadrant. If the there are fewer than three noisy pixels in the level2.evt file, extra rows are filled as -1
| Pixel properties | Quadrant properties | ||||||
|---|---|---|---|---|---|---|---|
| Quadrant | DetID | PixID | Counts | Sigma | Mean | Median | Sigma |
| A | 13 | 254 | 14939 | 73.12 | 952 | 930 | 191.6 |
| A | 3 | 137 | 9654 | 45.53 | 952 | 930 | 191.6 |
| A | 0 | 226 | 7982 | 36.81 | 952 | 930 | 191.6 |
| B | 6 | 159 | 2233697 | 12461.26 | 936 | 912 | 179.2 |
| B | 0 | 189 | 810495 | 4518.31 | 936 | 912 | 179.2 |
| B | 0 | 229 | 141744 | 785.99 | 936 | 912 | 179.2 |
| C | 14 | 238 | 160358 | 746.46 | 912 | 914 | 213.6 |
| C | 14 | 254 | 23830 | 107.28 | 912 | 914 | 213.6 |
| C | 2 | 114 | 18778 | 83.63 | 912 | 914 | 213.6 |
| D | 7 | 238 | 4343283 | 21989.25 | 826 | 801 | 197.5 |
| D | 8 | 195 | 524695 | 2652.87 | 826 | 801 | 197.5 |
| D | 2 | 250 | 134265 | 675.83 | 826 | 801 | 197.5 |
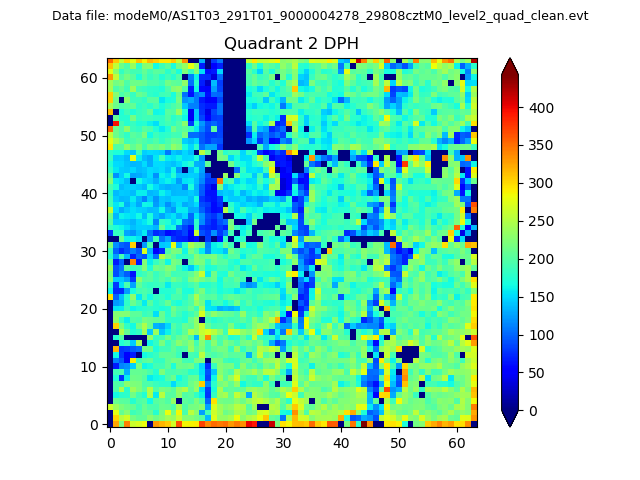
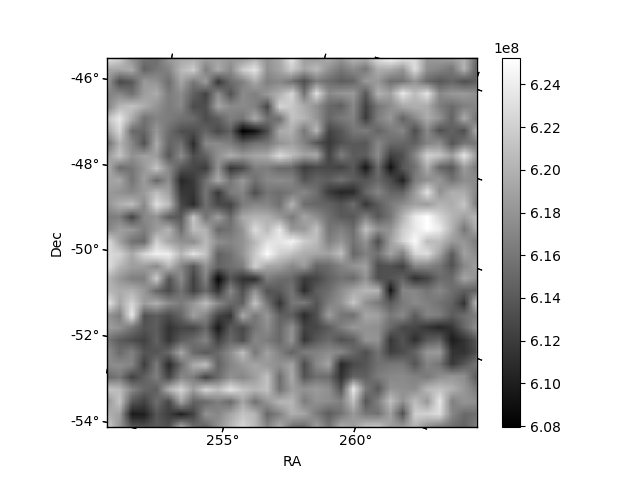
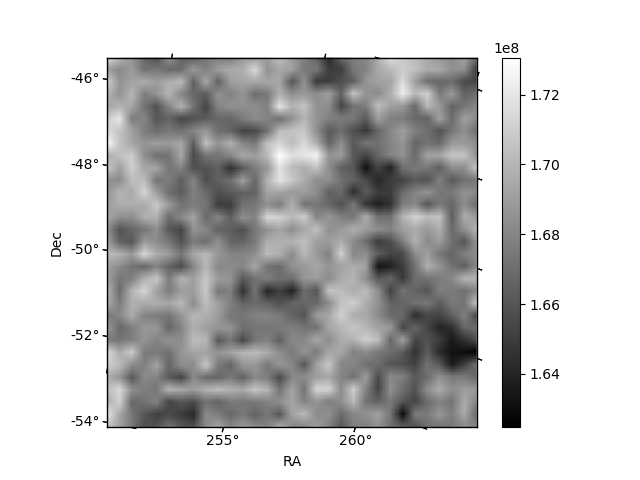
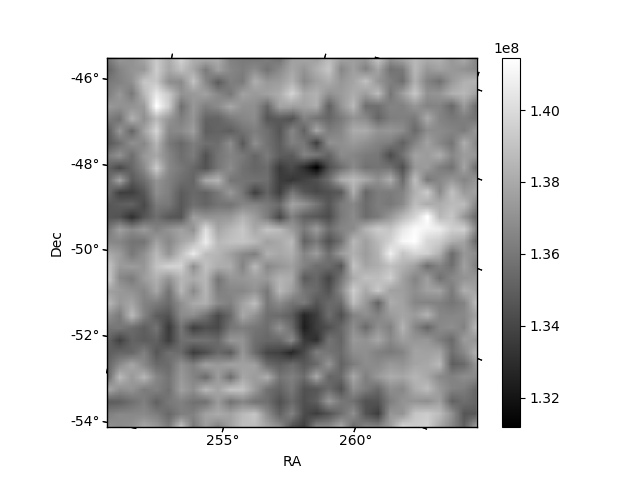
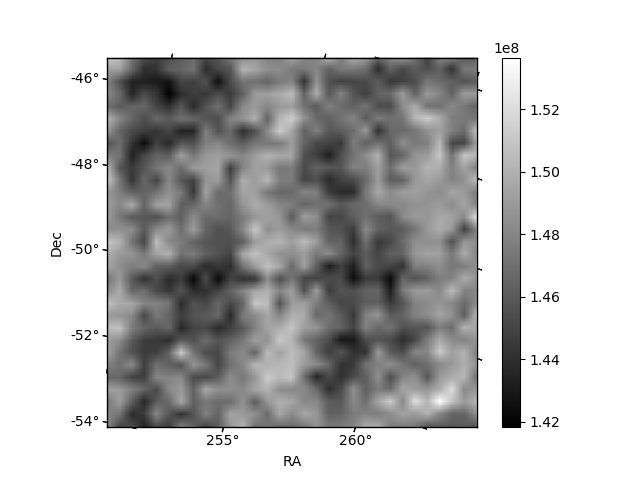
Histogram calculated using DETX and DETY for each event in the final _common_clean file
| Quadrant A | 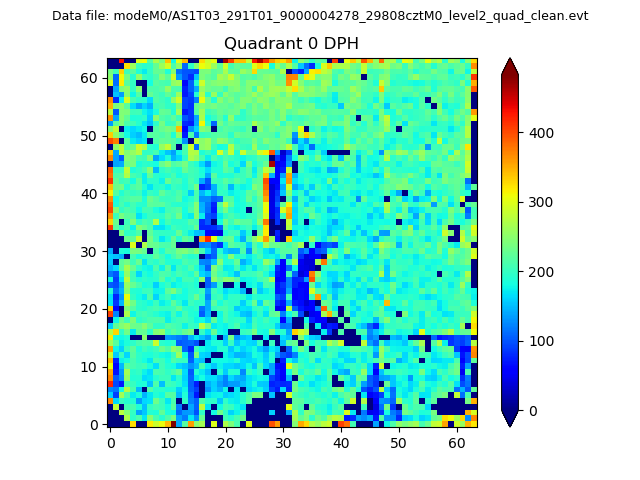 |
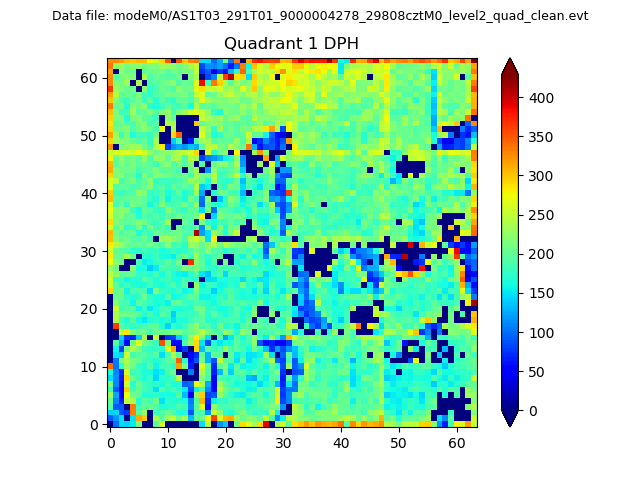 |
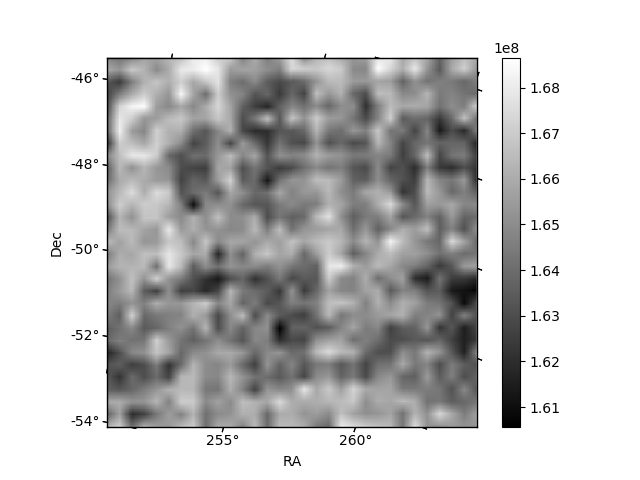
Quadrant B |
|---|---|---|---|
| Quadrant D | 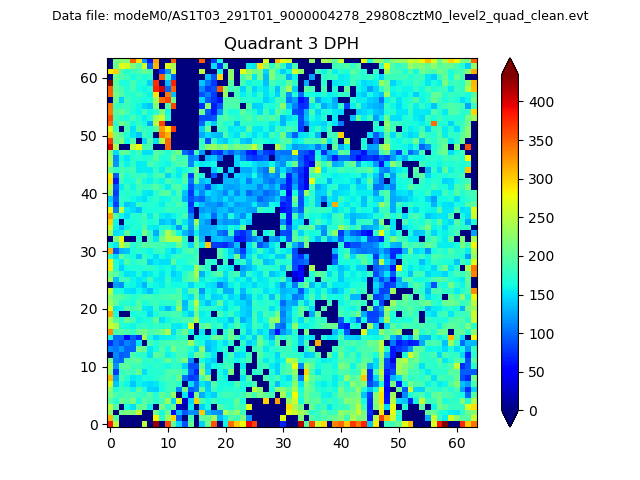 |
 |
Quadrant C |
| Plot type | Count rate plots | Images |
|---|---|---|
| Comparison with Poisson distribution Blue bars denote a histogram of data divided into 1 sec bins. Red curve is a Poisson curve with rate = median count rate of data. |
 |
 |
| Quadrant-wise count rates Data is divided into 100 sec bins |
 |
|
| Module-wise count rates for Quadrant A Data is divided into 100 sec bins |
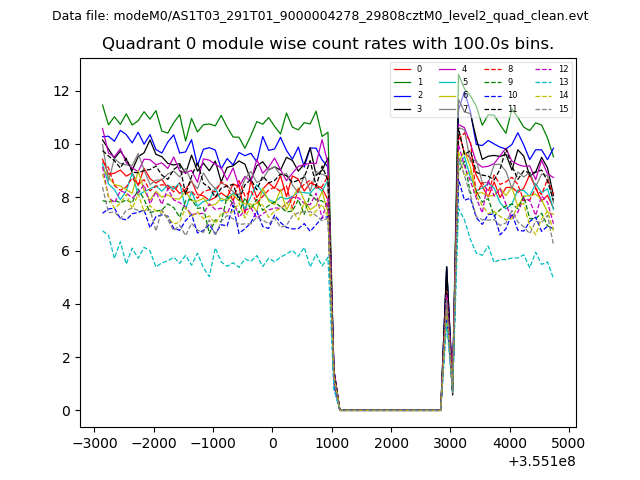 |
 |
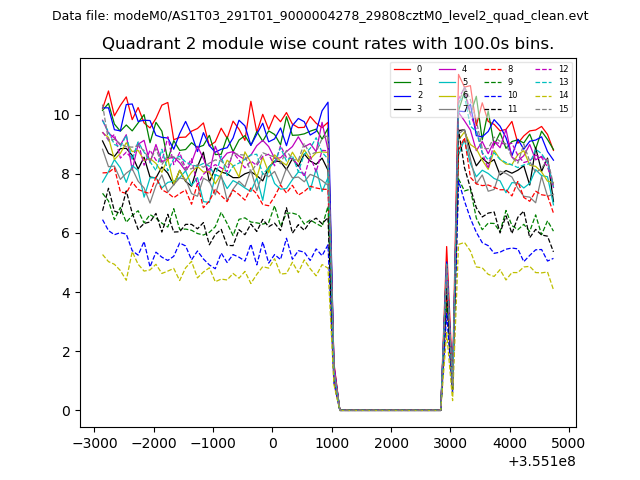
| Module-wise count rates for Quadrant B Data is divided into 100 sec bins |
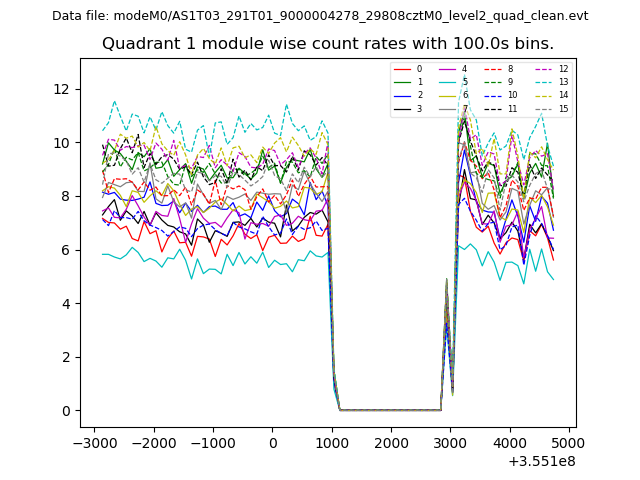 |
 |
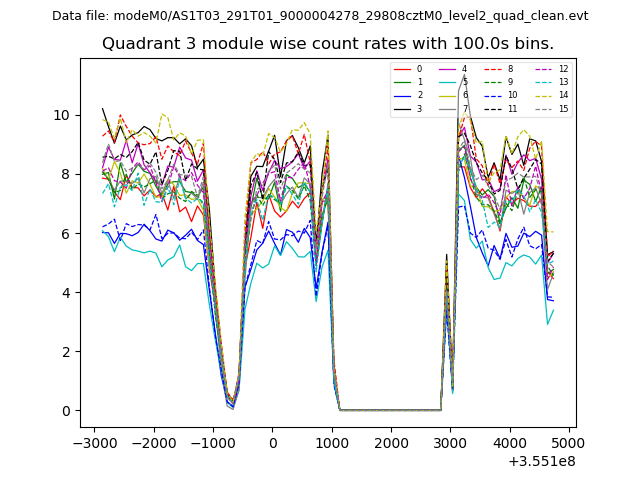
| Module-wise count rates for Quadrant C Data is divided into 100 sec bins |
 |
 |
| Module-wise count rates for Quadrant D Data is divided into 100 sec bins |
 |
 |
| Parameter | Plot |
|---|---|
| CZT HV Monitor | 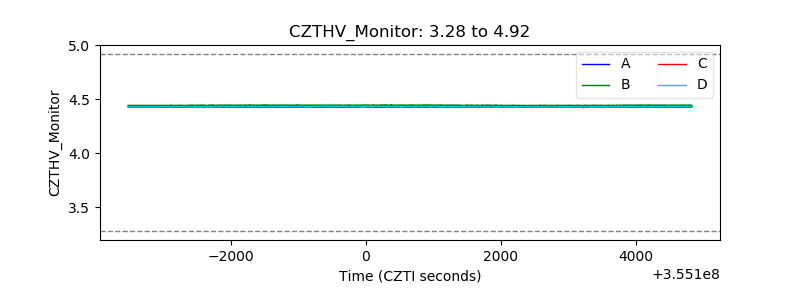 |
| D_VDD | 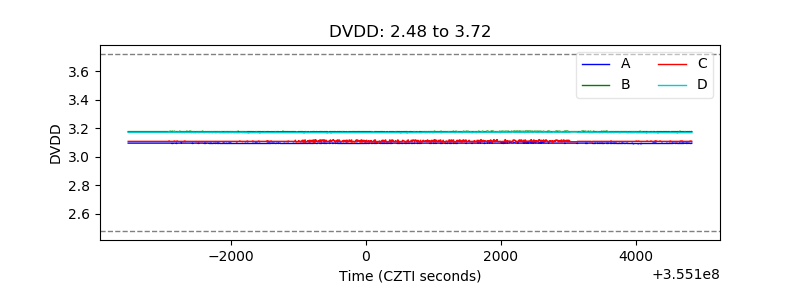 |
| Temperature 1 | 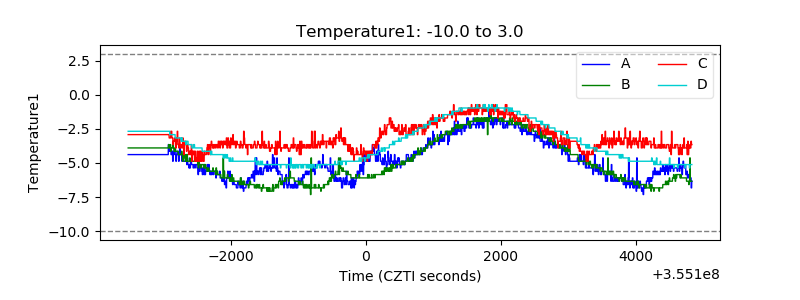 |
| Veto HV Monitor | 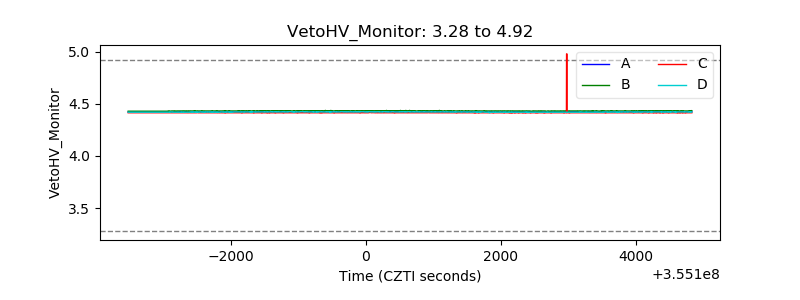 |
| Veto LLD | 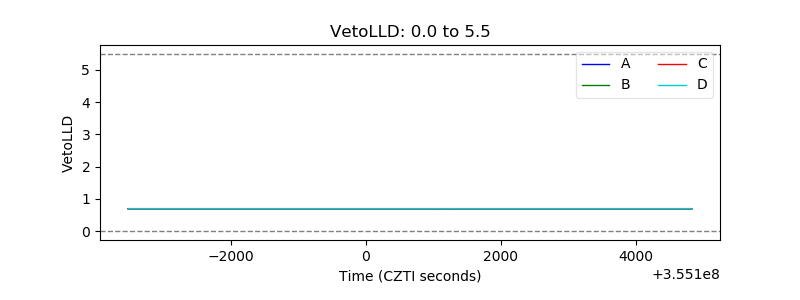 |
| Alpha Counter | 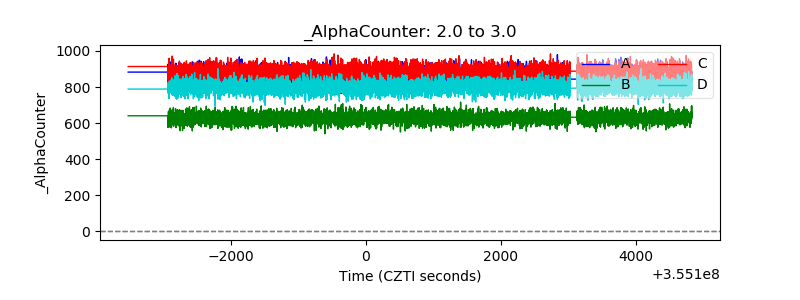 |
| _CPM_Rate |  |
| CZT Counter | 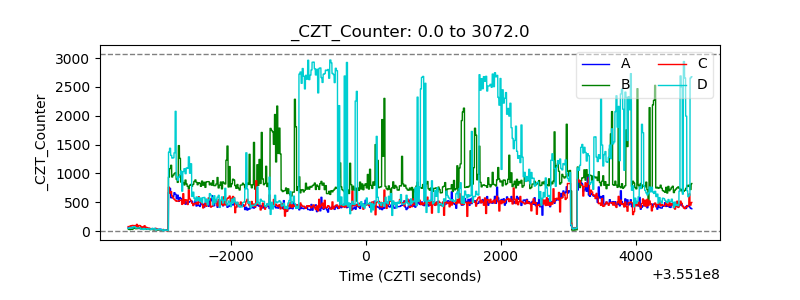 |
| +2.5 Volts monitor |  |
| +5 Volts monitor |  |
| _ROLL_ROT | 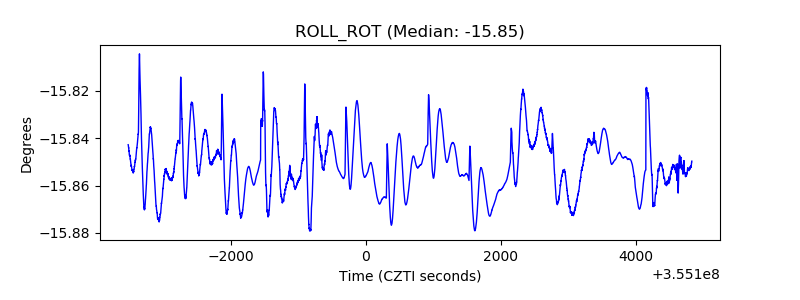 |
| _Roll_DEC | 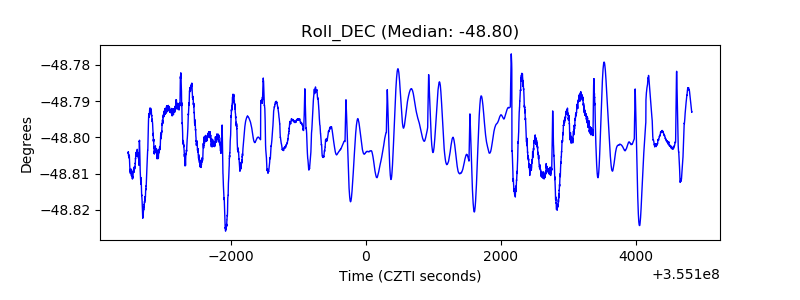 |
| _Roll_RA | 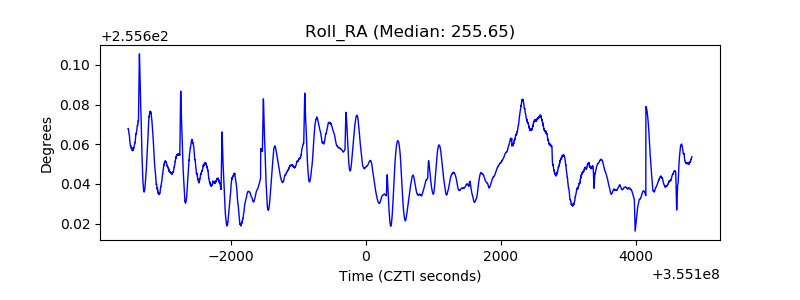 |
| Veto Counter | 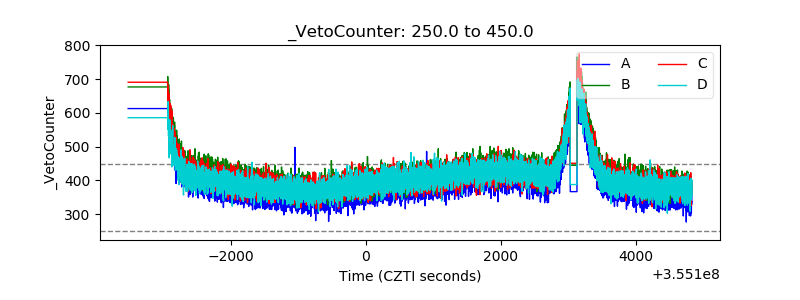 |