| Param | Original file | Final file |
|---|---|---|
| Filename | modeM0/AS1T03_291T01_9000004278_29814cztM0_level2.evt | modeM0/AS1T03_291T01_9000004278_29814cztM0_level2_quad_clean.evt |
| Size (bytes) | 2,454,773,760 | 256,688,640 |
| Size | 2.3 GB | 244.8 MB |
| Events in quadrant A | 9,540,899 | 1,828,987 |
| Events in quadrant B | 20,084,061 | 1,779,094 |
| Events in quadrant C | 10,150,169 | 1,736,420 |
| Events in quadrant D | 33,219,303 | 1,042,369 |
| Mode SS | |||
|---|---|---|---|
| Quadrant | BADHDUFLAG | Total packets | Discarded packets |
| A | 0 | 408 | 0 |
| B | 0 | 408 | 0 |
| C | 0 | 408 | 0 |
| D | 0 | 408 | 0 |
| Mode M0 | |||
|---|---|---|---|
| Quadrant | BADHDUFLAG | Total packets | Discarded packets |
| A | 0 | 41358 | 4 |
| B | 0 | 73849 | 4 |
| C | 0 | 42707 | 4 |
| D | 0 | 112137 | 4 |
| Mode M9 | |||
|---|---|---|---|
| Quadrant | BADHDUFLAG | Total packets | Discarded packets |
| A | 0 | 10 | 0 |
| B | 0 | 10 | 0 |
| C | 0 | 10 | 0 |
| D | 0 | 10 | 0 |
| Quadrant | Total seconds | Saturated seconds | Saturation percentage |
|---|---|---|---|
| A | 20082 | 173 | 0.861468% |
| B | 20083 | 2435 | 12.124683% |
| C | 20083 | 607 | 3.022457% |
| D | 20083 | 9040 | 45.013195% |
Noise dominated data is calculated using 1-second bins in cleaned event files. If a bin has >2000 counts, and if more than 50% of those come from <1% of pixels, then it is considered to be noise-dominated and hence unusable.
| Quadrant | # 1 sec bins | Bins with >0 counts | Bins with >2000 counts | High rate bins dominated by noise | Noise dominated (total time) | Noise dominated (detector-on time) | Marked lightcurve |
|---|---|---|---|---|---|---|---|
| A | 21117 | 20086 | 0 | 0 | 0.00% | 0.00% | 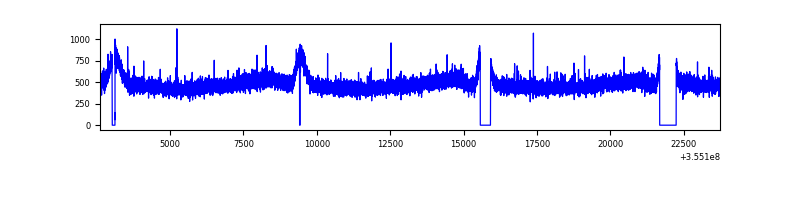 |
| B | 21118 | 20087 | 1218 | 1218 | 5.77% | 6.06% | 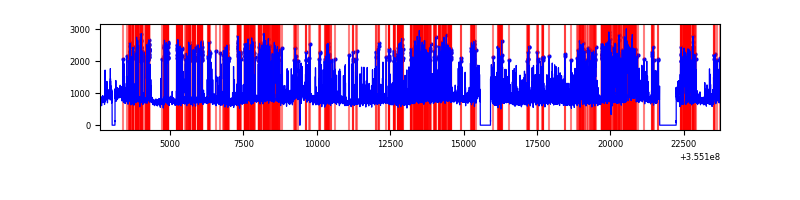 |
| C | 21118 | 20087 | 69 | 69 | 0.33% | 0.34% | 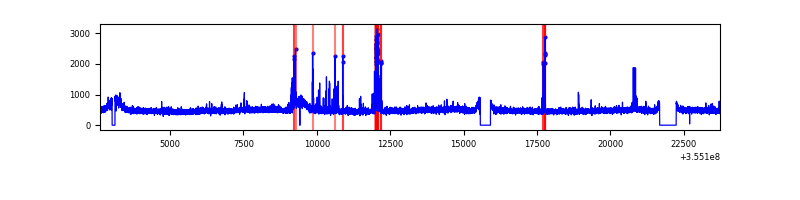 |
| D | 21118 | 20087 | 8726 | 8726 | 41.32% | 43.44% | 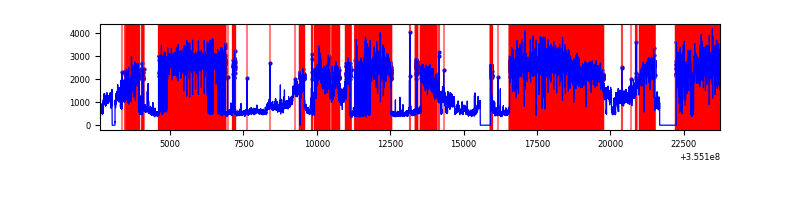 |
Top three noisy pixels from each quadrant. If the there are fewer than three noisy pixels in the level2.evt file, extra rows are filled as -1
| Pixel properties | Quadrant properties | ||||||
|---|---|---|---|---|---|---|---|
| Quadrant | DetID | PixID | Counts | Sigma | Mean | Median | Sigma |
| A | 13 | 254 | 38950 | 73.44 | 2471 | 2415 | 497.4 |
| A | 3 | 137 | 25168 | 45.74 | 2471 | 2415 | 497.4 |
| A | 0 | 226 | 20471 | 36.3 | 2471 | 2415 | 497.4 |
| B | 6 | 159 | 5632919 | 12403.78 | 2384 | 2321 | 453.9 |
| B | 0 | 189 | 4631035 | 10196.71 | 2384 | 2321 | 453.9 |
| B | 0 | 229 | 170960 | 371.5 | 2384 | 2321 | 453.9 |
| C | 14 | 238 | 386356 | 693.9 | 2371 | 2380 | 553.4 |
| C | 10 | 22 | 350835 | 629.71 | 2371 | 2380 | 553.4 |
| C | 2 | 16 | 97599 | 172.07 | 2371 | 2380 | 553.4 |
| D | 7 | 238 | 24497460 | 56794.95 | 1809 | 1759 | 431.3 |
| D | 8 | 195 | 1181219 | 2734.66 | 1809 | 1759 | 431.3 |
| D | 7 | 80 | 324143 | 747.47 | 1809 | 1759 | 431.3 |
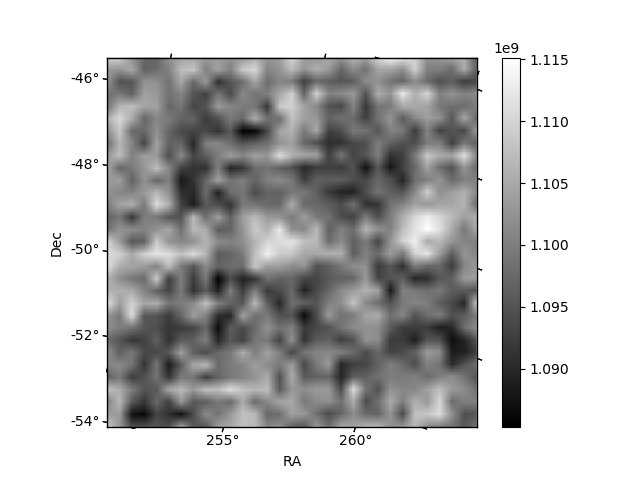
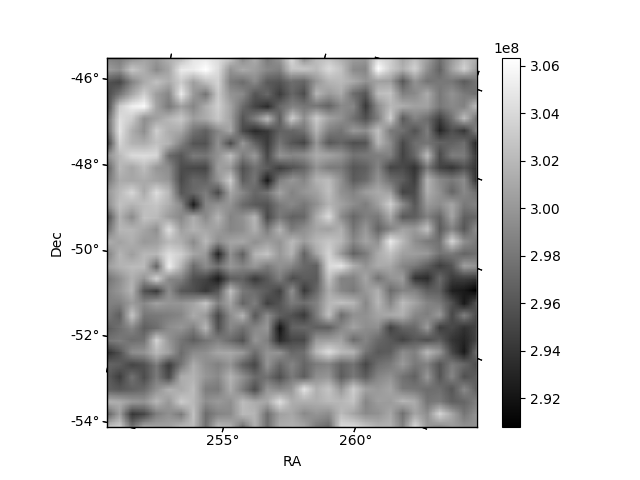
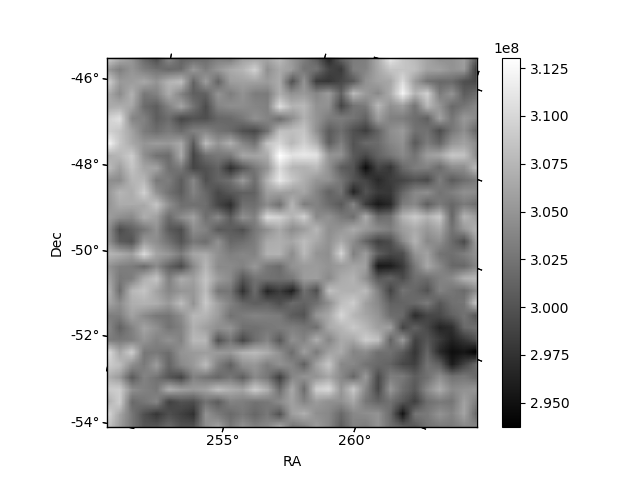
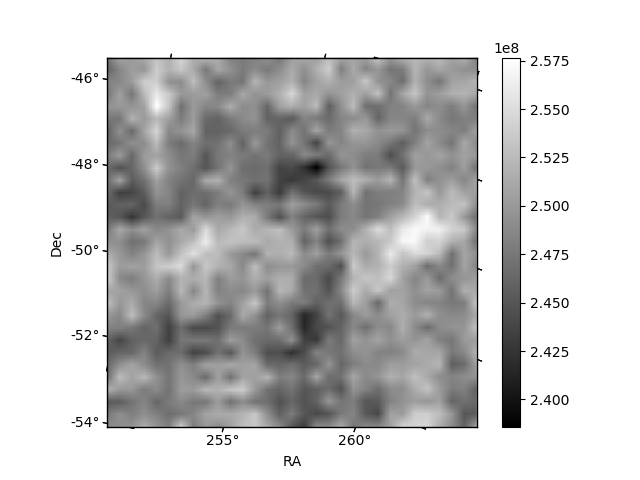
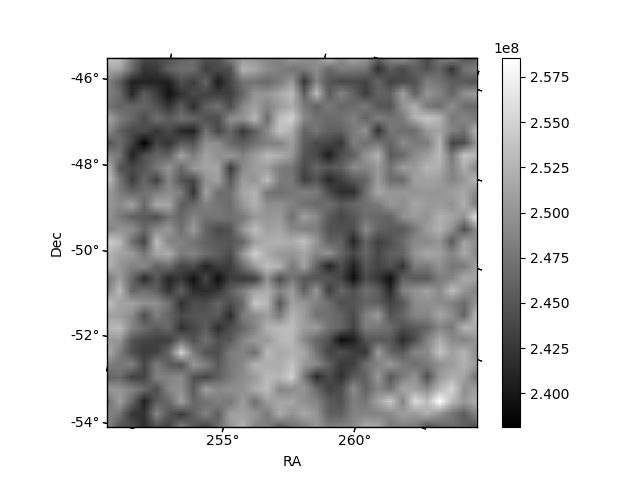
Histogram calculated using DETX and DETY for each event in the final _common_clean file
| Quadrant A | 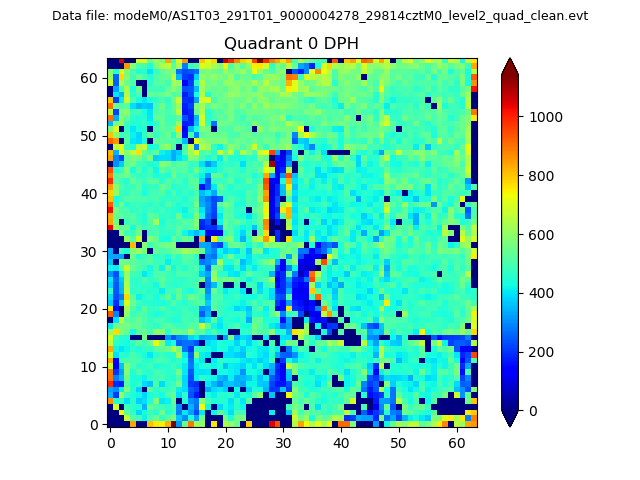 |
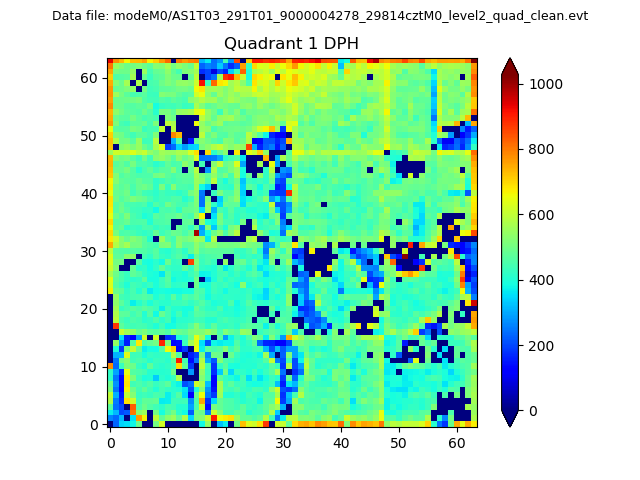 |
Quadrant B |
|---|---|---|---|
| Quadrant D | 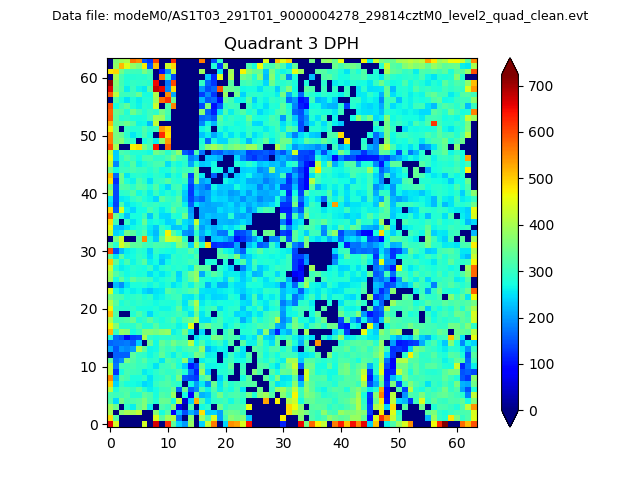 |
 |
Quadrant C |
| Plot type | Count rate plots | Images |
|---|---|---|
| Comparison with Poisson distribution Blue bars denote a histogram of data divided into 1 sec bins. Red curve is a Poisson curve with rate = median count rate of data. |
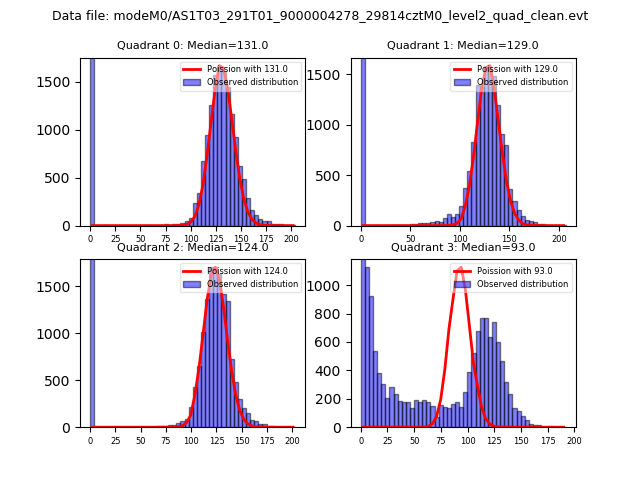 |
 |
| Quadrant-wise count rates Data is divided into 100 sec bins |
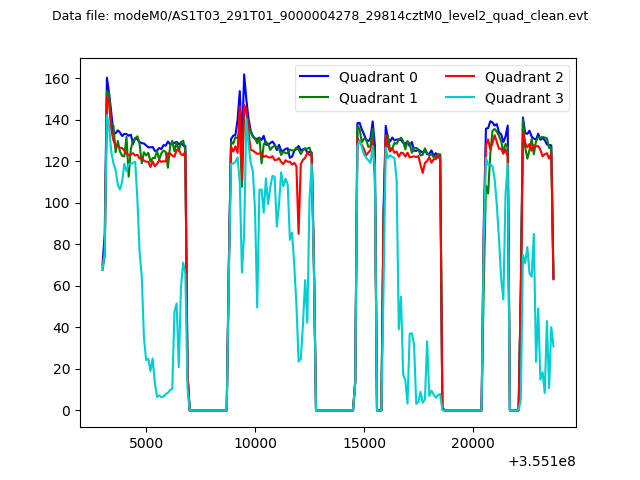 |
|
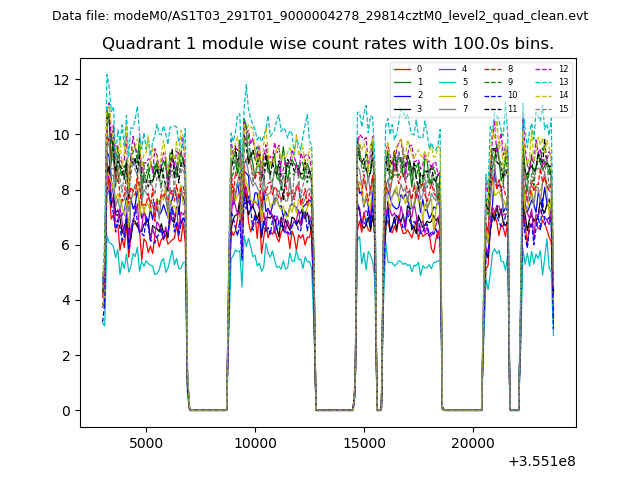
| Module-wise count rates for Quadrant A Data is divided into 100 sec bins |
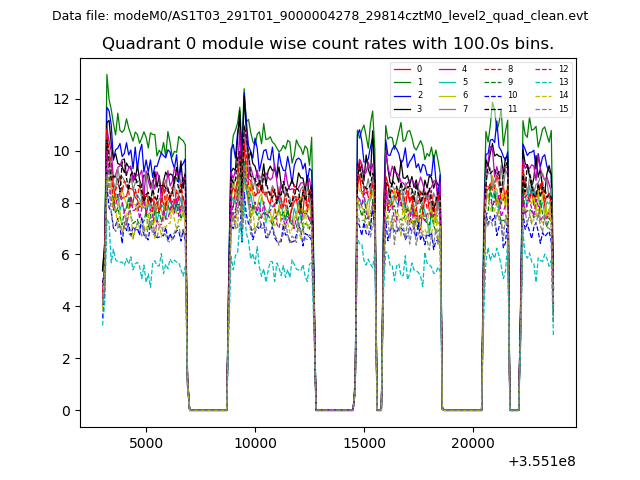 |
 |
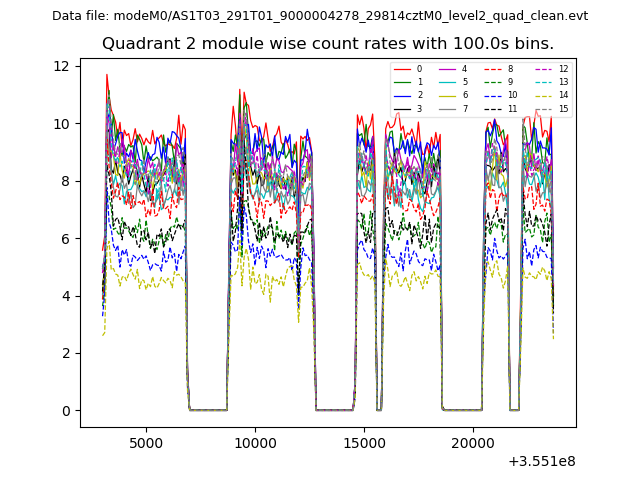
| Module-wise count rates for Quadrant B Data is divided into 100 sec bins |
 |
 |
| Module-wise count rates for Quadrant C Data is divided into 100 sec bins |
 |
 |
| Module-wise count rates for Quadrant D Data is divided into 100 sec bins |
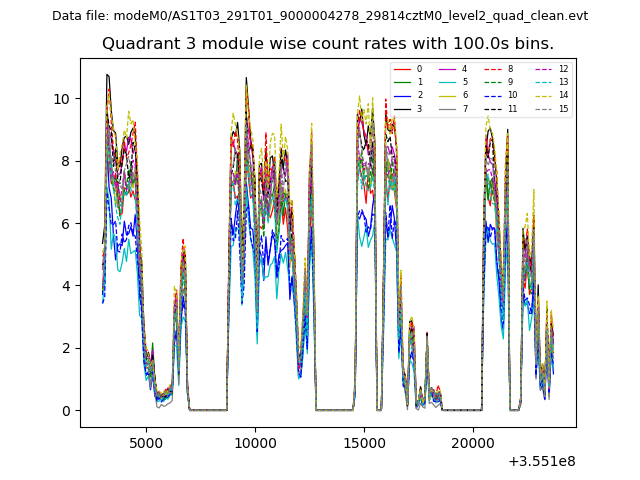 |
 |
| Parameter | Plot |
|---|---|
| CZT HV Monitor | 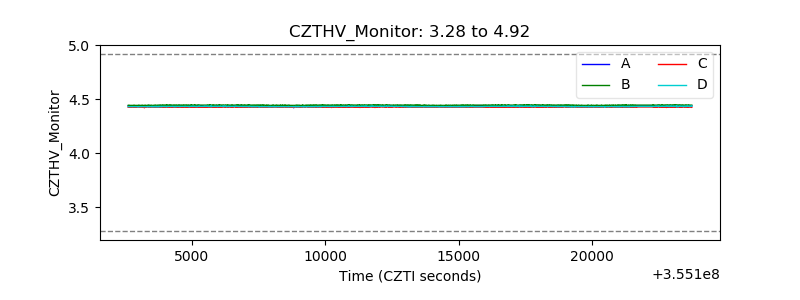 |
| D_VDD | 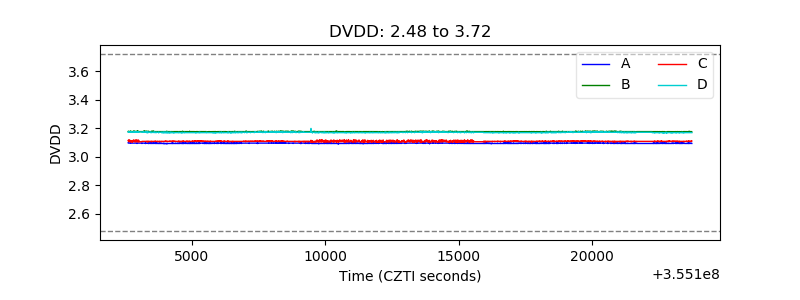 |
| Temperature 1 | 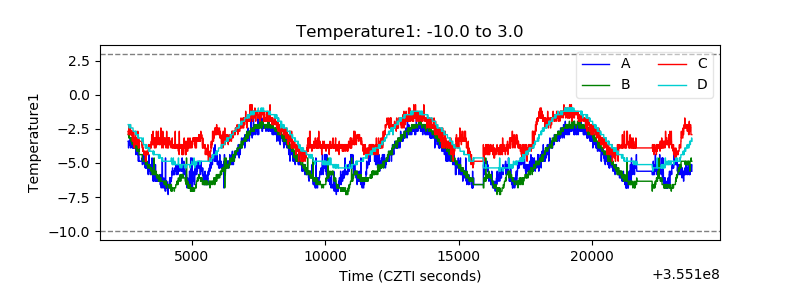 |
| Veto HV Monitor | 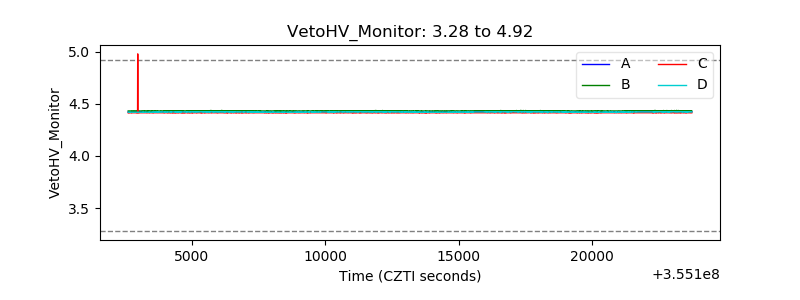 |
| Veto LLD | 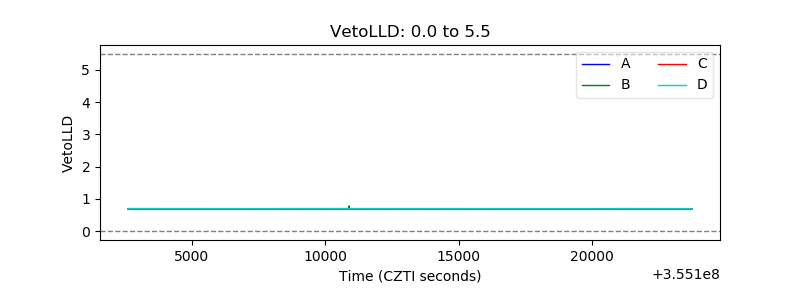 |
| Alpha Counter | 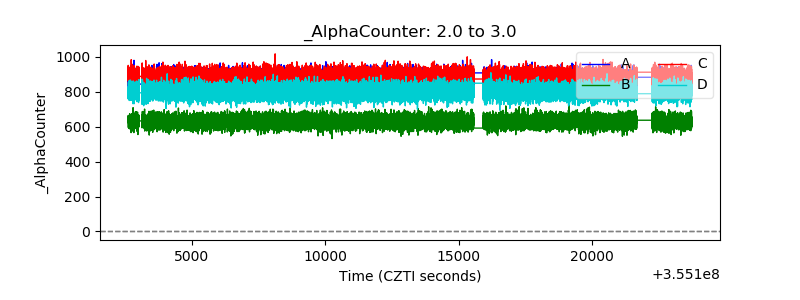 |
| _CPM_Rate | 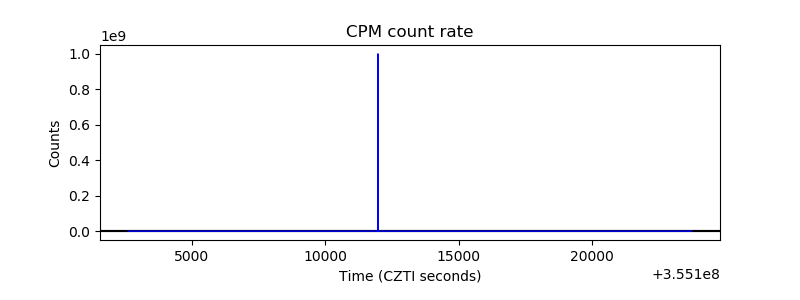 |
| CZT Counter | 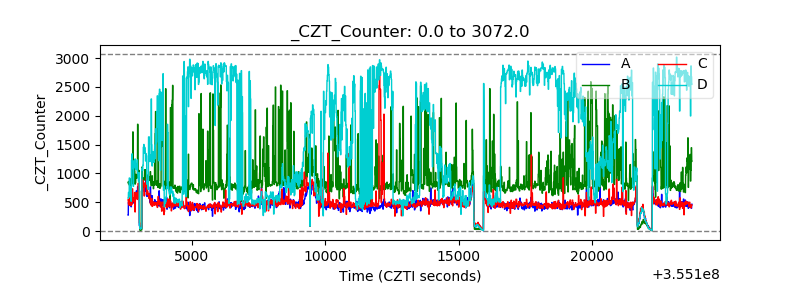 |
| +2.5 Volts monitor |  |
| +5 Volts monitor | 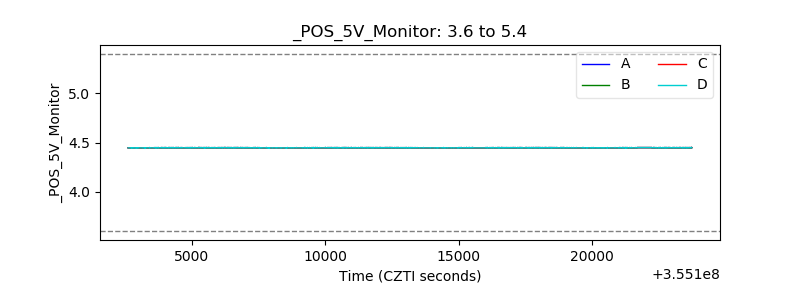 |
| _ROLL_ROT | 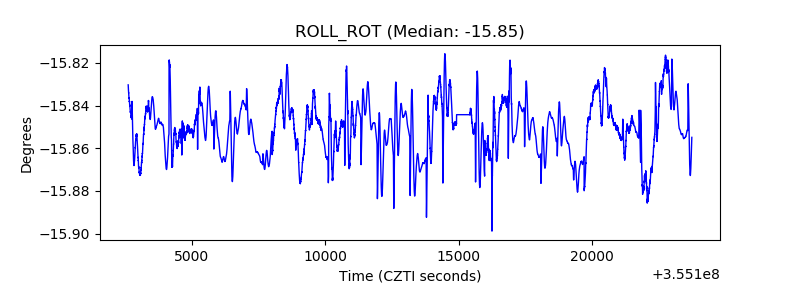 |
| _Roll_DEC | 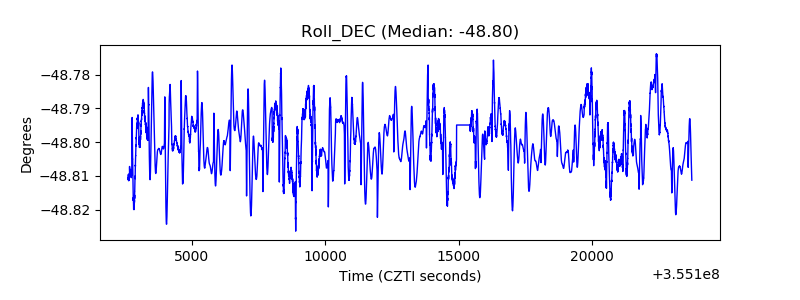 |
| _Roll_RA | 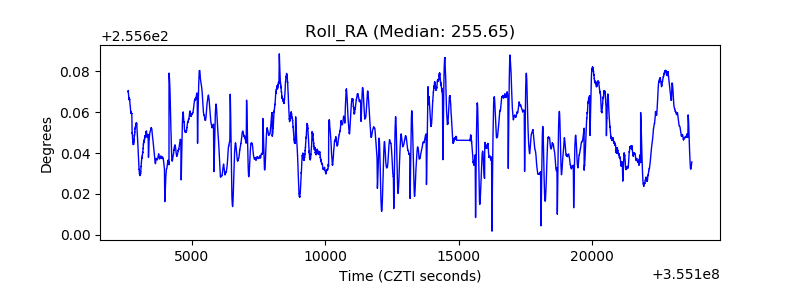 |
| Veto Counter | 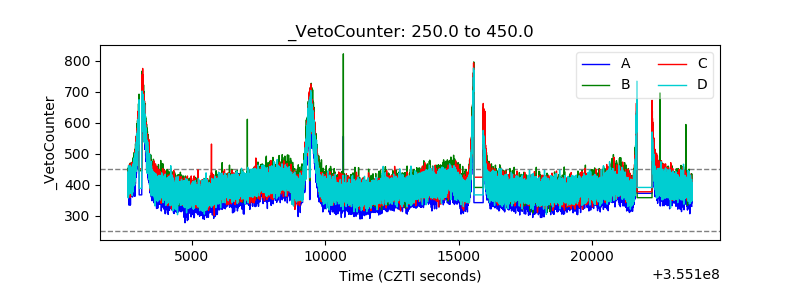 |