| Param | Original file | Final file |
|---|---|---|
| Filename | modeM0/AS1T03_291T01_9000004278_29816cztM0_level2.evt | modeM0/AS1T03_291T01_9000004278_29816cztM0_level2_quad_clean.evt |
| Size (bytes) | 2,005,513,920 | 271,290,240 |
| Size | 1.9 GB | 258.7 MB |
| Events in quadrant A | 10,546,602 | 1,780,629 |
| Events in quadrant B | 18,652,075 | 1,756,019 |
| Events in quadrant C | 10,885,837 | 1,691,959 |
| Events in quadrant D | 19,204,880 | 1,505,332 |
| Mode SS | |||
|---|---|---|---|
| Quadrant | BADHDUFLAG | Total packets | Discarded packets |
| A | 0 | 440 | 0 |
| B | 0 | 440 | 0 |
| C | 0 | 440 | 0 |
| D | 0 | 440 | 0 |
| Mode M0 | |||
|---|---|---|---|
| Quadrant | BADHDUFLAG | Total packets | Discarded packets |
| A | 0 | 45244 | 4 |
| B | 0 | 70144 | 4 |
| C | 0 | 46094 | 4 |
| D | 0 | 71215 | 4 |
| Mode M9 | |||
|---|---|---|---|
| Quadrant | BADHDUFLAG | Total packets | Discarded packets |
| A | 0 | 38 | 0 |
| B | 0 | 38 | 0 |
| C | 0 | 38 | 0 |
| D | 0 | 38 | 0 |
| Quadrant | Total seconds | Saturated seconds | Saturation percentage |
|---|---|---|---|
| A | 21516 | 223 | 1.036438% |
| B | 21517 | 729 | 3.388019% |
| C | 21517 | 407 | 1.891528% |
| D | 21517 | 2666 | 12.390203% |
Noise dominated data is calculated using 1-second bins in cleaned event files. If a bin has >2000 counts, and if more than 50% of those come from <1% of pixels, then it is considered to be noise-dominated and hence unusable.
| Quadrant | # 1 sec bins | Bins with >0 counts | Bins with >2000 counts | High rate bins dominated by noise | Noise dominated (total time) | Noise dominated (detector-on time) | Marked lightcurve |
|---|---|---|---|---|---|---|---|
| A | 25416 | 21520 | 3 | 3 | 0.01% | 0.01% | 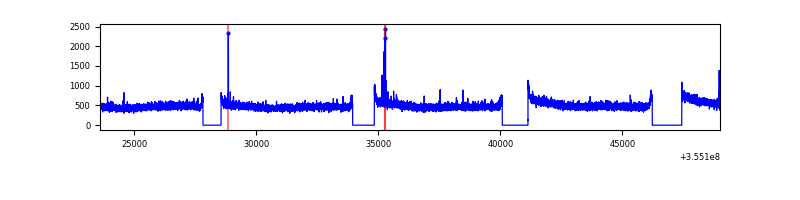 |
| B | 25417 | 21521 | 195 | 195 | 0.77% | 0.91% | 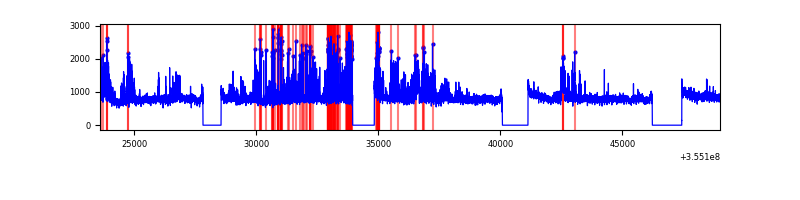 |
| C | 25417 | 21521 | 18 | 18 | 0.07% | 0.08% | 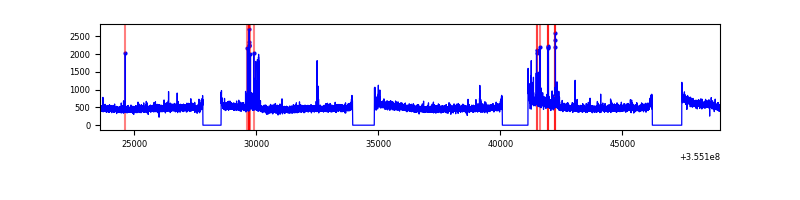 |
| D | 25417 | 21521 | 2432 | 2432 | 9.57% | 11.30% | 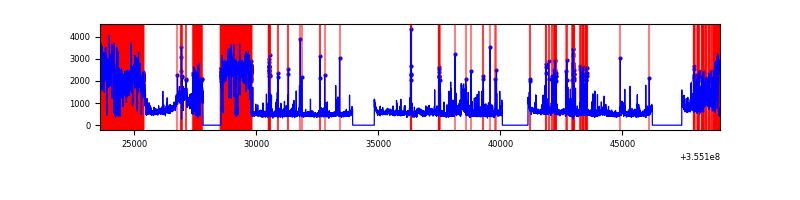 |
Top three noisy pixels from each quadrant. If the there are fewer than three noisy pixels in the level2.evt file, extra rows are filled as -1
| Pixel properties | Quadrant properties | ||||||
|---|---|---|---|---|---|---|---|
| Quadrant | DetID | PixID | Counts | Sigma | Mean | Median | Sigma |
| A | 0 | 13 | 40888 | 71.07 | 2722 | 2672 | 537.8 |
| A | 13 | 254 | 40237 | 69.86 | 2722 | 2672 | 537.8 |
| A | 3 | 137 | 25888 | 43.17 | 2722 | 2672 | 537.8 |
| B | 6 | 159 | 6144433 | 12203.07 | 2659 | 2595 | 503.3 |
| B | 0 | 189 | 1308866 | 2595.4 | 2659 | 2595 | 503.3 |
| B | 15 | 33 | 334093 | 658.64 | 2659 | 2595 | 503.3 |
| C | 14 | 238 | 437596 | 733.33 | 2579 | 2594 | 593.2 |
| C | 10 | 22 | 137191 | 226.9 | 2579 | 2594 | 593.2 |
| C | 15 | 208 | 111814 | 184.12 | 2579 | 2594 | 593.2 |
| D | 7 | 238 | 6249451 | 10797.53 | 2467 | 2405 | 578.6 |
| D | 7 | 80 | 1456579 | 2513.43 | 2467 | 2405 | 578.6 |
| D | 8 | 195 | 1346301 | 2322.82 | 2467 | 2405 | 578.6 |
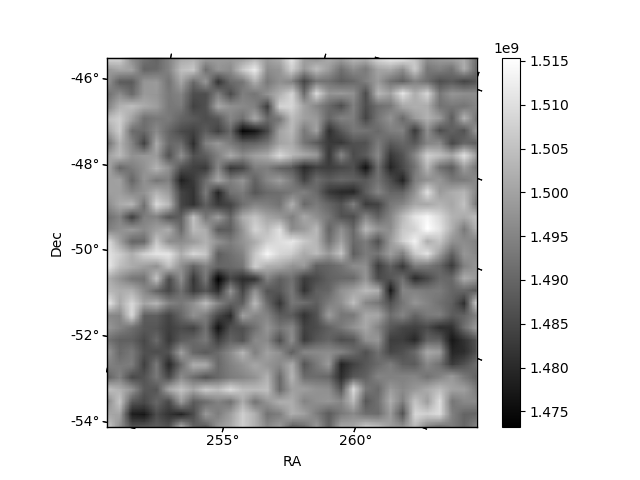
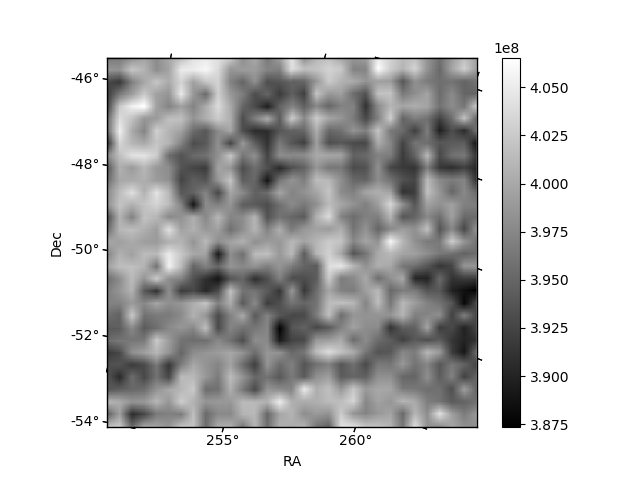
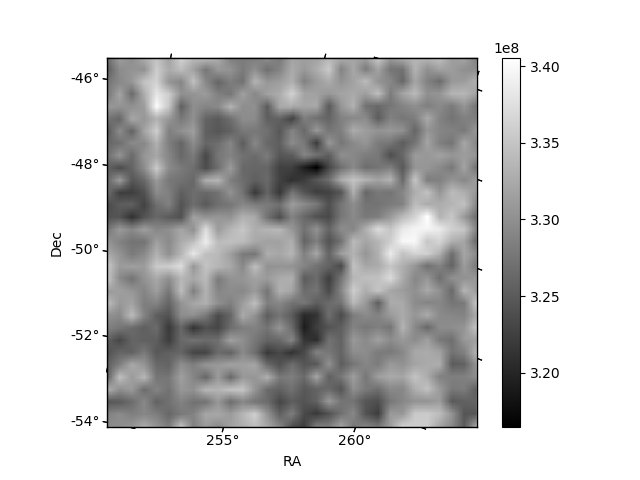
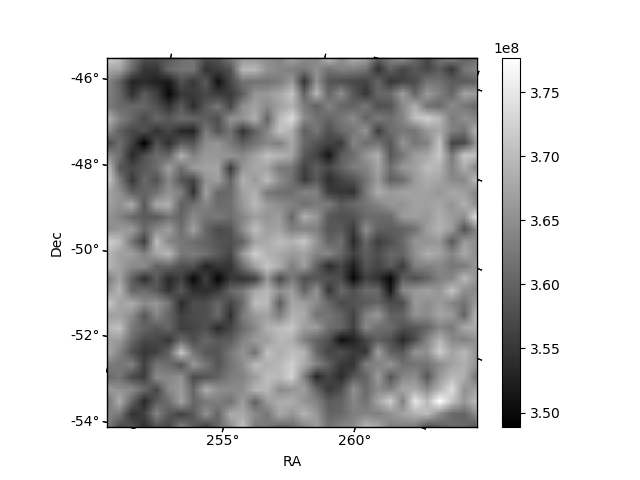
Histogram calculated using DETX and DETY for each event in the final _common_clean file
| Quadrant A | 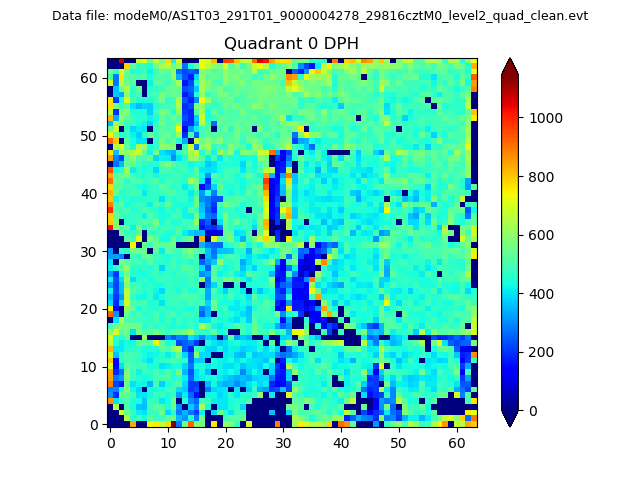 |
 |
Quadrant B |
|---|---|---|---|
| Quadrant D | 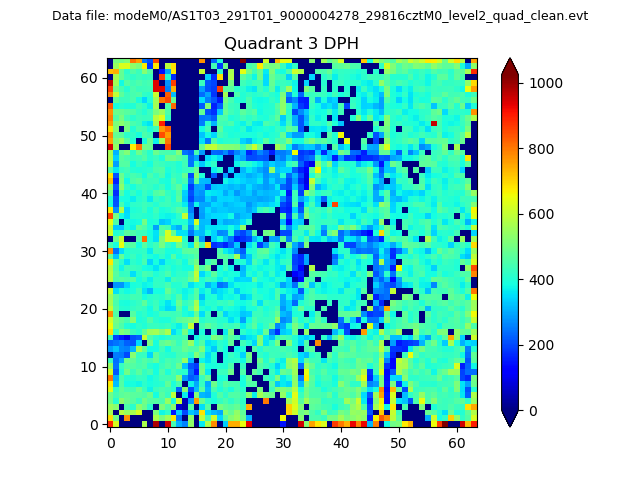 |
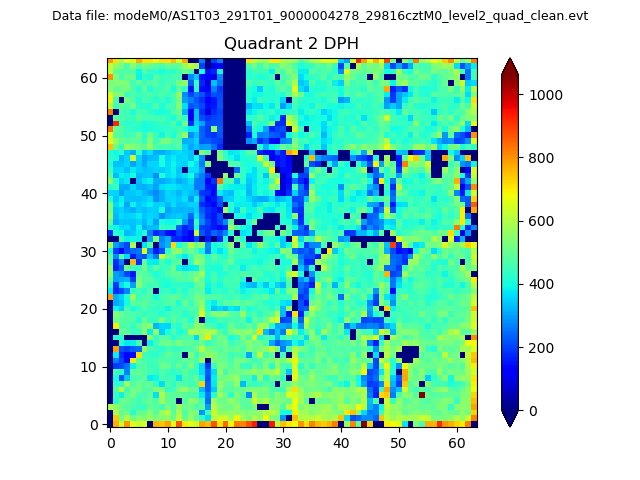 |
Quadrant C |
| Plot type | Count rate plots | Images |
|---|---|---|
| Comparison with Poisson distribution Blue bars denote a histogram of data divided into 1 sec bins. Red curve is a Poisson curve with rate = median count rate of data. |
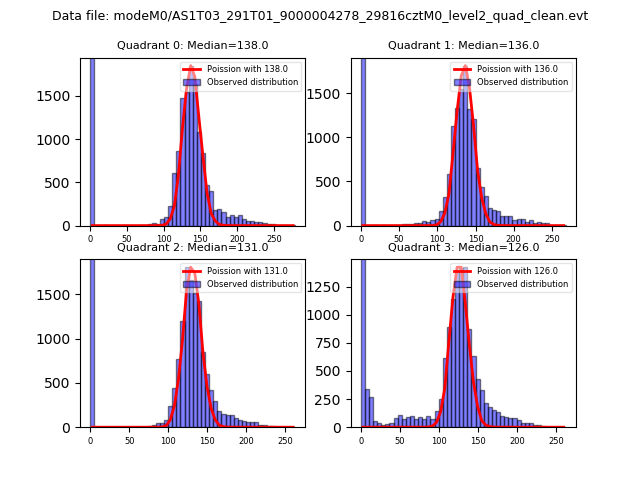 |
 |
| Quadrant-wise count rates Data is divided into 100 sec bins |
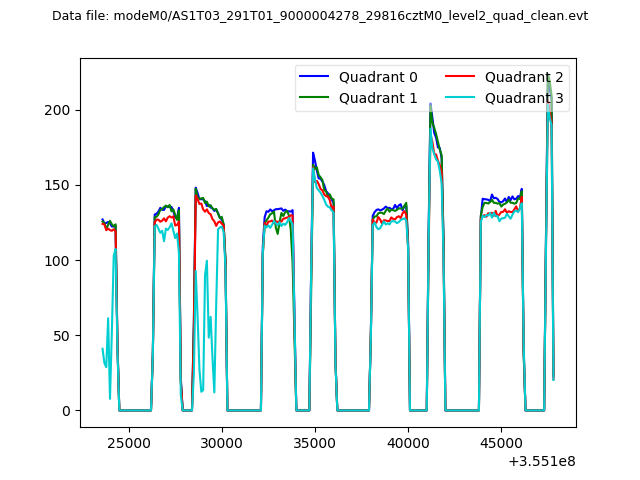 |
|
| Module-wise count rates for Quadrant A Data is divided into 100 sec bins |
 |
 |
| Module-wise count rates for Quadrant B Data is divided into 100 sec bins |
 |
 |
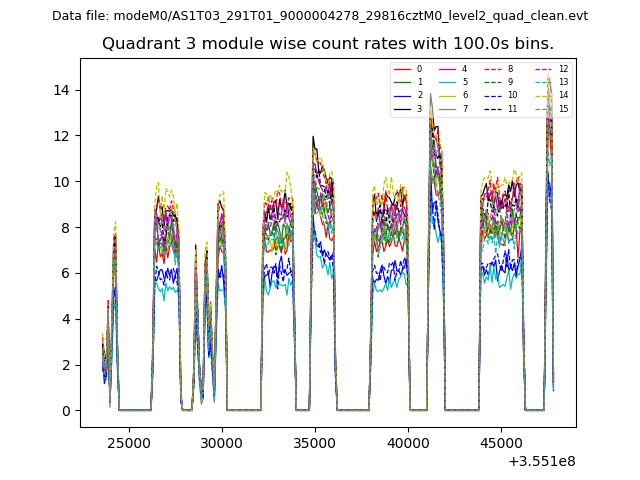
| Module-wise count rates for Quadrant C Data is divided into 100 sec bins |
 |
 |
| Module-wise count rates for Quadrant D Data is divided into 100 sec bins |
 |
 |
| Parameter | Plot |
|---|---|
| CZT HV Monitor |  |
| D_VDD | 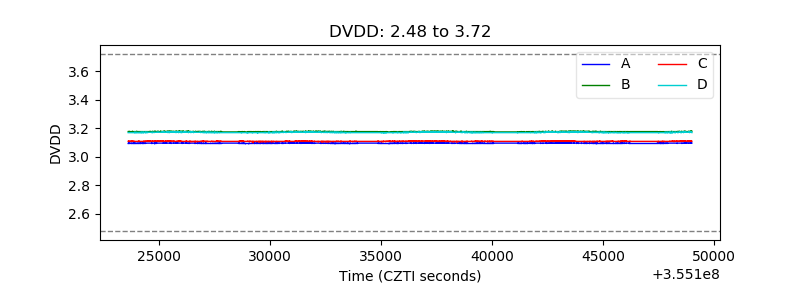 |
| Temperature 1 | 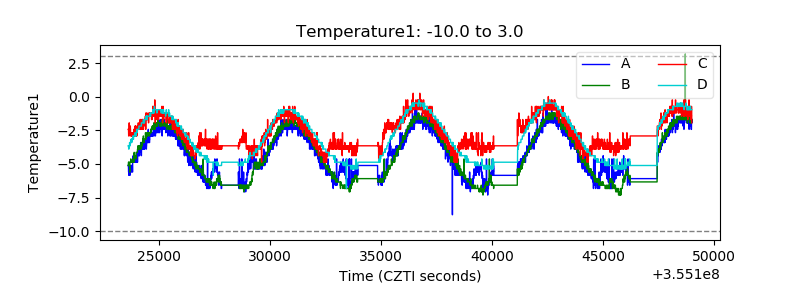 |
| Veto HV Monitor | 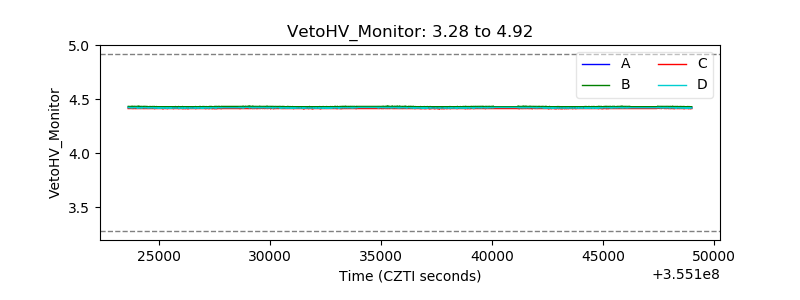 |
| Veto LLD | 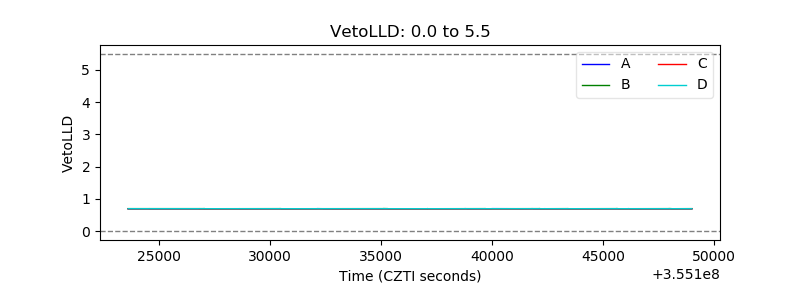 |
| Alpha Counter | 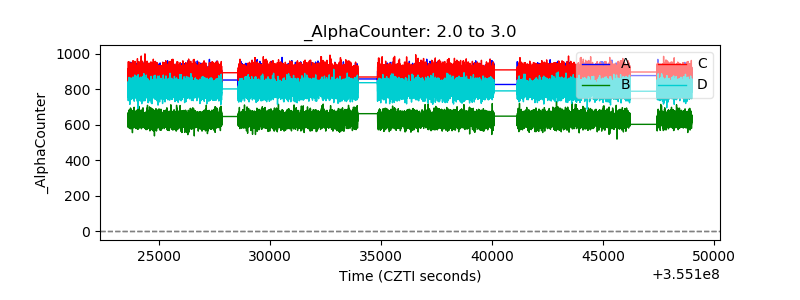 |
| _CPM_Rate | 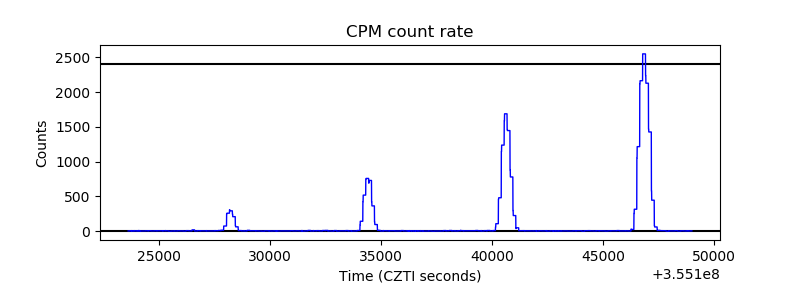 |
| CZT Counter | 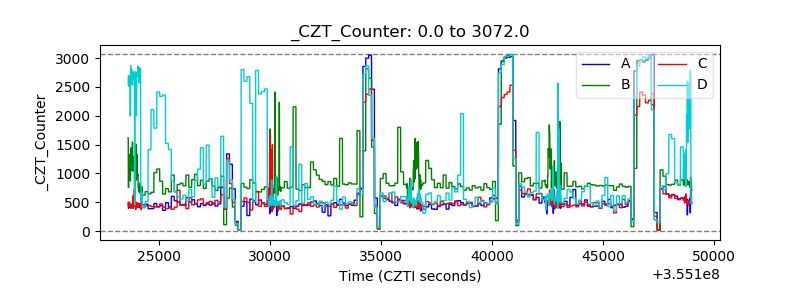 |
| +2.5 Volts monitor |  |
| +5 Volts monitor | 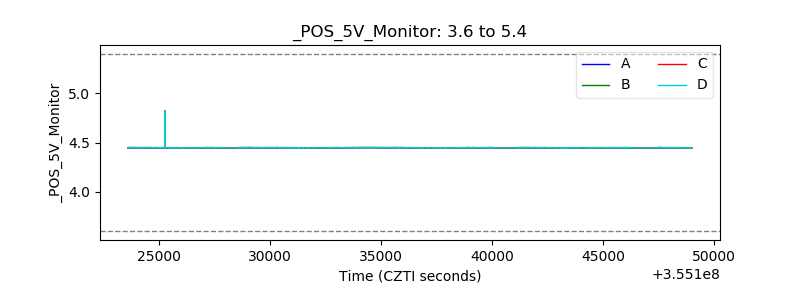 |
| _ROLL_ROT | 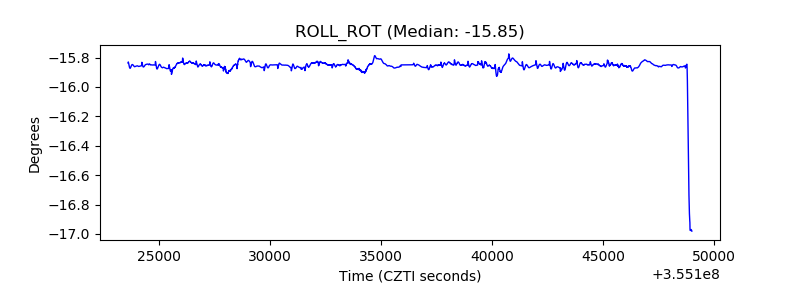 |
| _Roll_DEC | 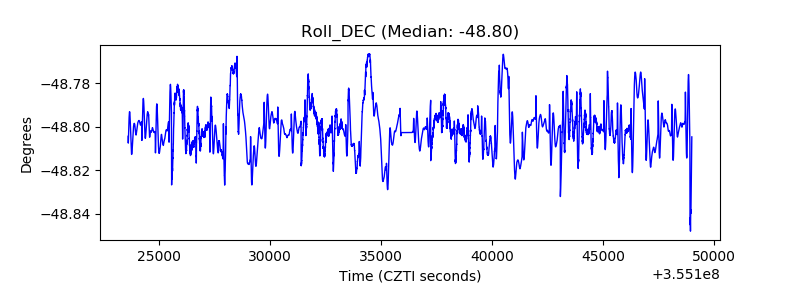 |
| _Roll_RA | 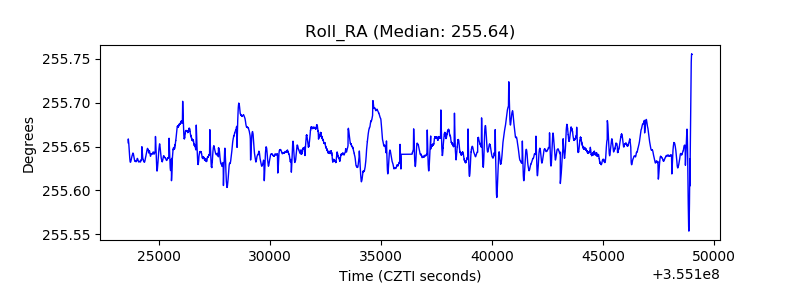 |
| Veto Counter | 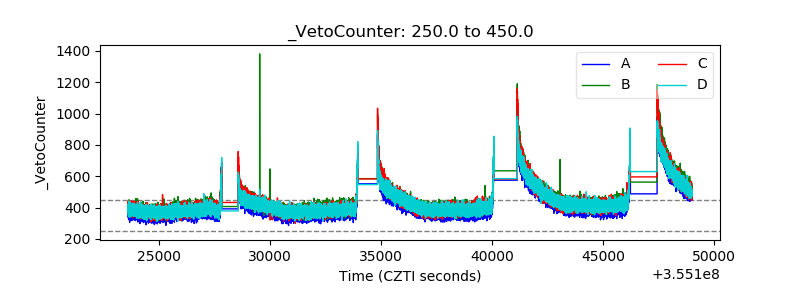 |