| Param | Original file | Final file |
|---|---|---|
| Filename | modeM0/AS1T03_291T01_9000004278_29818cztM0_level2.evt | modeM0/AS1T03_291T01_9000004278_29818cztM0_level2_quad_clean.evt |
| Size (bytes) | 571,619,520 | 74,070,720 |
| Size | 545.1 MB | 70.6 MB |
| Events in quadrant A | 3,641,638 | 469,292 |
| Events in quadrant B | 5,641,420 | 464,949 |
| Events in quadrant C | 3,592,436 | 435,340 |
| Events in quadrant D | 4,005,121 | 428,871 |
| Mode SS | |||
|---|---|---|---|
| Quadrant | BADHDUFLAG | Total packets | Discarded packets |
| A | 0 | 130 | 0 |
| B | 0 | 130 | 0 |
| C | 0 | 130 | 0 |
| D | 0 | 130 | 0 |
| Mode M0 | |||
|---|---|---|---|
| Quadrant | BADHDUFLAG | Total packets | Discarded packets |
| A | 0 | 14962 | 3 |
| B | 0 | 20916 | 2 |
| C | 0 | 14692 | 2 |
| D | 0 | 16220 | 2 |
| Mode M9 | |||
|---|---|---|---|
| Quadrant | BADHDUFLAG | Total packets | Discarded packets |
| A | 0 | 14 | 0 |
| B | 0 | 15 | 0 |
| C | 0 | 15 | 0 |
| D | 0 | 15 | 0 |
| Quadrant | Total seconds | Saturated seconds | Saturation percentage |
|---|---|---|---|
| A | 6365 | 119 | 1.869599% |
| B | 6365 | 199 | 3.126473% |
| C | 6365 | 180 | 2.827965% |
| D | 6365 | 104 | 1.633936% |
Noise dominated data is calculated using 1-second bins in cleaned event files. If a bin has >2000 counts, and if more than 50% of those come from <1% of pixels, then it is considered to be noise-dominated and hence unusable.
| Quadrant | # 1 sec bins | Bins with >0 counts | Bins with >2000 counts | High rate bins dominated by noise | Noise dominated (total time) | Noise dominated (detector-on time) | Marked lightcurve |
|---|---|---|---|---|---|---|---|
| A | 7675 | 6366 | 0 | 0 | 0.00% | 0.00% | 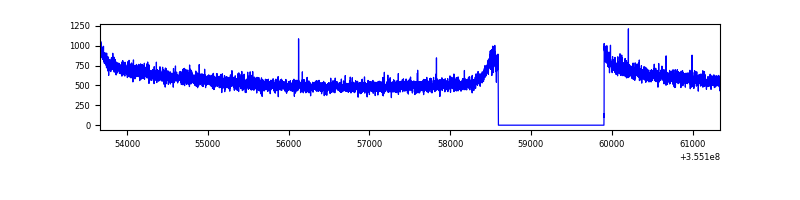 |
| B | 7675 | 6366 | 0 | 0 | 0.00% | 0.00% | 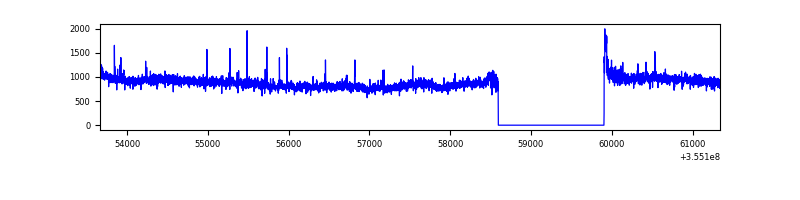 |
| C | 7675 | 6366 | 0 | 0 | 0.00% | 0.00% | 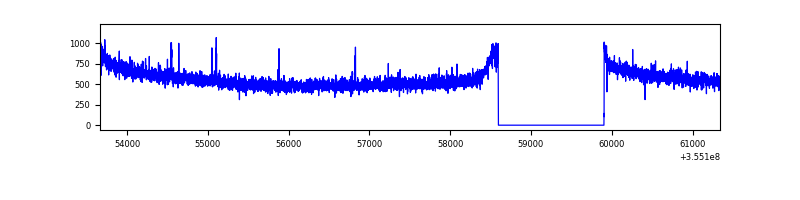 |
| D | 7675 | 6366 | 12 | 12 | 0.16% | 0.19% | 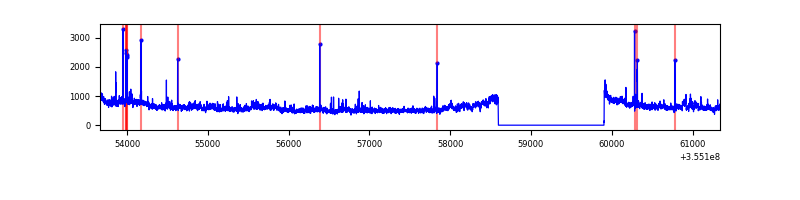 |
Top three noisy pixels from each quadrant. If the there are fewer than three noisy pixels in the level2.evt file, extra rows are filled as -1
| Pixel properties | Quadrant properties | ||||||
|---|---|---|---|---|---|---|---|
| Quadrant | DetID | PixID | Counts | Sigma | Mean | Median | Sigma |
| A | 13 | 254 | 12519 | 63.21 | 943 | 930 | 183.3 |
| A | 3 | 137 | 8110 | 39.16 | 943 | 930 | 183.3 |
| A | 0 | 226 | 8079 | 39.0 | 943 | 930 | 183.3 |
| B | 6 | 159 | 1887377 | 11134.15 | 927 | 909 | 169.4 |
| B | 0 | 190 | 50460 | 292.46 | 927 | 909 | 169.4 |
| B | 15 | 33 | 37046 | 213.28 | 927 | 909 | 169.4 |
| C | 14 | 238 | 154655 | 772.79 | 872 | 881 | 199.0 |
| C | 2 | 114 | 15816 | 75.06 | 872 | 881 | 199.0 |
| C | 14 | 254 | 13708 | 64.46 | 872 | 881 | 199.0 |
| D | 8 | 195 | 516085 | 2495.82 | 889 | 869 | 206.4 |
| D | 2 | 250 | 35887 | 169.63 | 889 | 869 | 206.4 |
| D | 12 | 79 | 33117 | 156.22 | 889 | 869 | 206.4 |
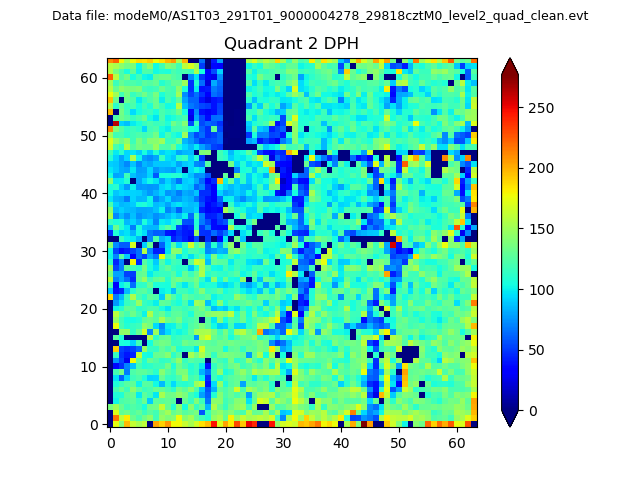
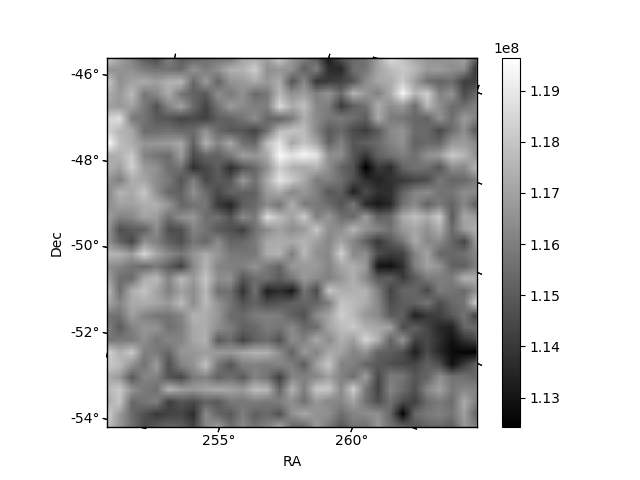
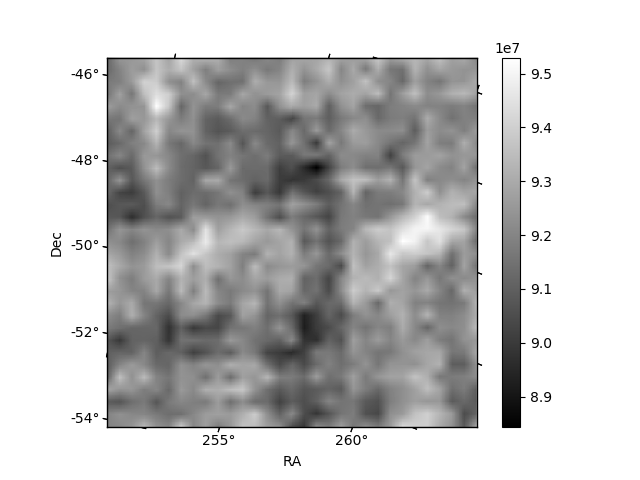
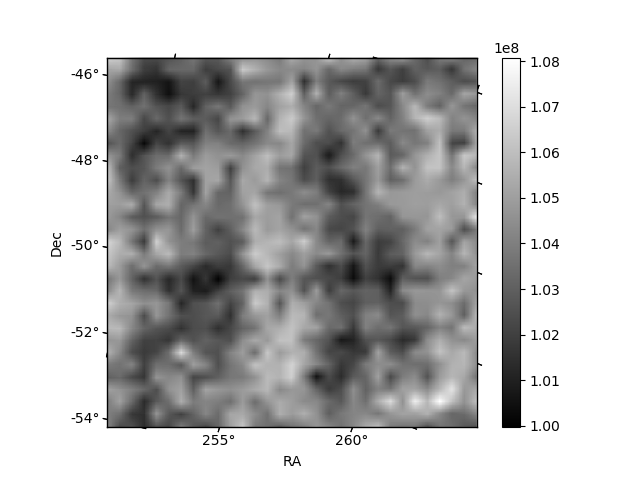
Histogram calculated using DETX and DETY for each event in the final _common_clean file
| Quadrant A | 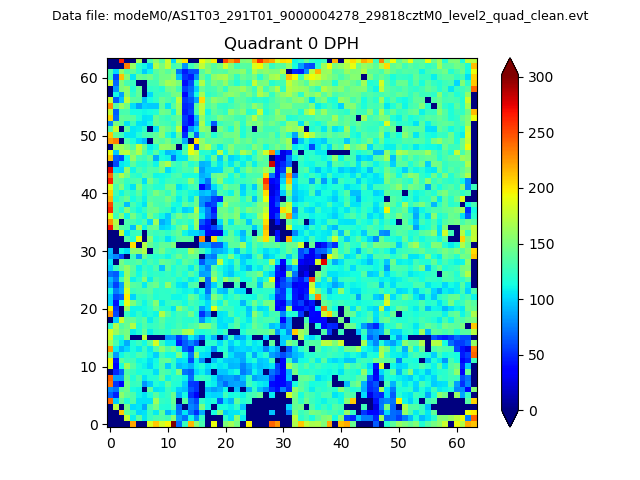 |
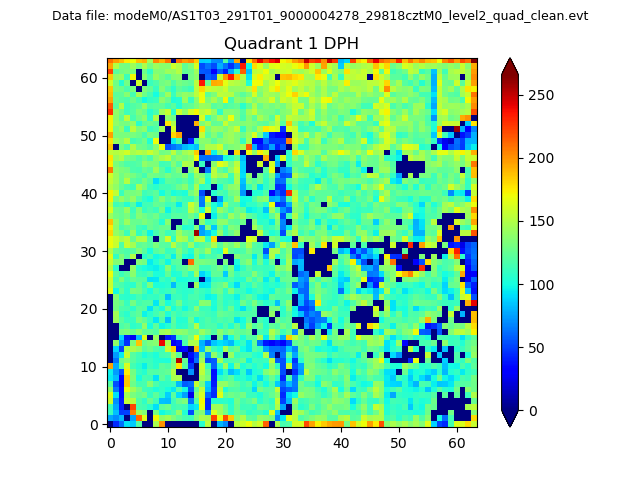 |
Quadrant B |
|---|---|---|---|
| Quadrant D | 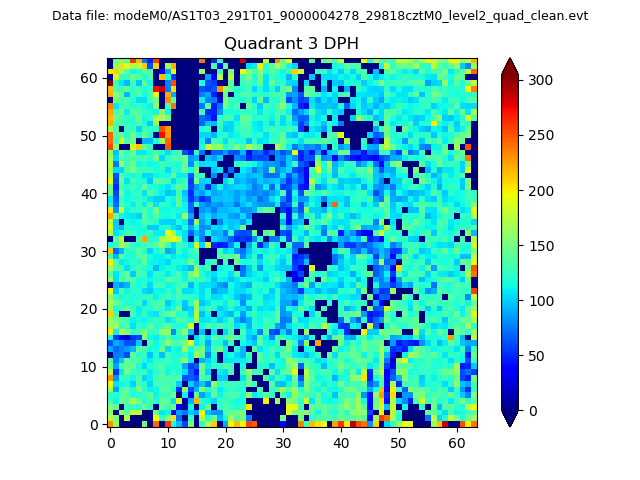 |
 |
Quadrant C |
| Plot type | Count rate plots | Images |
|---|---|---|
| Comparison with Poisson distribution Blue bars denote a histogram of data divided into 1 sec bins. Red curve is a Poisson curve with rate = median count rate of data. |
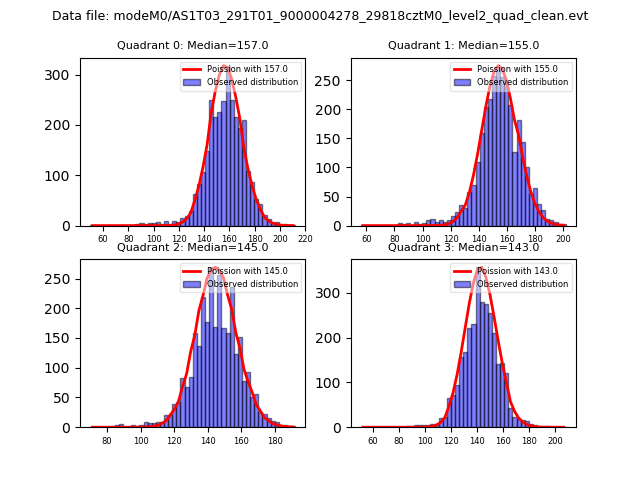 |
 |
| Quadrant-wise count rates Data is divided into 100 sec bins |
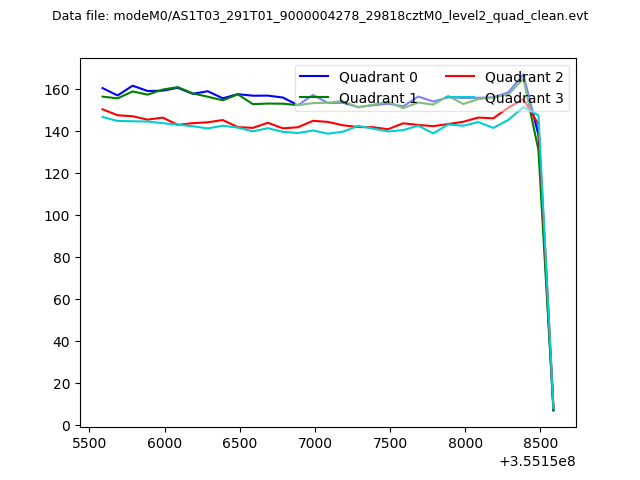 |
|
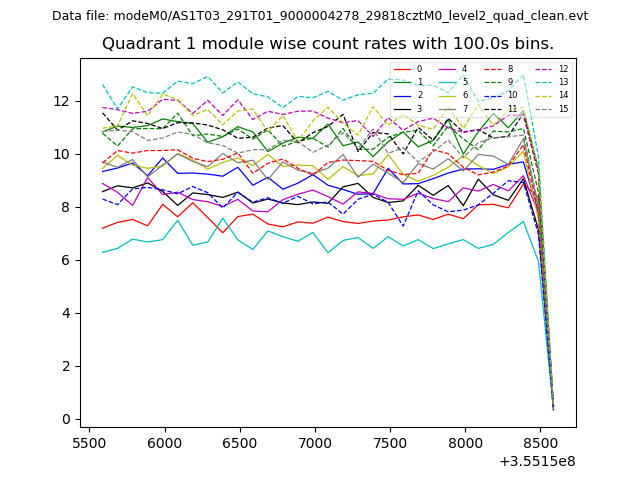
| Module-wise count rates for Quadrant A Data is divided into 100 sec bins |
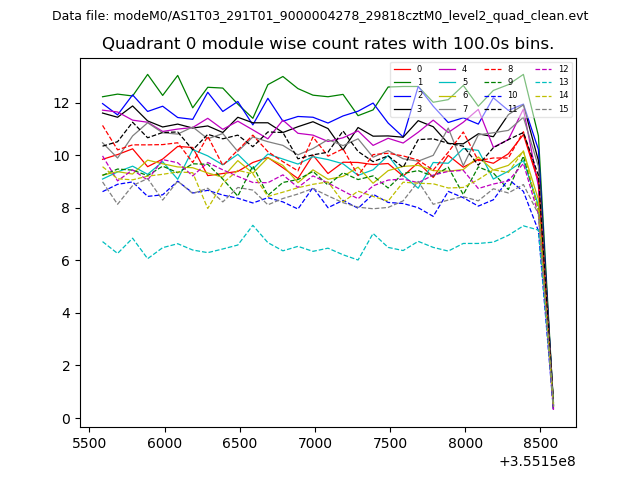 |
 |
| Module-wise count rates for Quadrant B Data is divided into 100 sec bins |
 |
 |
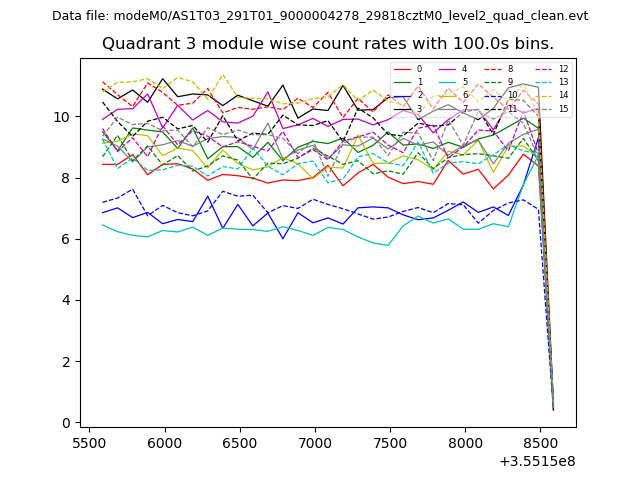
| Module-wise count rates for Quadrant C Data is divided into 100 sec bins |
 |
 |
| Module-wise count rates for Quadrant D Data is divided into 100 sec bins |
 |
 |
| Parameter | Plot |
|---|---|
| CZT HV Monitor | 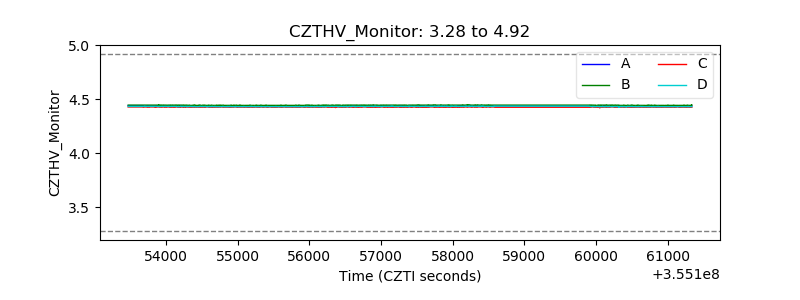 |
| D_VDD | 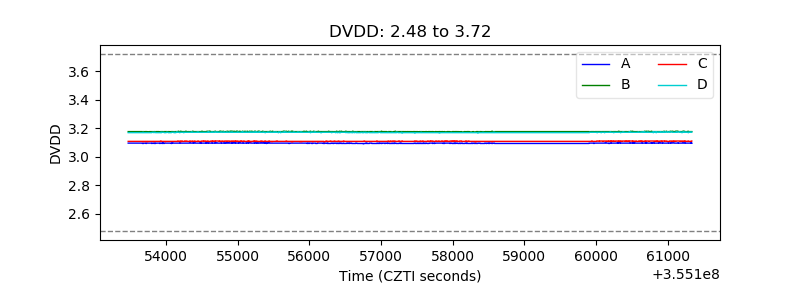 |
| Temperature 1 | 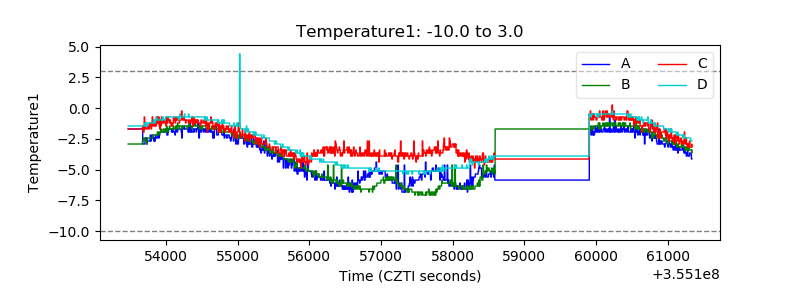 |
| Veto HV Monitor | 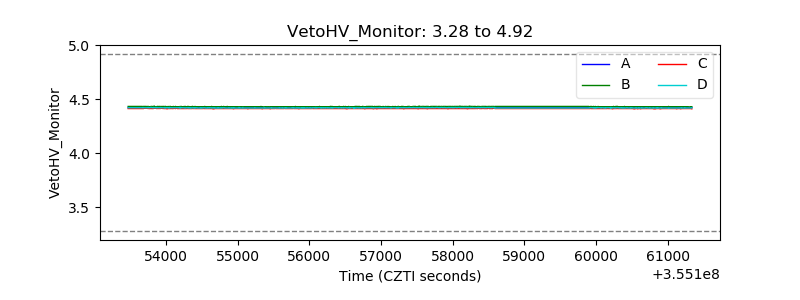 |
| Veto LLD | 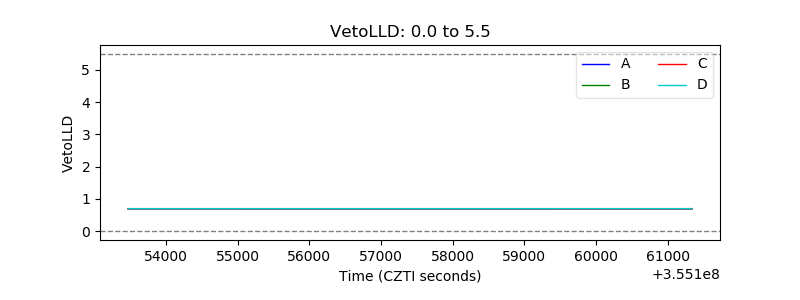 |
| Alpha Counter |  |
| _CPM_Rate | 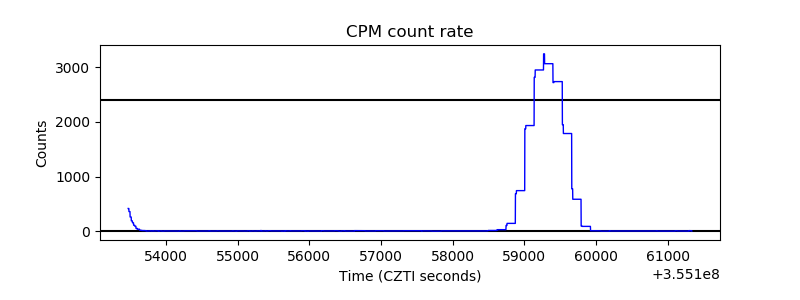 |
| CZT Counter |  |
| +2.5 Volts monitor |  |
| +5 Volts monitor | 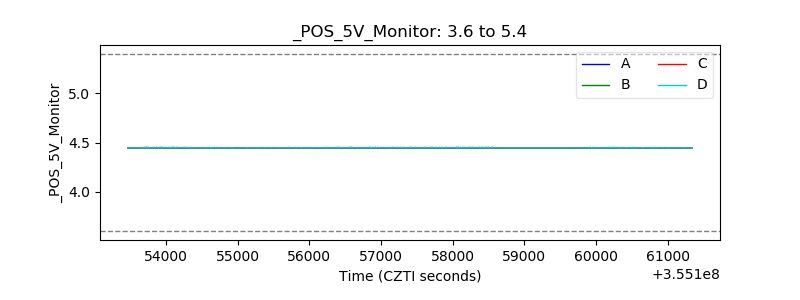 |
| _ROLL_ROT | 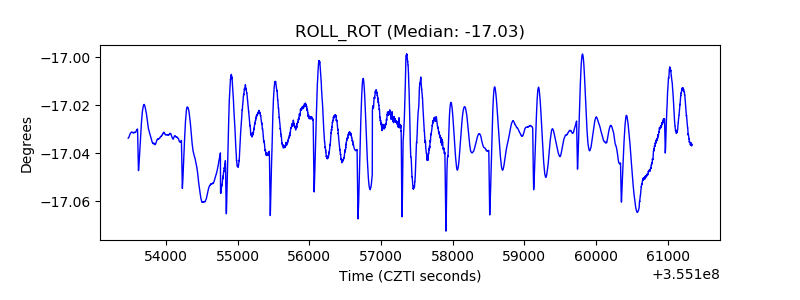 |
| _Roll_DEC | 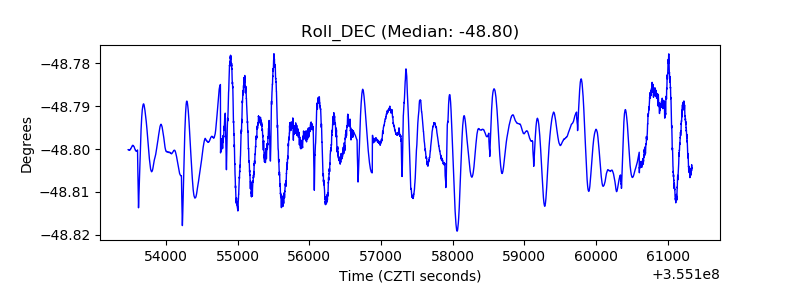 |
| _Roll_RA |  |
| Veto Counter | 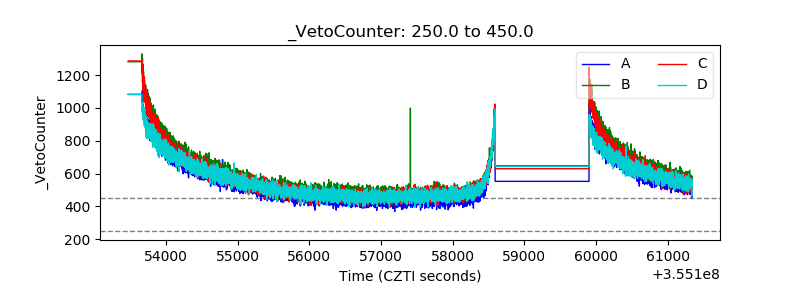 |