| Param | Original file | Final file |
|---|---|---|
| Filename | modeM0/AS1T03_291T01_9000004278_29819cztM0_level2.evt | modeM0/AS1T03_291T01_9000004278_29819cztM0_level2_quad_clean.evt |
| Size (bytes) | 502,617,600 | 84,790,080 |
| Size | 479.3 MB | 80.9 MB |
| Events in quadrant A | 3,214,356 | 564,388 |
| Events in quadrant B | 5,039,960 | 559,820 |
| Events in quadrant C | 3,166,785 | 521,282 |
| Events in quadrant D | 3,404,705 | 513,817 |
| Mode SS | |||
|---|---|---|---|
| Quadrant | BADHDUFLAG | Total packets | Discarded packets |
| A | 0 | 118 | 0 |
| B | 0 | 118 | 0 |
| C | 0 | 118 | 0 |
| D | 0 | 118 | 0 |
| Mode M0 | |||
|---|---|---|---|
| Quadrant | BADHDUFLAG | Total packets | Discarded packets |
| A | 0 | 13146 | 1 |
| B | 0 | 18671 | 1 |
| C | 0 | 12843 | 1 |
| D | 0 | 13976 | 1 |
| Mode M9 | |||
|---|---|---|---|
| Quadrant | BADHDUFLAG | Total packets | Discarded packets |
| A | 0 | 13 | 0 |
| B | 0 | 13 | 0 |
| C | 0 | 13 | 0 |
| D | 0 | 13 | 0 |
| Quadrant | Total seconds | Saturated seconds | Saturation percentage |
|---|---|---|---|
| A | 5846 | 98 | 1.676360% |
| B | 5846 | 176 | 3.010606% |
| C | 5846 | 146 | 2.497434% |
| D | 5847 | 76 | 1.299812% |
Noise dominated data is calculated using 1-second bins in cleaned event files. If a bin has >2000 counts, and if more than 50% of those come from <1% of pixels, then it is considered to be noise-dominated and hence unusable.
| Quadrant | # 1 sec bins | Bins with >0 counts | Bins with >2000 counts | High rate bins dominated by noise | Noise dominated (total time) | Noise dominated (detector-on time) | Marked lightcurve |
|---|---|---|---|---|---|---|---|
| A | 7156 | 5847 | 0 | 0 | 0.00% | 0.00% | 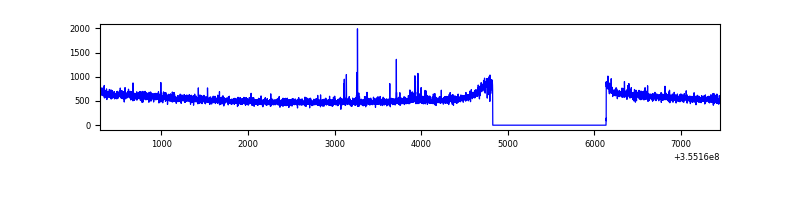 |
| B | 7156 | 5847 | 1 | 1 | 0.01% | 0.02% | 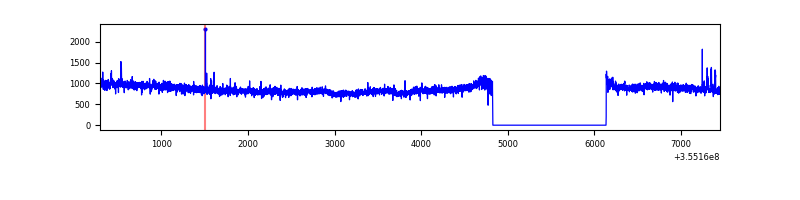 |
| C | 7156 | 5847 | 0 | 0 | 0.00% | 0.00% | 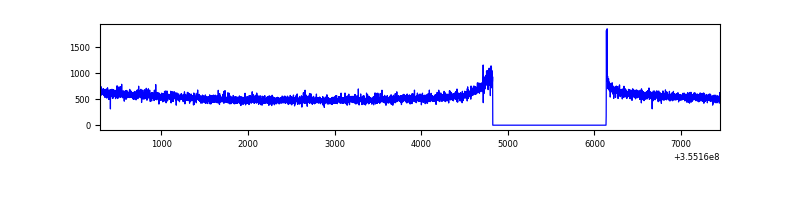 |
| D | 7157 | 5848 | 14 | 14 | 0.20% | 0.24% | 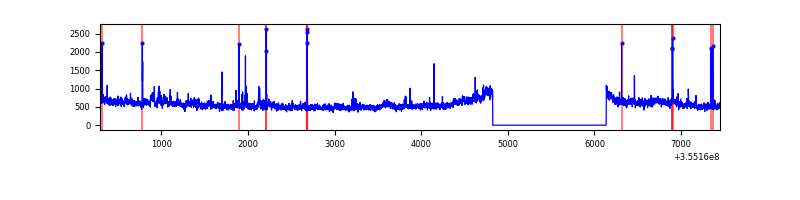 |
Top three noisy pixels from each quadrant. If the there are fewer than three noisy pixels in the level2.evt file, extra rows are filled as -1
| Pixel properties | Quadrant properties | ||||||
|---|---|---|---|---|---|---|---|
| Quadrant | DetID | PixID | Counts | Sigma | Mean | Median | Sigma |
| A | 0 | 13 | 27121 | 163.0 | 825 | 815 | 161.4 |
| A | 13 | 254 | 11590 | 66.76 | 825 | 815 | 161.4 |
| A | 3 | 137 | 7214 | 39.65 | 825 | 815 | 161.4 |
| B | 6 | 159 | 1800988 | 12130.28 | 813 | 798 | 148.4 |
| B | 0 | 190 | 28358 | 185.71 | 813 | 798 | 148.4 |
| B | 12 | 111 | 17096 | 109.82 | 813 | 798 | 148.4 |
| C | 14 | 238 | 129875 | 741.77 | 766 | 772 | 174.0 |
| C | 3 | 233 | 30708 | 172.0 | 766 | 772 | 174.0 |
| C | 2 | 114 | 14480 | 78.76 | 766 | 772 | 174.0 |
| D | 8 | 195 | 360866 | 2003.4 | 777 | 758 | 179.7 |
| D | 12 | 79 | 46573 | 254.88 | 777 | 758 | 179.7 |
| D | 2 | 234 | 25996 | 140.4 | 777 | 758 | 179.7 |
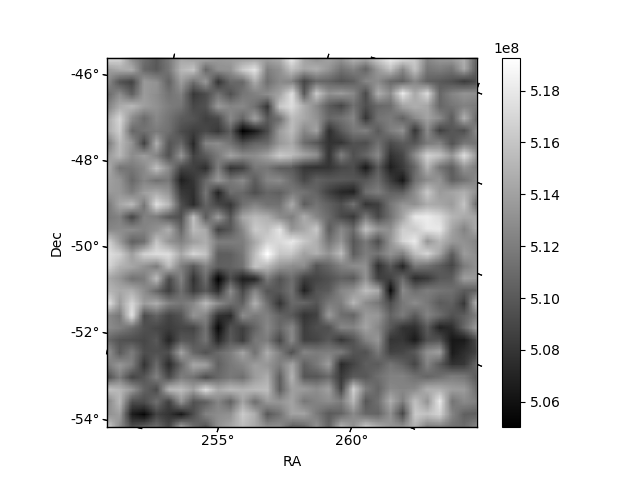
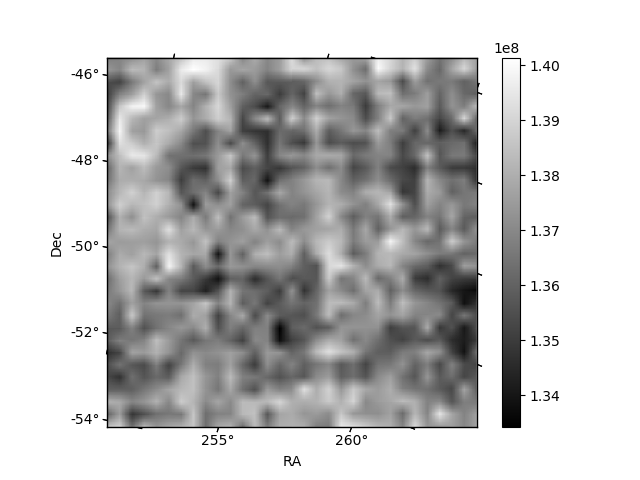
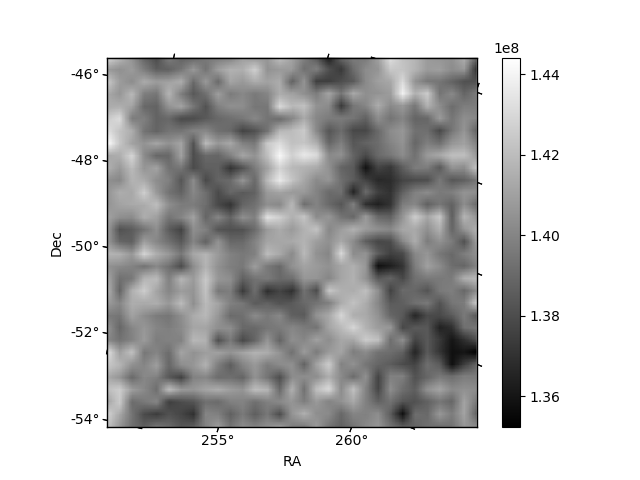
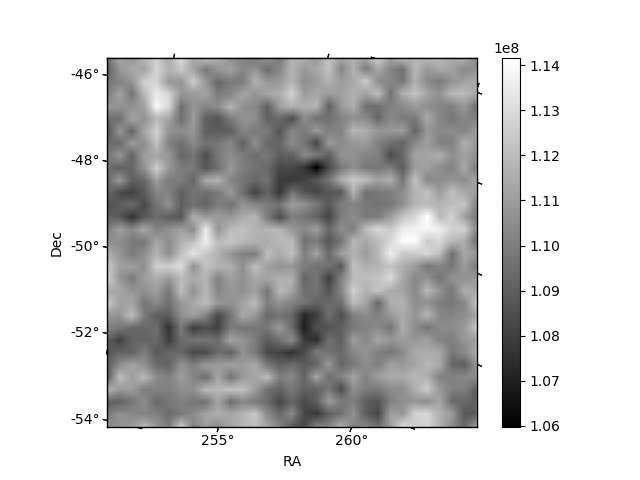
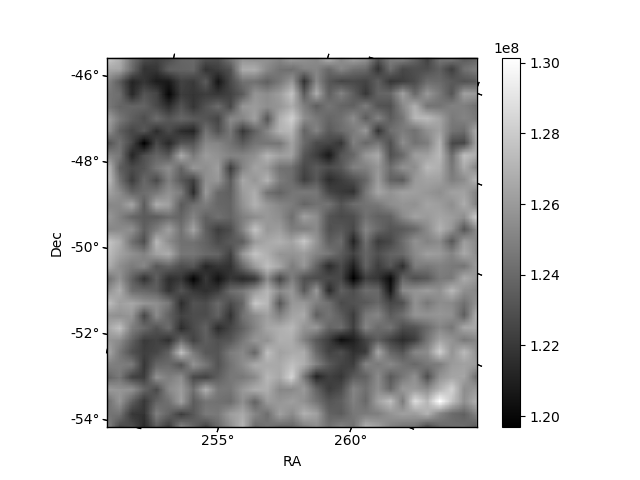
Histogram calculated using DETX and DETY for each event in the final _common_clean file
| Quadrant A | 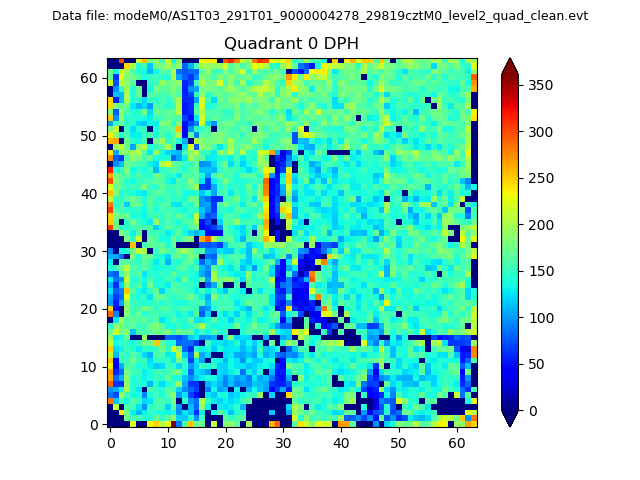 |
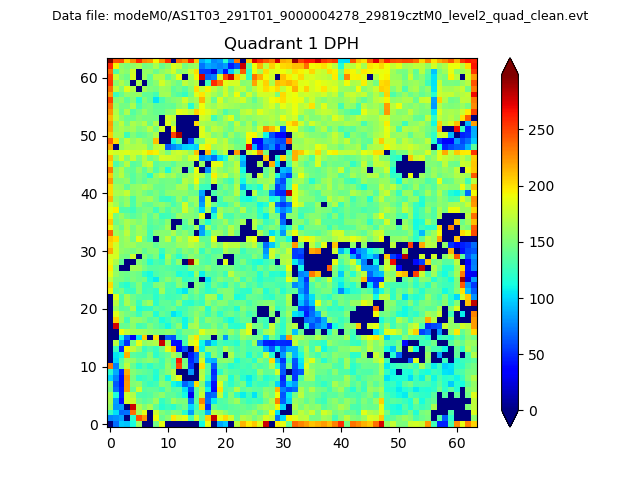 |
Quadrant B |
|---|---|---|---|
| Quadrant D | 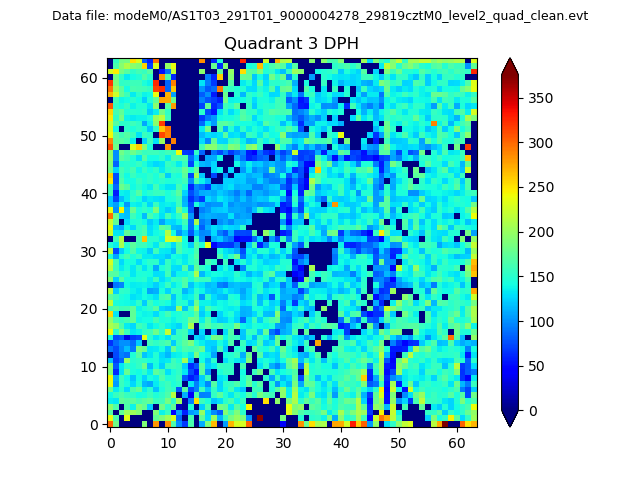 |
 |
Quadrant C |
| Plot type | Count rate plots | Images |
|---|---|---|
| Comparison with Poisson distribution Blue bars denote a histogram of data divided into 1 sec bins. Red curve is a Poisson curve with rate = median count rate of data. |
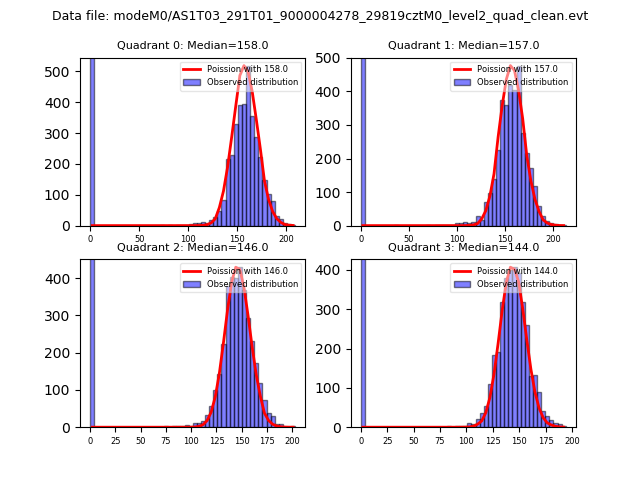 |
 |
| Quadrant-wise count rates Data is divided into 100 sec bins |
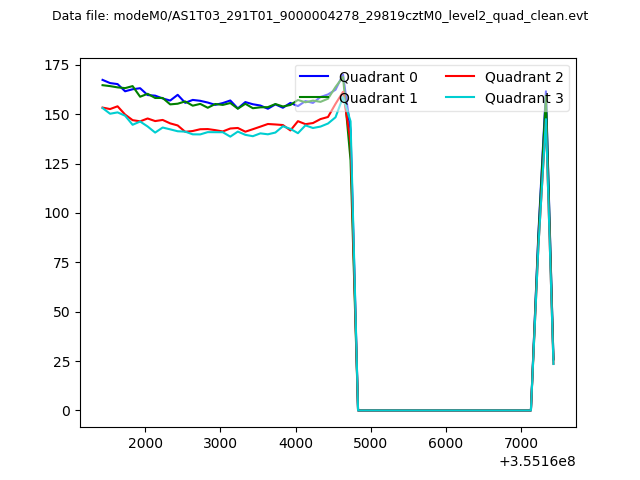 |
|
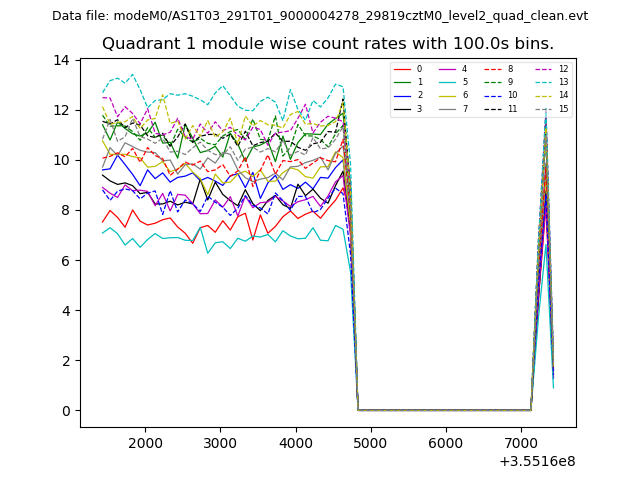
| Module-wise count rates for Quadrant A Data is divided into 100 sec bins |
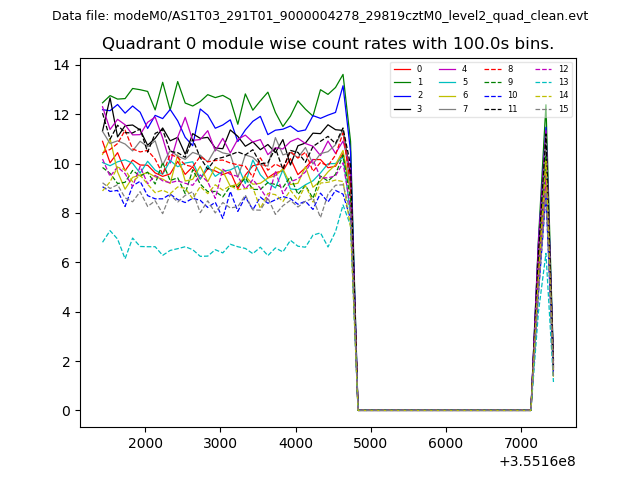 |
 |
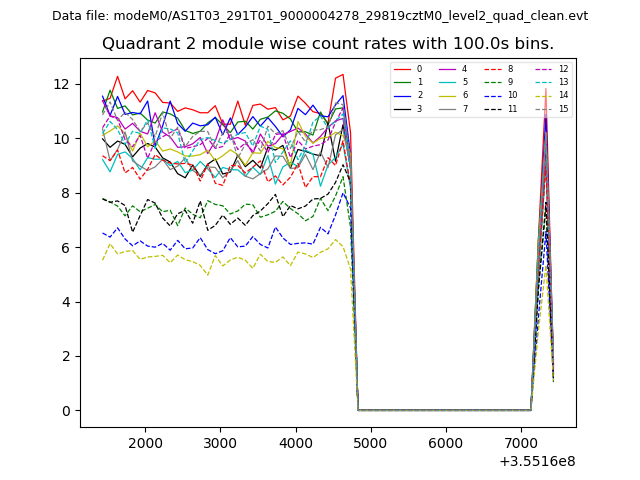
| Module-wise count rates for Quadrant B Data is divided into 100 sec bins |
 |
 |
| Module-wise count rates for Quadrant C Data is divided into 100 sec bins |
 |
 |
| Module-wise count rates for Quadrant D Data is divided into 100 sec bins |
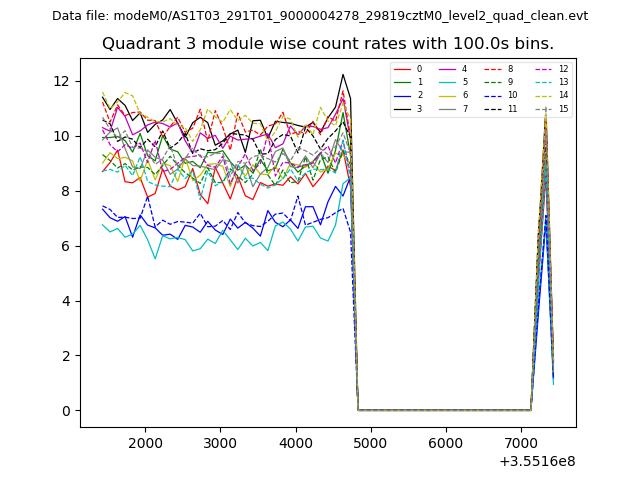 |
 |
| Parameter | Plot |
|---|---|
| CZT HV Monitor | 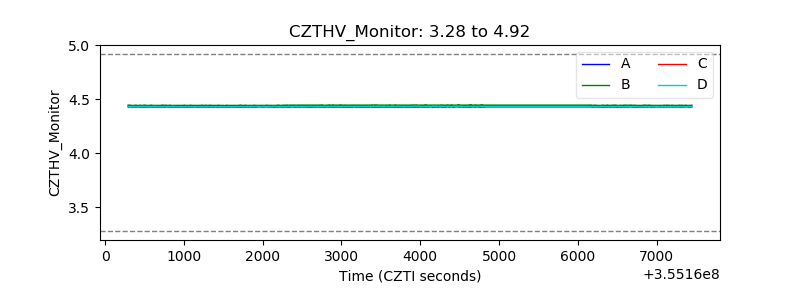 |
| D_VDD | 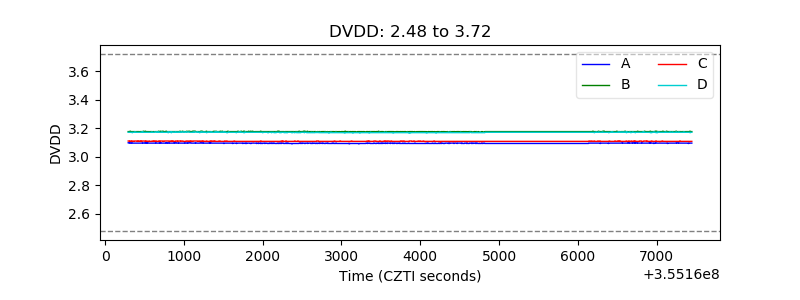 |
| Temperature 1 | 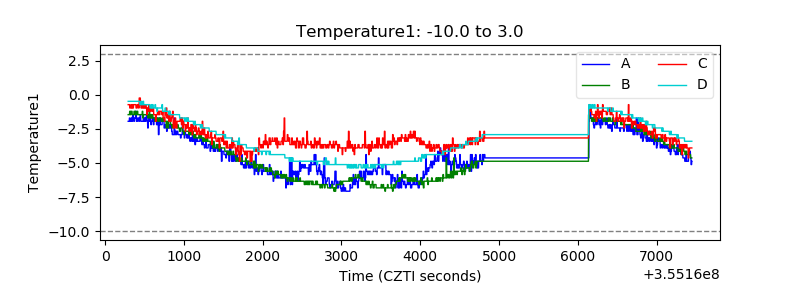 |
| Veto HV Monitor | 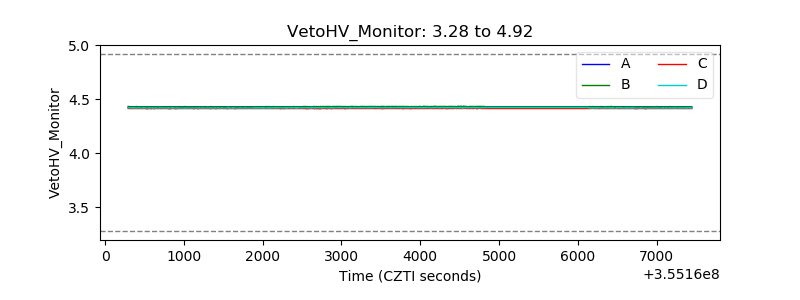 |
| Veto LLD | 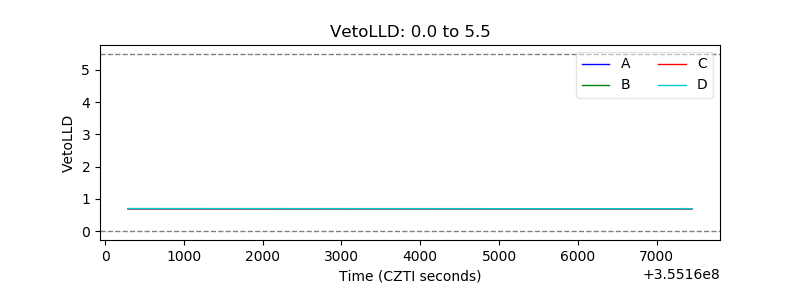 |
| Alpha Counter | 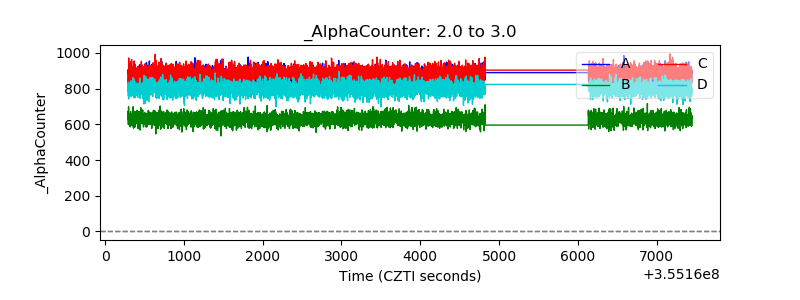 |
| _CPM_Rate | 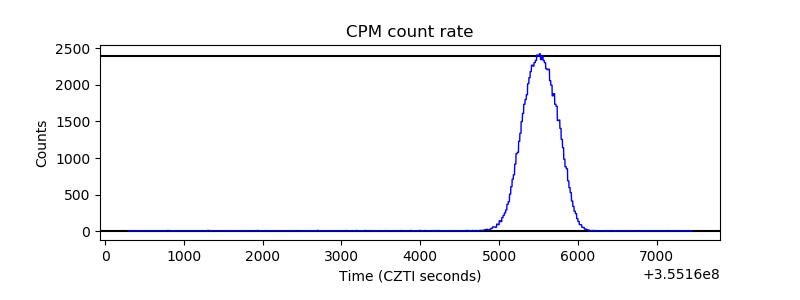 |
| CZT Counter |  |
| +2.5 Volts monitor | 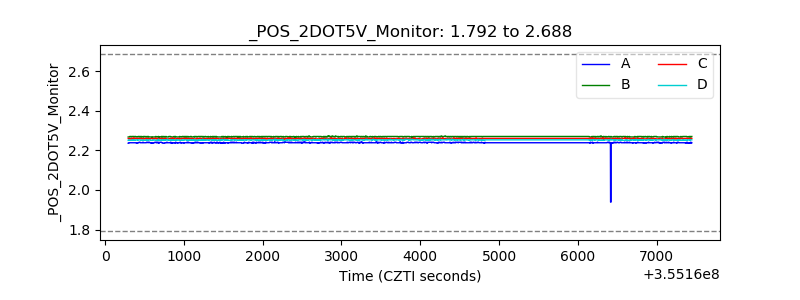 |
| +5 Volts monitor |  |
| _ROLL_ROT | 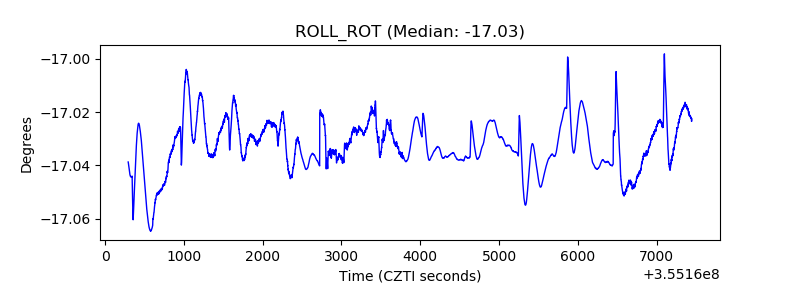 |
| _Roll_DEC | 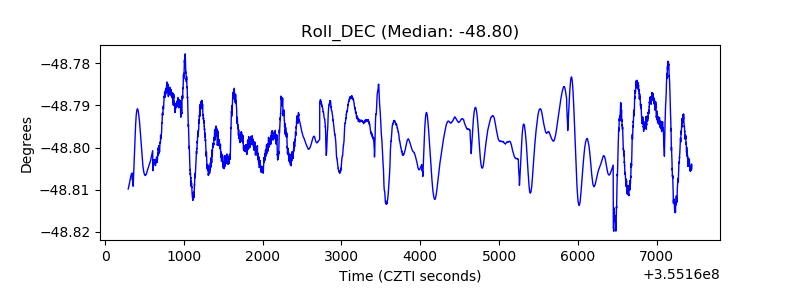 |
| _Roll_RA | 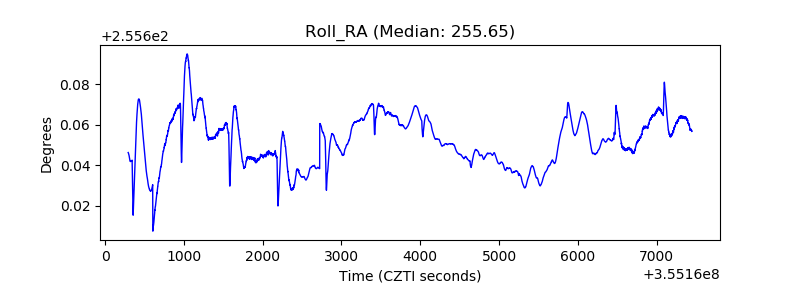 |
| Veto Counter | 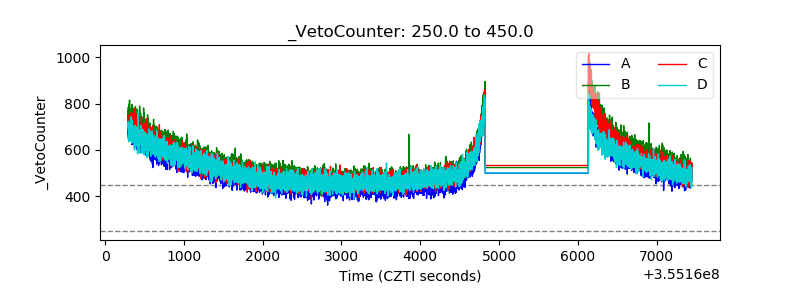 |