| Param | Original file | Final file |
|---|---|---|
| Filename | modeM0/AS1T03_291T01_9000004278_29820cztM0_level2.evt | modeM0/AS1T03_291T01_9000004278_29820cztM0_level2_quad_clean.evt |
| Size (bytes) | 533,557,440 | 99,351,360 |
| Size | 508.8 MB | 94.7 MB |
| Events in quadrant A | 3,378,832 | 666,320 |
| Events in quadrant B | 5,285,224 | 667,037 |
| Events in quadrant C | 3,551,178 | 621,796 |
| Events in quadrant D | 3,514,051 | 611,319 |
| Mode SS | |||
|---|---|---|---|
| Quadrant | BADHDUFLAG | Total packets | Discarded packets |
| A | 0 | 130 | 0 |
| B | 0 | 130 | 0 |
| C | 0 | 130 | 0 |
| D | 0 | 130 | 0 |
| Mode M0 | |||
|---|---|---|---|
| Quadrant | BADHDUFLAG | Total packets | Discarded packets |
| A | 0 | 13920 | 3 |
| B | 0 | 19656 | 4 |
| C | 0 | 14357 | 3 |
| D | 0 | 14553 | 3 |
| Mode M9 | |||
|---|---|---|---|
| Quadrant | BADHDUFLAG | Total packets | Discarded packets |
| A | 0 | 13 | 0 |
| B | 0 | 14 | 0 |
| C | 0 | 14 | 0 |
| D | 0 | 14 | 0 |
| Quadrant | Total seconds | Saturated seconds | Saturation percentage |
|---|---|---|---|
| A | 6337 | 97 | 1.530693% |
| B | 6336 | 172 | 2.714646% |
| C | 6336 | 185 | 2.919823% |
| D | 6336 | 93 | 1.467803% |
Noise dominated data is calculated using 1-second bins in cleaned event files. If a bin has >2000 counts, and if more than 50% of those come from <1% of pixels, then it is considered to be noise-dominated and hence unusable.
| Quadrant | # 1 sec bins | Bins with >0 counts | Bins with >2000 counts | High rate bins dominated by noise | Noise dominated (total time) | Noise dominated (detector-on time) | Marked lightcurve |
|---|---|---|---|---|---|---|---|
| A | 7522 | 6339 | 4 | 4 | 0.05% | 0.06% | 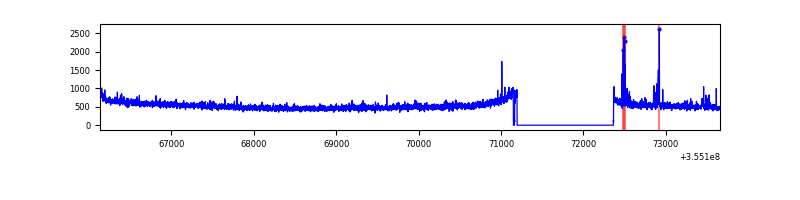 |
| B | 7521 | 6338 | 0 | 0 | 0.00% | 0.00% | 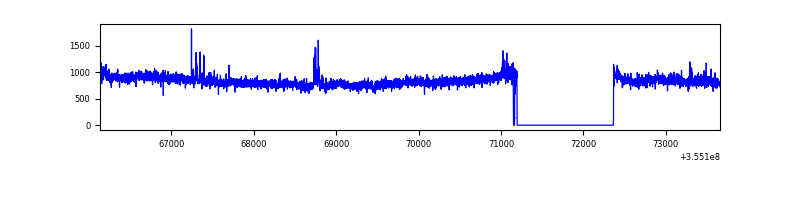 |
| C | 7521 | 6338 | 24 | 24 | 0.32% | 0.38% | 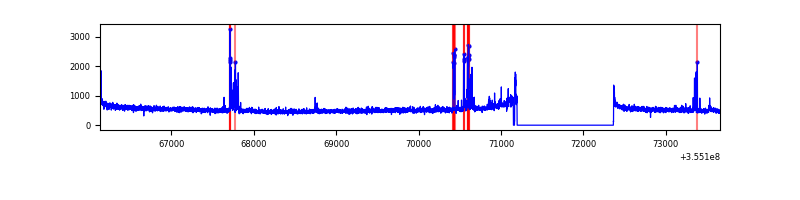 |
| D | 7521 | 6338 | 25 | 25 | 0.33% | 0.39% | 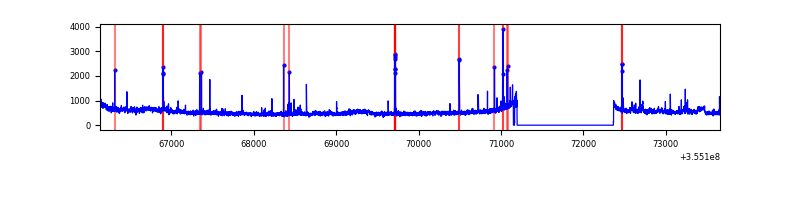 |
Top three noisy pixels from each quadrant. If the there are fewer than three noisy pixels in the level2.evt file, extra rows are filled as -1
| Pixel properties | Quadrant properties | ||||||
|---|---|---|---|---|---|---|---|
| Quadrant | DetID | PixID | Counts | Sigma | Mean | Median | Sigma |
| A | 12 | 96 | 67314 | 392.21 | 858 | 844 | 169.5 |
| A | 13 | 254 | 11925 | 65.38 | 858 | 844 | 169.5 |
| A | 3 | 137 | 7898 | 41.62 | 858 | 844 | 169.5 |
| B | 6 | 159 | 1870558 | 11951.33 | 849 | 832 | 156.4 |
| B | 0 | 190 | 43508 | 272.79 | 849 | 832 | 156.4 |
| B | 0 | 230 | 22445 | 138.15 | 849 | 832 | 156.4 |
| C | 10 | 22 | 201479 | 1091.13 | 802 | 810 | 183.9 |
| C | 14 | 238 | 136314 | 736.8 | 802 | 810 | 183.9 |
| C | 3 | 233 | 67963 | 365.14 | 802 | 810 | 183.9 |
| D | 8 | 195 | 261081 | 1372.37 | 810 | 790 | 189.7 |
| D | 12 | 79 | 73909 | 385.51 | 810 | 790 | 189.7 |
| D | 2 | 250 | 43700 | 226.24 | 810 | 790 | 189.7 |
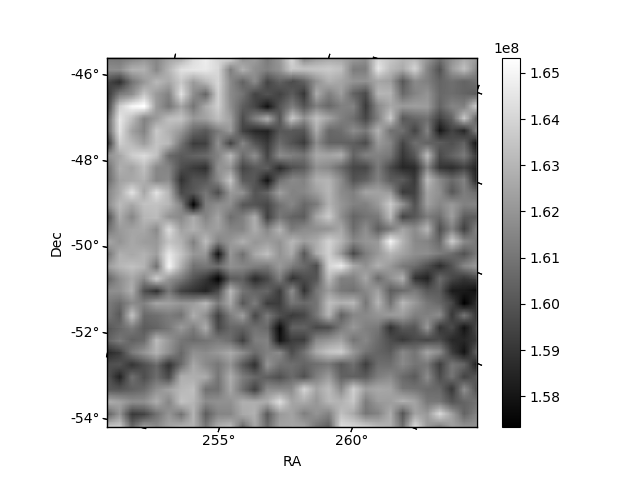
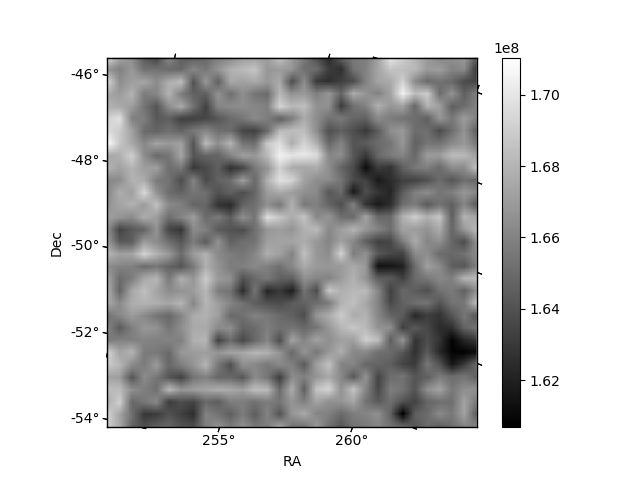
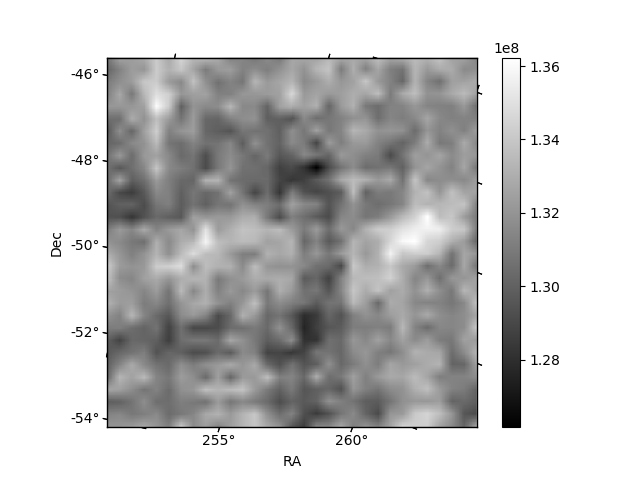
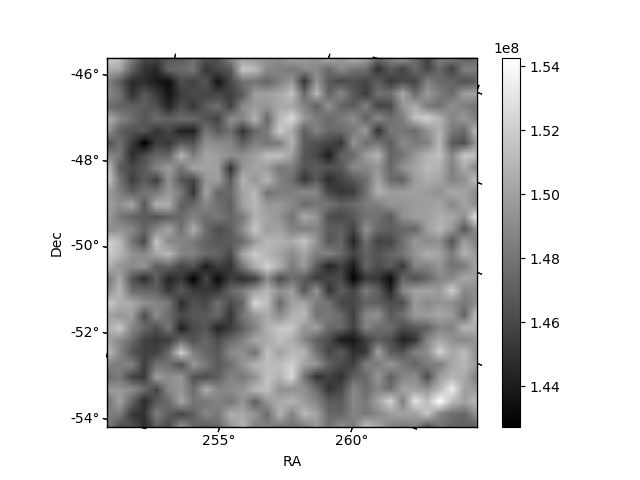
Histogram calculated using DETX and DETY for each event in the final _common_clean file
| Quadrant A |  |
 |
Quadrant B |
|---|---|---|---|
| Quadrant D |  |
 |
Quadrant C |
| Plot type | Count rate plots | Images |
|---|---|---|
| Comparison with Poisson distribution Blue bars denote a histogram of data divided into 1 sec bins. Red curve is a Poisson curve with rate = median count rate of data. |
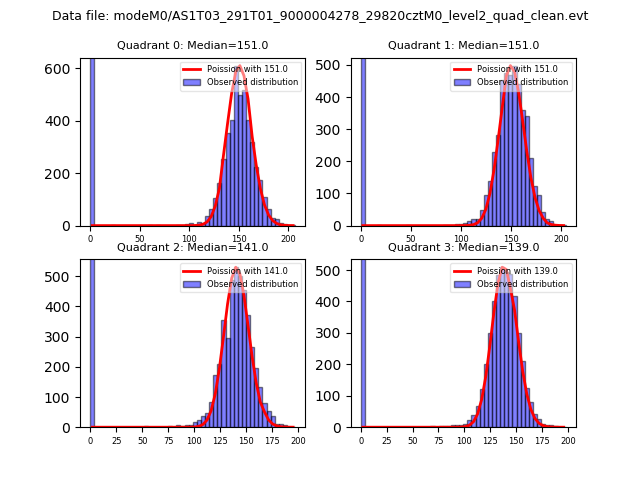 |
 |
| Quadrant-wise count rates Data is divided into 100 sec bins |
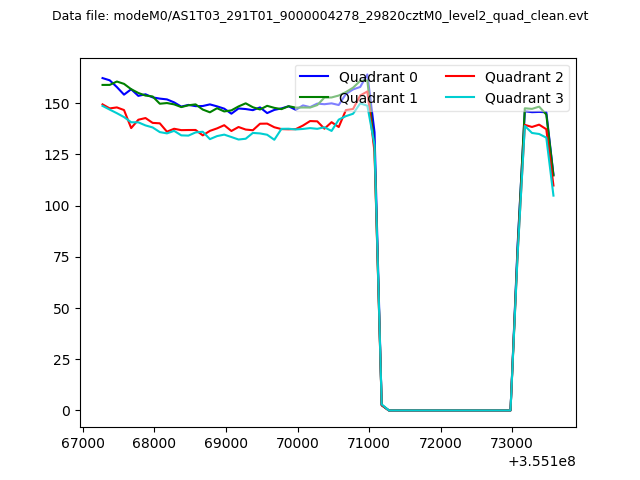 |
|
| Module-wise count rates for Quadrant A Data is divided into 100 sec bins |
 |
 |
| Module-wise count rates for Quadrant B Data is divided into 100 sec bins |
 |
 |
| Module-wise count rates for Quadrant C Data is divided into 100 sec bins |
 |
 |
| Module-wise count rates for Quadrant D Data is divided into 100 sec bins |
 |
 |
| Parameter | Plot |
|---|---|
| CZT HV Monitor |  |
| D_VDD | 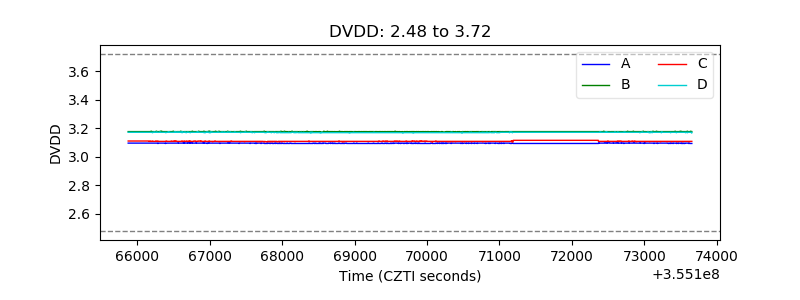 |
| Temperature 1 |  |
| Veto HV Monitor |  |
| Veto LLD |  |
| Alpha Counter |  |
| _CPM_Rate | 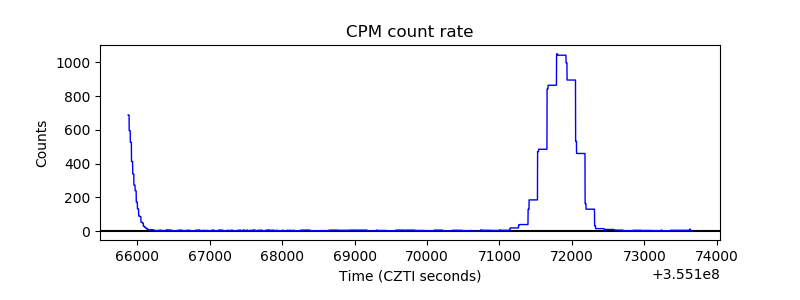 |
| CZT Counter |  |
| +2.5 Volts monitor |  |
| +5 Volts monitor |  |
| _ROLL_ROT |  |
| _Roll_DEC |  |
| _Roll_RA |  |
| Veto Counter |  |