| Param | Original file | Final file |
|---|---|---|
| Filename | modeM0/AS1T03_291T01_9000004278_29821cztM0_level2.evt | modeM0/AS1T03_291T01_9000004278_29821cztM0_level2_quad_clean.evt |
| Size (bytes) | 552,208,320 | 104,374,080 |
| Size | 526.6 MB | 99.5 MB |
| Events in quadrant A | 3,395,016 | 696,211 |
| Events in quadrant B | 5,469,689 | 695,174 |
| Events in quadrant C | 3,519,304 | 655,184 |
| Events in quadrant D | 3,879,570 | 641,263 |
| Mode SS | |||
|---|---|---|---|
| Quadrant | BADHDUFLAG | Total packets | Discarded packets |
| A | 0 | 140 | 0 |
| B | 0 | 140 | 0 |
| C | 0 | 140 | 0 |
| D | 0 | 140 | 0 |
| Mode M0 | |||
|---|---|---|---|
| Quadrant | BADHDUFLAG | Total packets | Discarded packets |
| A | 0 | 14310 | 6 |
| B | 0 | 20784 | 3 |
| C | 0 | 14578 | 3 |
| D | 0 | 15901 | 4 |
| Mode M9 | |||
|---|---|---|---|
| Quadrant | BADHDUFLAG | Total packets | Discarded packets |
| A | 0 | 20 | 0 |
| B | 0 | 20 | 0 |
| C | 0 | 20 | 0 |
| D | 0 | 20 | 0 |
| Quadrant | Total seconds | Saturated seconds | Saturation percentage |
|---|---|---|---|
| A | 6787 | 109 | 1.606011% |
| B | 6790 | 211 | 3.107511% |
| C | 6790 | 159 | 2.341679% |
| D | 6789 | 94 | 1.384593% |
Noise dominated data is calculated using 1-second bins in cleaned event files. If a bin has >2000 counts, and if more than 50% of those come from <1% of pixels, then it is considered to be noise-dominated and hence unusable.
| Quadrant | # 1 sec bins | Bins with >0 counts | Bins with >2000 counts | High rate bins dominated by noise | Noise dominated (total time) | Noise dominated (detector-on time) | Marked lightcurve |
|---|---|---|---|---|---|---|---|
| A | 8854 | 6793 | 4 | 4 | 0.05% | 0.06% | 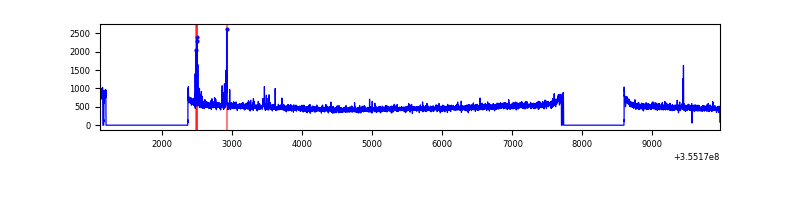 |
| B | 8855 | 6794 | 1 | 1 | 0.01% | 0.01% | 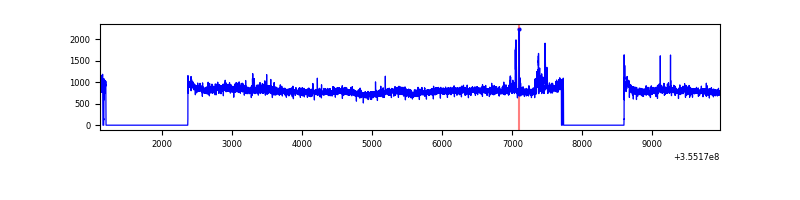 |
| C | 8855 | 6794 | 11 | 11 | 0.12% | 0.16% | 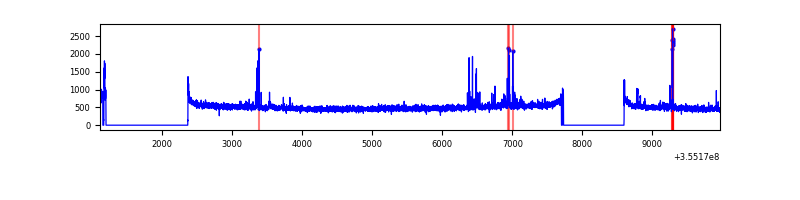 |
| D | 8855 | 6794 | 19 | 19 | 0.21% | 0.28% | 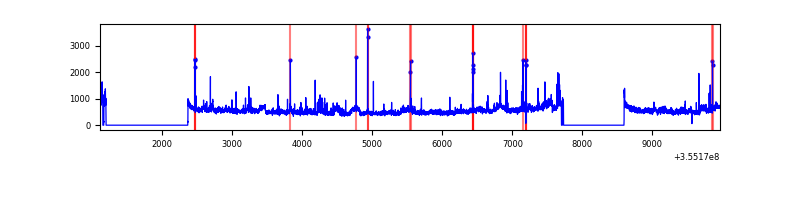 |
Top three noisy pixels from each quadrant. If the there are fewer than three noisy pixels in the level2.evt file, extra rows are filled as -1
| Pixel properties | Quadrant properties | ||||||
|---|---|---|---|---|---|---|---|
| Quadrant | DetID | PixID | Counts | Sigma | Mean | Median | Sigma |
| A | 12 | 96 | 51896 | 296.29 | 866 | 849 | 172.3 |
| A | 13 | 254 | 12538 | 67.85 | 866 | 849 | 172.3 |
| A | 3 | 137 | 8345 | 43.51 | 866 | 849 | 172.3 |
| B | 6 | 159 | 2005672 | 12455.35 | 858 | 838 | 161.0 |
| B | 0 | 190 | 75985 | 466.86 | 858 | 838 | 161.0 |
| B | 12 | 111 | 19275 | 114.54 | 858 | 838 | 161.0 |
| C | 14 | 238 | 136084 | 706.84 | 821 | 825 | 191.4 |
| C | 10 | 22 | 110480 | 573.04 | 821 | 825 | 191.4 |
| C | 3 | 233 | 58651 | 302.19 | 821 | 825 | 191.4 |
| D | 8 | 195 | 487328 | 2515.48 | 824 | 804 | 193.4 |
| D | 2 | 250 | 85577 | 438.3 | 824 | 804 | 193.4 |
| D | 7 | 223 | 75663 | 387.04 | 824 | 804 | 193.4 |
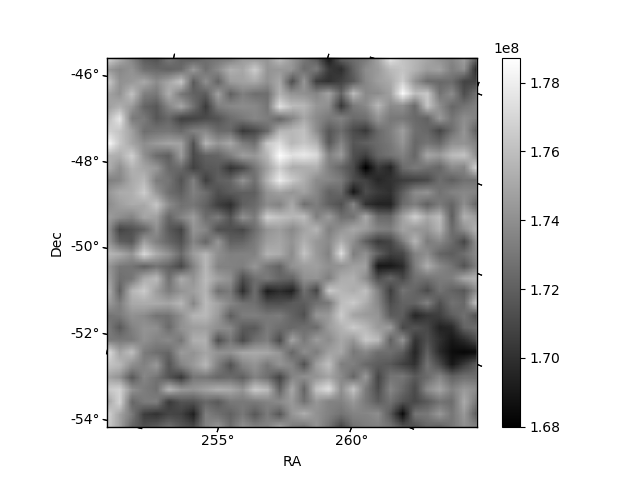
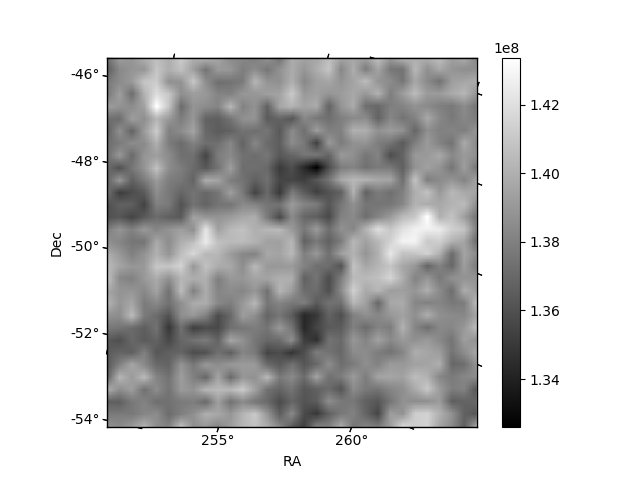
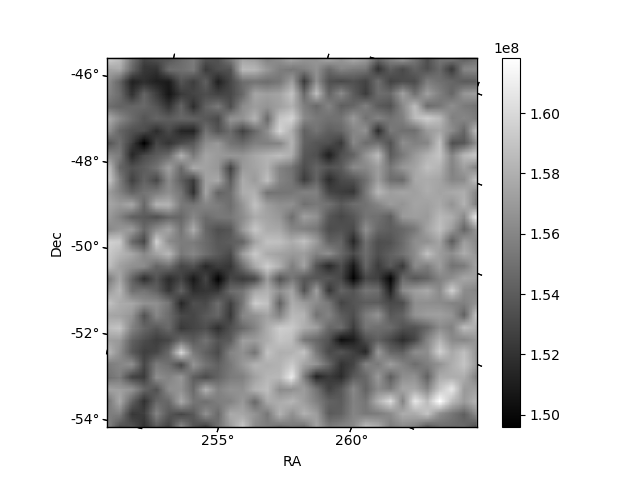
Histogram calculated using DETX and DETY for each event in the final _common_clean file
| Quadrant A | 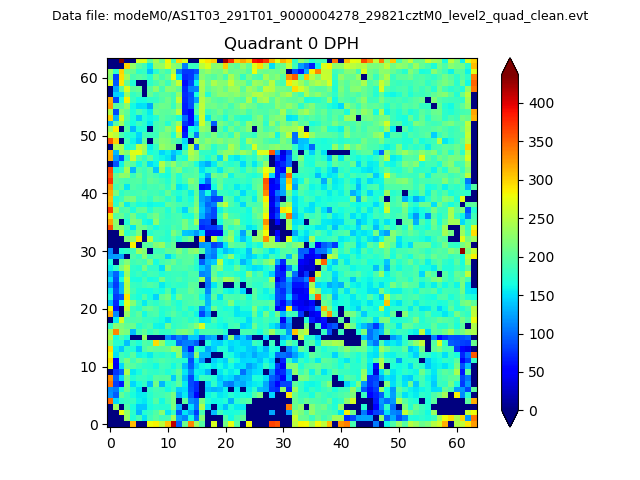 |
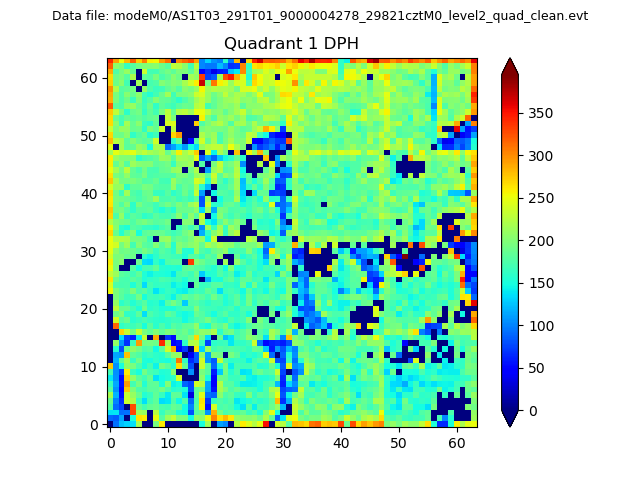 |
Quadrant B |
|---|---|---|---|
| Quadrant D | 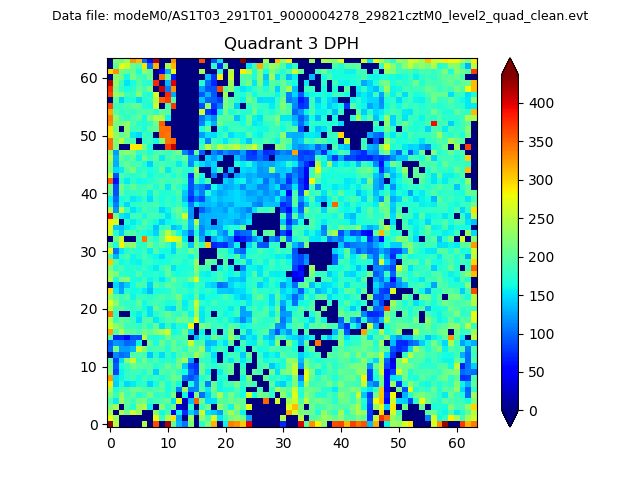 |
 |
Quadrant C |
| Plot type | Count rate plots | Images |
|---|---|---|
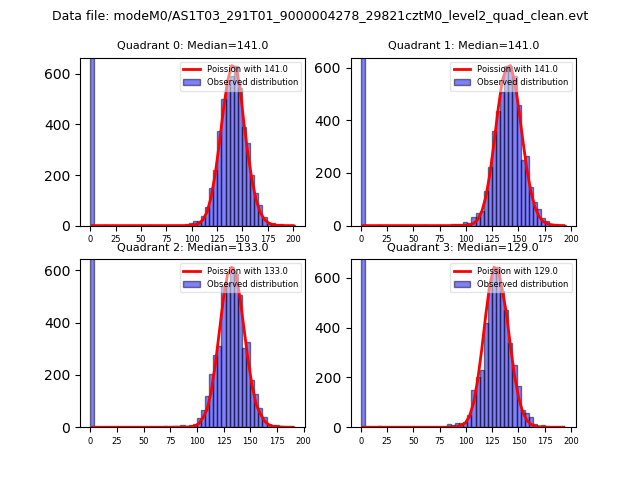
| Comparison with Poisson distribution Blue bars denote a histogram of data divided into 1 sec bins. Red curve is a Poisson curve with rate = median count rate of data. |
 |
 |
| Quadrant-wise count rates Data is divided into 100 sec bins |
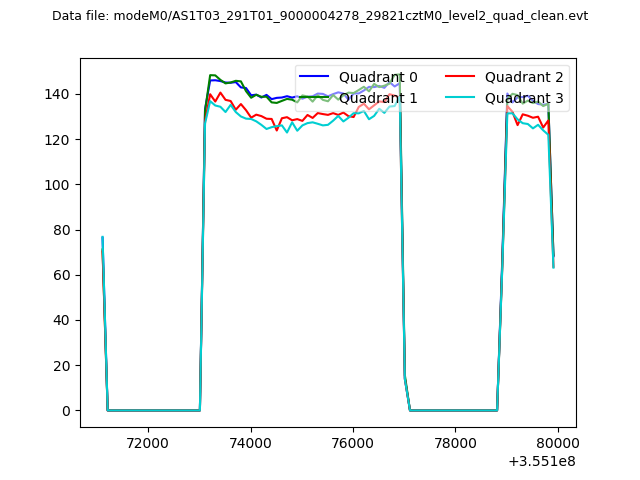 |
|
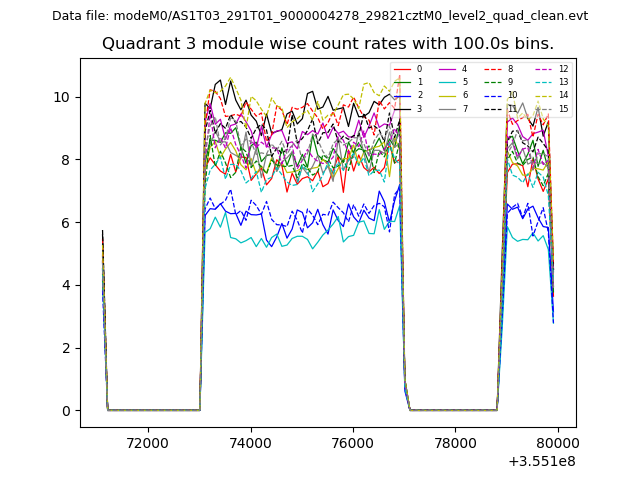
| Module-wise count rates for Quadrant A Data is divided into 100 sec bins |
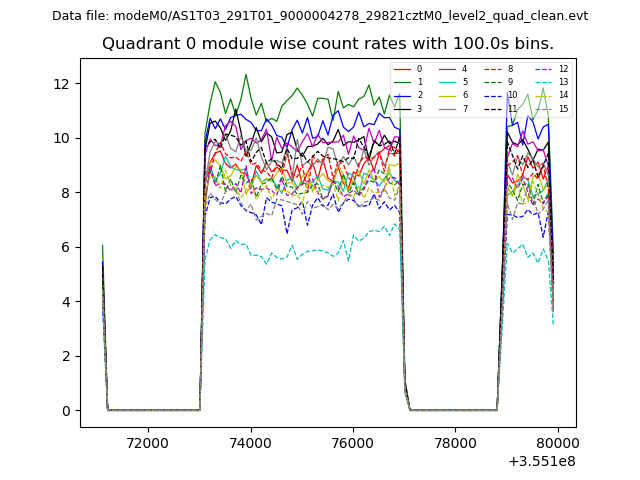 |
 |
| Module-wise count rates for Quadrant B Data is divided into 100 sec bins |
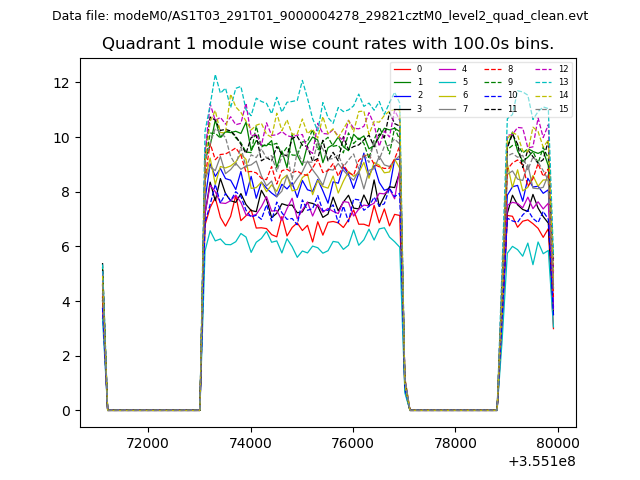 |
 |
| Module-wise count rates for Quadrant C Data is divided into 100 sec bins |
 |
 |
| Module-wise count rates for Quadrant D Data is divided into 100 sec bins |
 |
 |
| Parameter | Plot |
|---|---|
| CZT HV Monitor | 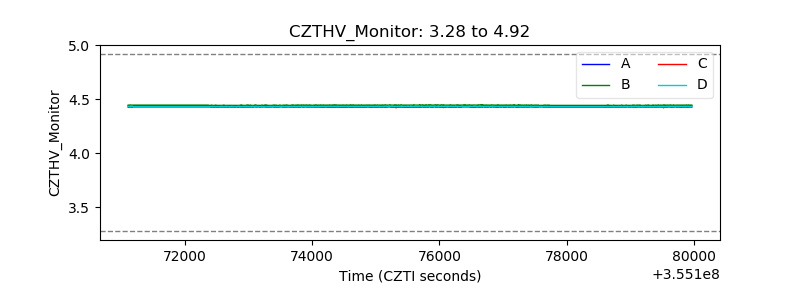 |
| D_VDD | 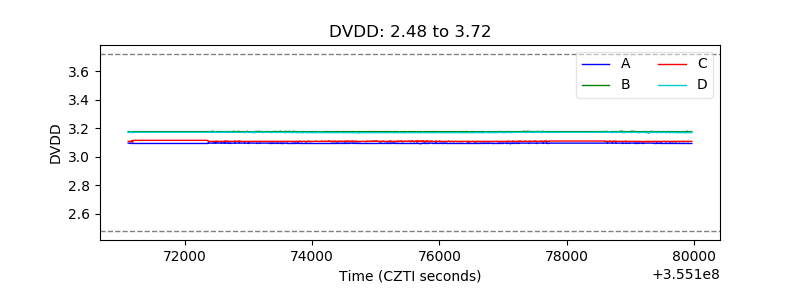 |
| Temperature 1 | 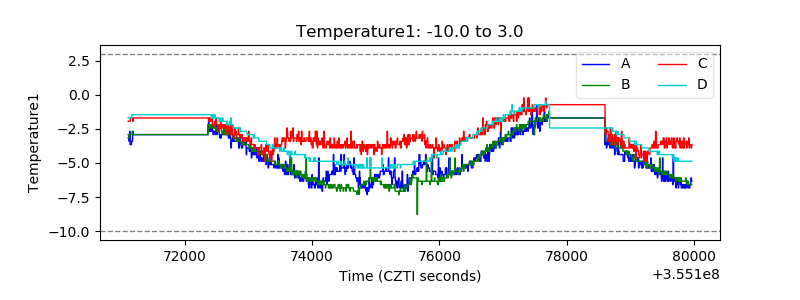 |
| Veto HV Monitor | 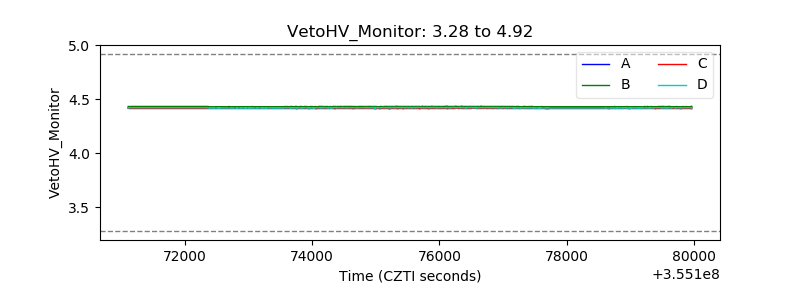 |
| Veto LLD | 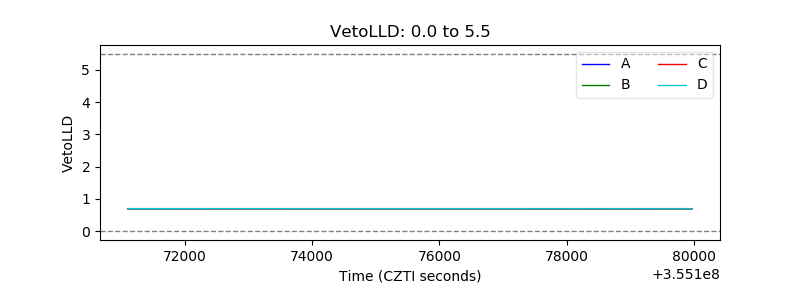 |
| Alpha Counter |  |
| _CPM_Rate | 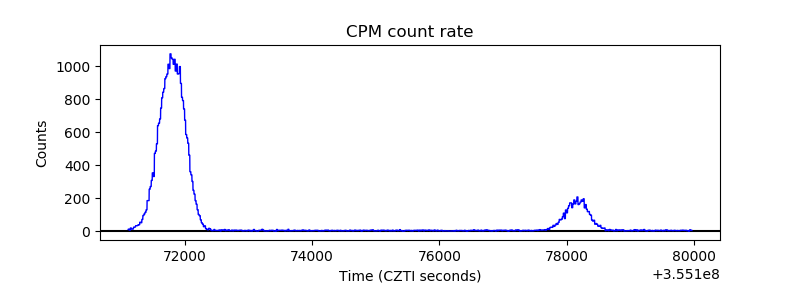 |
| CZT Counter | 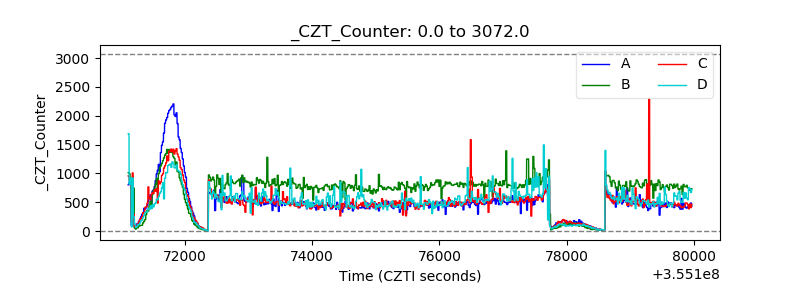 |
| +2.5 Volts monitor | 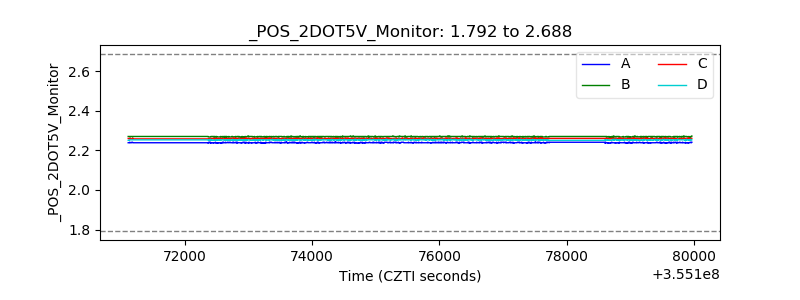 |
| +5 Volts monitor |  |
| _ROLL_ROT | 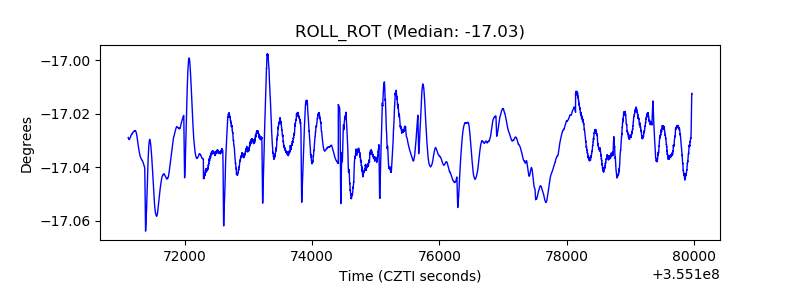 |
| _Roll_DEC | 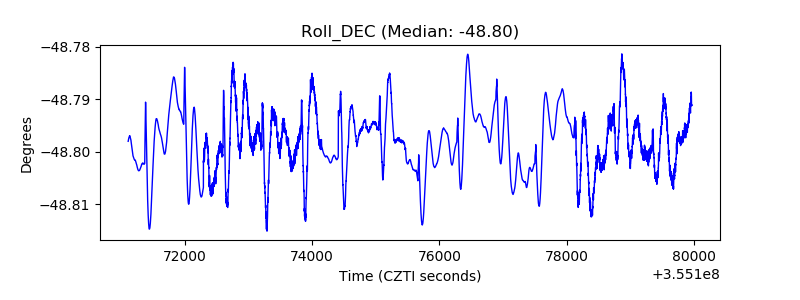 |
| _Roll_RA | 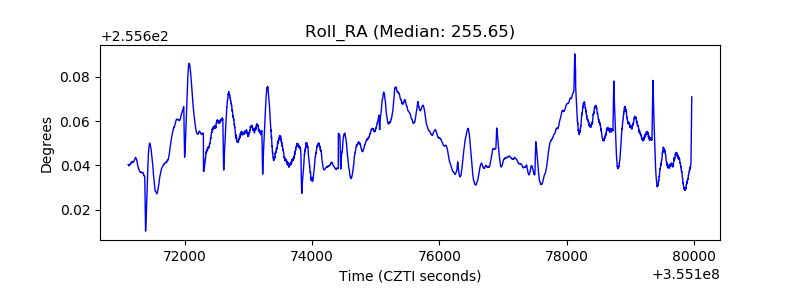 |
| Veto Counter | 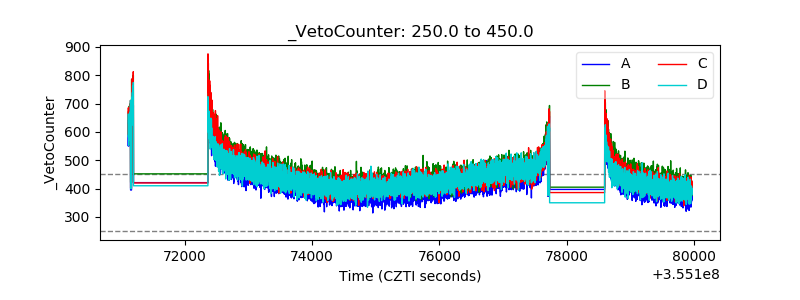 |