| Param | Original file | Final file |
|---|---|---|
| Filename | modeM0/AS1T03_291T01_9000004278_29822cztM0_level2.evt | modeM0/AS1T03_291T01_9000004278_29822cztM0_level2_quad_clean.evt |
| Size (bytes) | 571,095,360 | 108,221,760 |
| Size | 544.6 MB | 103.2 MB |
| Events in quadrant A | 3,484,002 | 716,487 |
| Events in quadrant B | 5,725,805 | 716,451 |
| Events in quadrant C | 3,594,767 | 678,340 |
| Events in quadrant D | 4,001,894 | 663,573 |
| Mode SS | |||
|---|---|---|---|
| Quadrant | BADHDUFLAG | Total packets | Discarded packets |
| A | 0 | 146 | 0 |
| B | 0 | 146 | 0 |
| C | 0 | 146 | 0 |
| D | 0 | 146 | 0 |
| Mode M0 | |||
|---|---|---|---|
| Quadrant | BADHDUFLAG | Total packets | Discarded packets |
| A | 0 | 14942 | 2 |
| B | 0 | 22095 | 2 |
| C | 0 | 15168 | 3 |
| D | 0 | 16467 | 3 |
| Mode M9 | |||
|---|---|---|---|
| Quadrant | BADHDUFLAG | Total packets | Discarded packets |
| A | 0 | 5 | 0 |
| B | 0 | 6 | 0 |
| C | 0 | 6 | 0 |
| D | 0 | 6 | 0 |
| Quadrant | Total seconds | Saturated seconds | Saturation percentage |
|---|---|---|---|
| A | 7223 | 23 | 0.318427% |
| B | 7224 | 149 | 2.062569% |
| C | 7223 | 88 | 1.218330% |
| D | 7222 | 43 | 0.595403% |
Noise dominated data is calculated using 1-second bins in cleaned event files. If a bin has >2000 counts, and if more than 50% of those come from <1% of pixels, then it is considered to be noise-dominated and hence unusable.
| Quadrant | # 1 sec bins | Bins with >0 counts | Bins with >2000 counts | High rate bins dominated by noise | Noise dominated (total time) | Noise dominated (detector-on time) | Marked lightcurve |
|---|---|---|---|---|---|---|---|
| A | 7654 | 7225 | 2 | 2 | 0.03% | 0.03% | 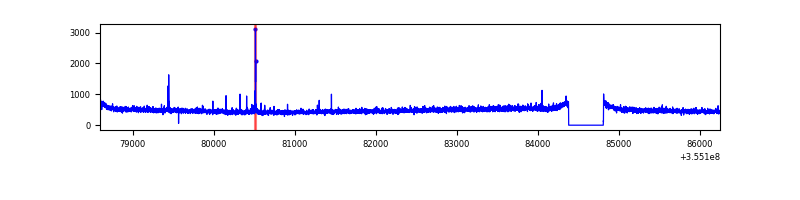 |
| B | 7654 | 7225 | 2 | 2 | 0.03% | 0.03% | 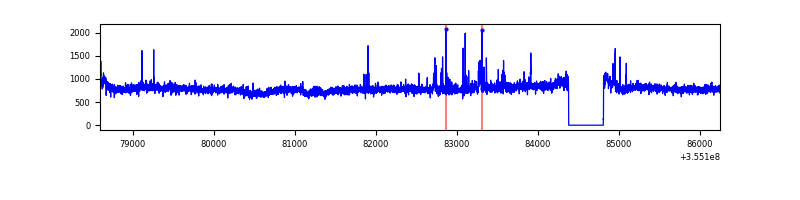 |
| C | 7653 | 7224 | 11 | 11 | 0.14% | 0.15% | 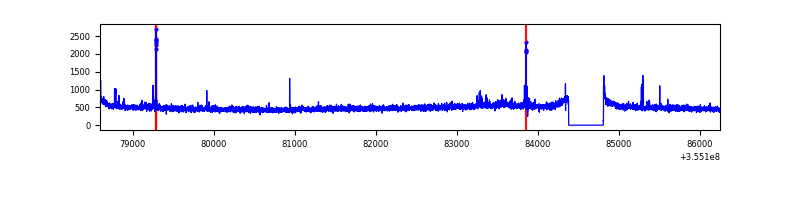 |
| D | 7653 | 7224 | 17 | 17 | 0.22% | 0.24% | 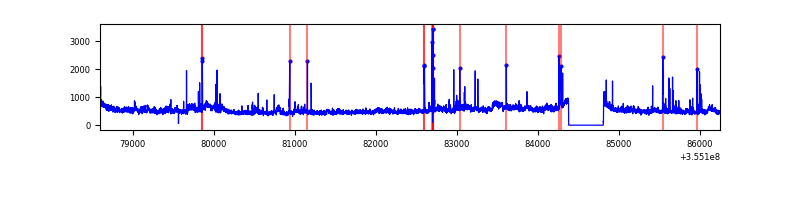 |
Top three noisy pixels from each quadrant. If the there are fewer than three noisy pixels in the level2.evt file, extra rows are filled as -1
| Pixel properties | Quadrant properties | ||||||
|---|---|---|---|---|---|---|---|
| Quadrant | DetID | PixID | Counts | Sigma | Mean | Median | Sigma |
| A | 12 | 96 | 33341 | 181.91 | 892 | 876 | 178.5 |
| A | 13 | 254 | 13519 | 70.84 | 892 | 876 | 178.5 |
| A | 3 | 137 | 8854 | 44.7 | 892 | 876 | 178.5 |
| B | 6 | 159 | 2134706 | 12777.13 | 884 | 865 | 167.0 |
| B | 0 | 190 | 81199 | 481.03 | 884 | 865 | 167.0 |
| B | 3 | 209 | 27755 | 161.01 | 884 | 865 | 167.0 |
| C | 14 | 238 | 139769 | 692.87 | 850 | 855 | 200.5 |
| C | 3 | 233 | 73008 | 359.88 | 850 | 855 | 200.5 |
| C | 10 | 22 | 29189 | 141.32 | 850 | 855 | 200.5 |
| D | 8 | 195 | 551023 | 2717.28 | 853 | 831 | 202.5 |
| D | 2 | 250 | 72196 | 352.46 | 853 | 831 | 202.5 |
| D | 13 | 104 | 35808 | 172.74 | 853 | 831 | 202.5 |
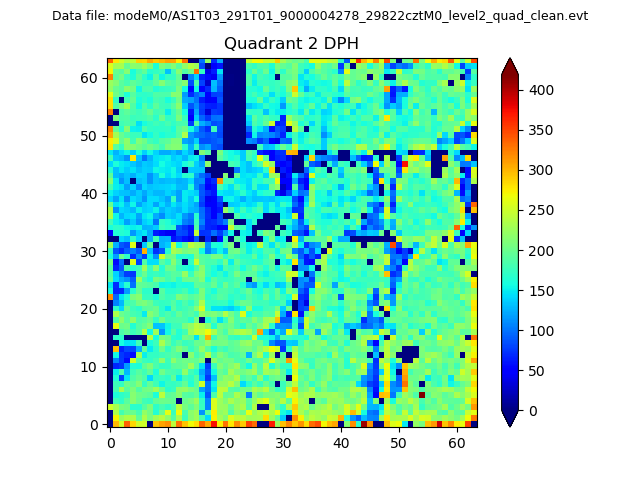
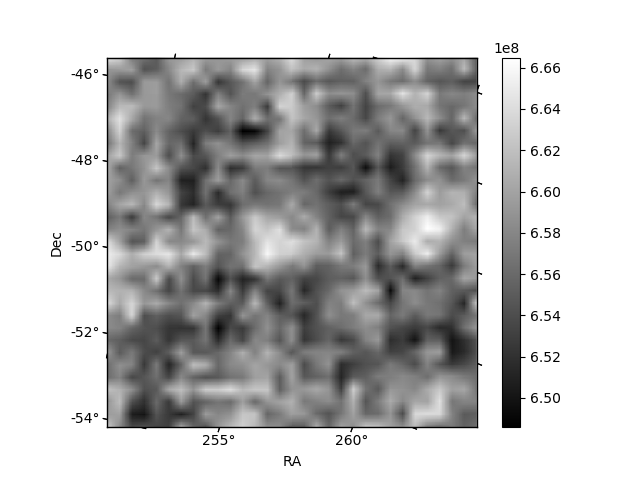
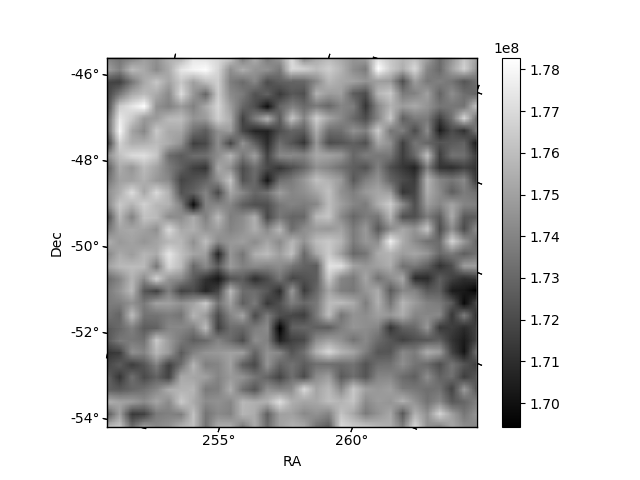
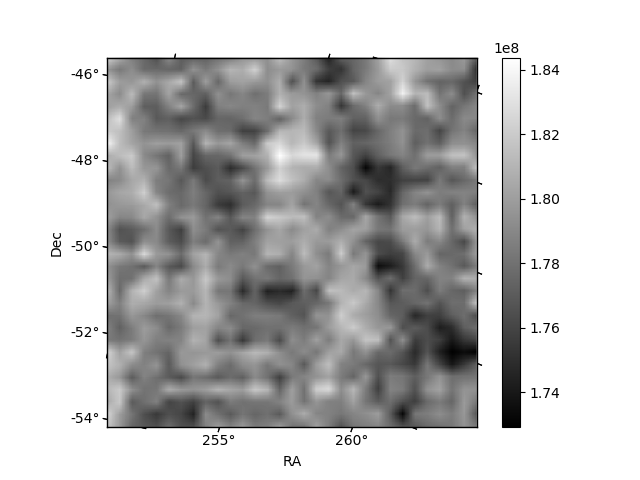
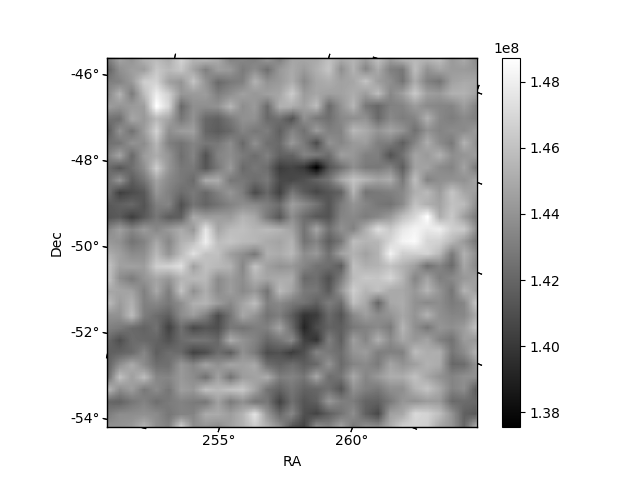
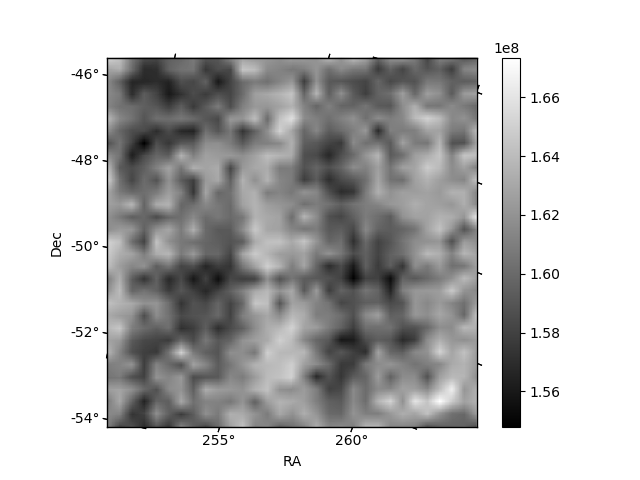
Histogram calculated using DETX and DETY for each event in the final _common_clean file
| Quadrant A | 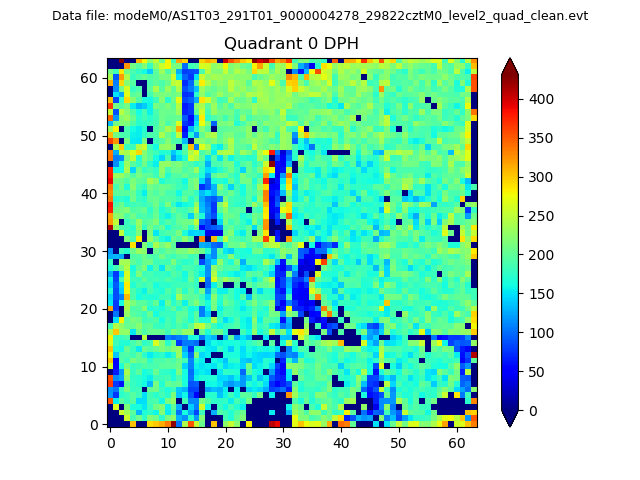 |
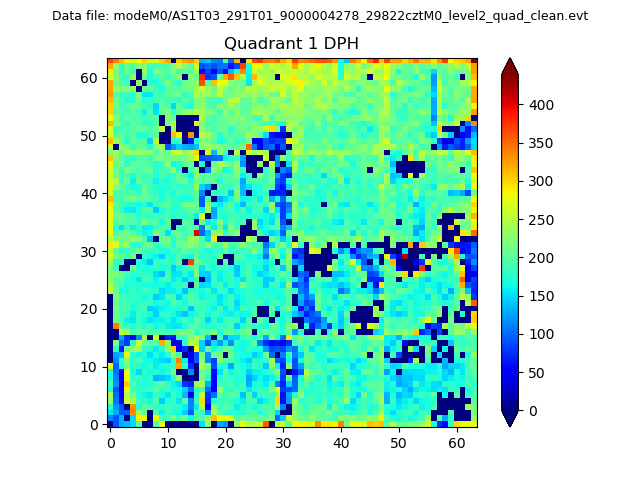 |
Quadrant B |
|---|---|---|---|
| Quadrant D | 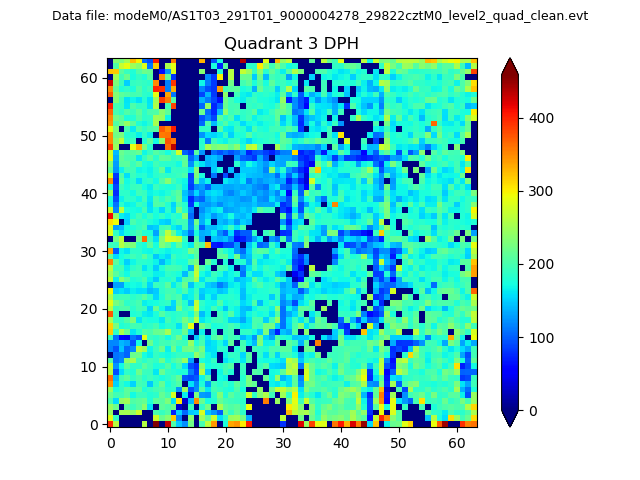 |
 |
Quadrant C |
| Plot type | Count rate plots | Images |
|---|---|---|
| Comparison with Poisson distribution Blue bars denote a histogram of data divided into 1 sec bins. Red curve is a Poisson curve with rate = median count rate of data. |
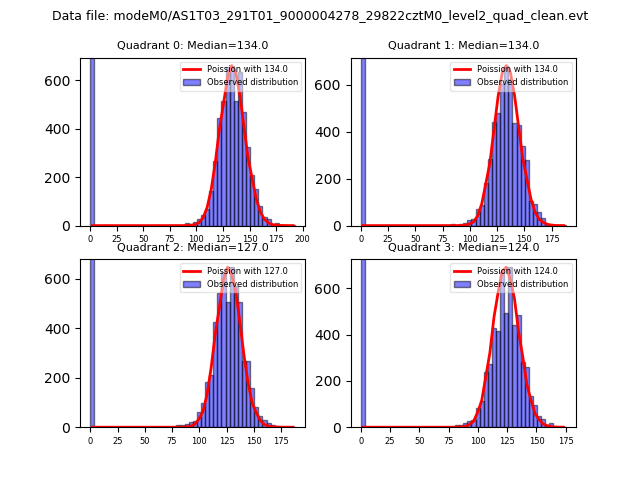 |
 |
| Quadrant-wise count rates Data is divided into 100 sec bins |
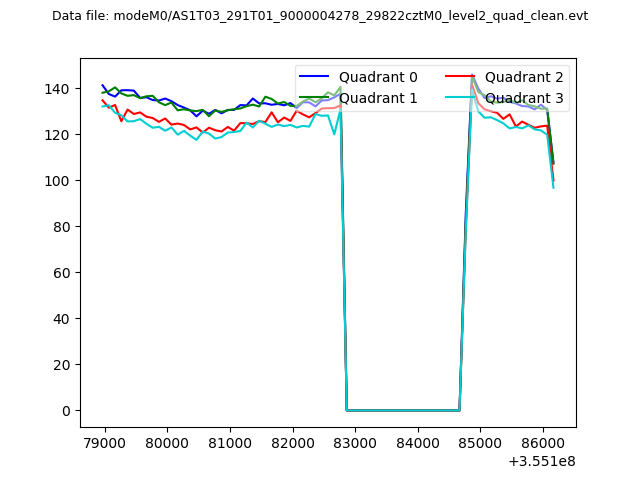 |
|
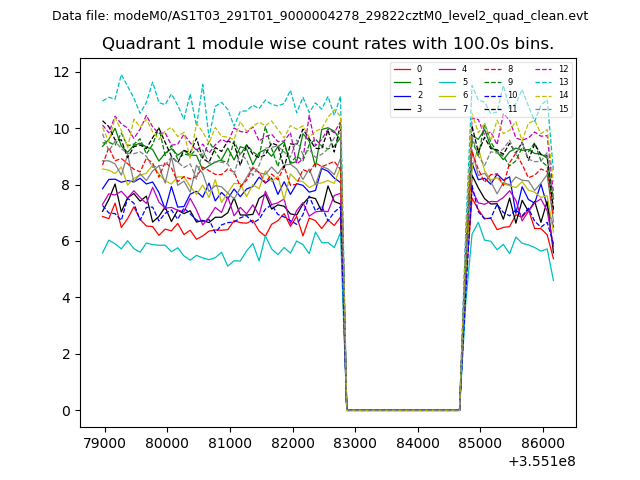
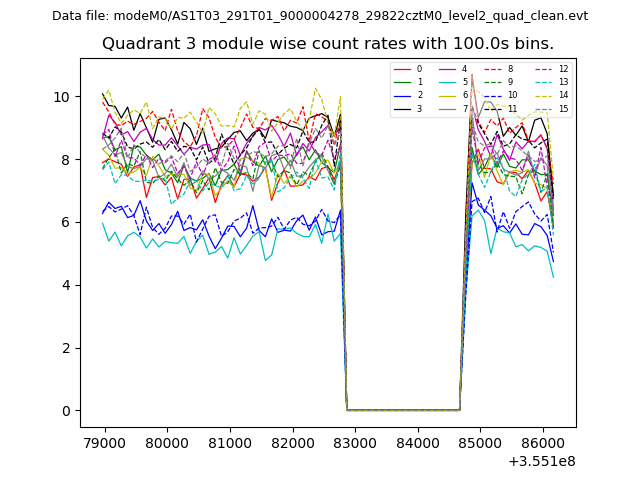
| Module-wise count rates for Quadrant A Data is divided into 100 sec bins |
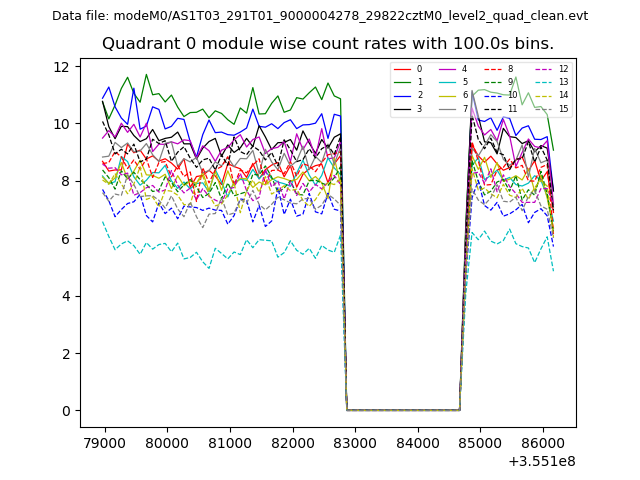 |
 |
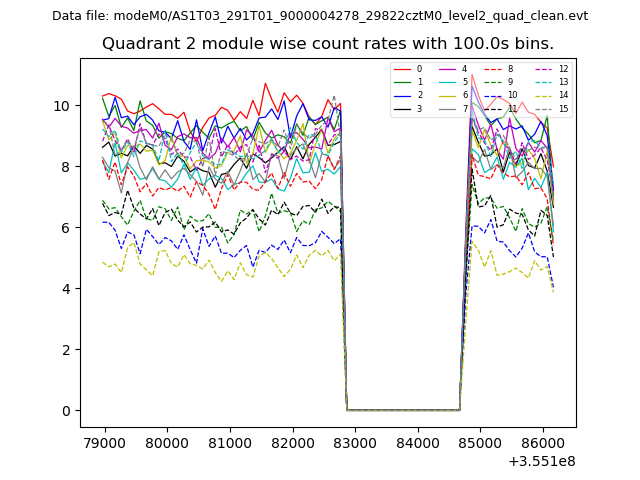
| Module-wise count rates for Quadrant B Data is divided into 100 sec bins |
 |
 |
| Module-wise count rates for Quadrant C Data is divided into 100 sec bins |
 |
 |
| Module-wise count rates for Quadrant D Data is divided into 100 sec bins |
 |
 |
| Parameter | Plot |
|---|---|
| CZT HV Monitor | 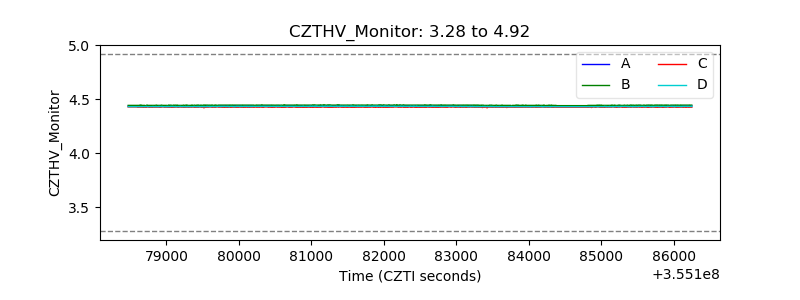 |
| D_VDD | 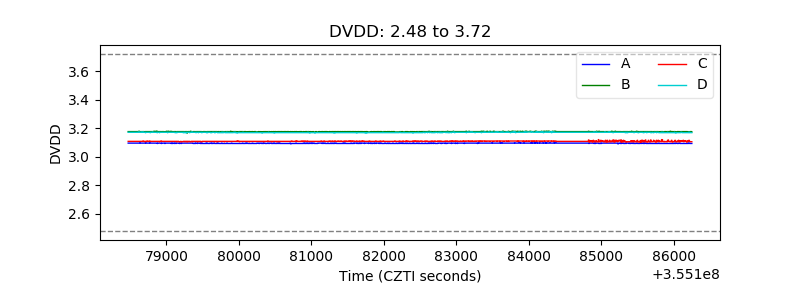 |
| Temperature 1 | 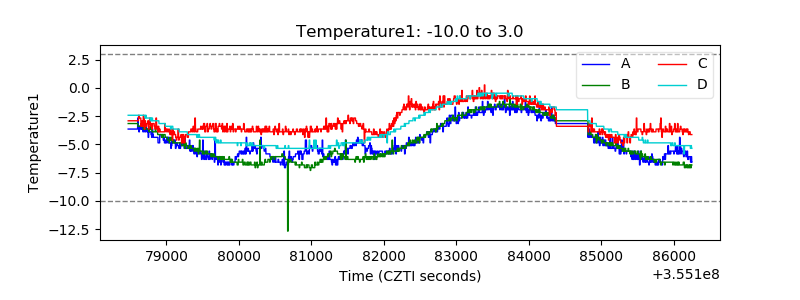 |
| Veto HV Monitor |  |
| Veto LLD |  |
| Alpha Counter | 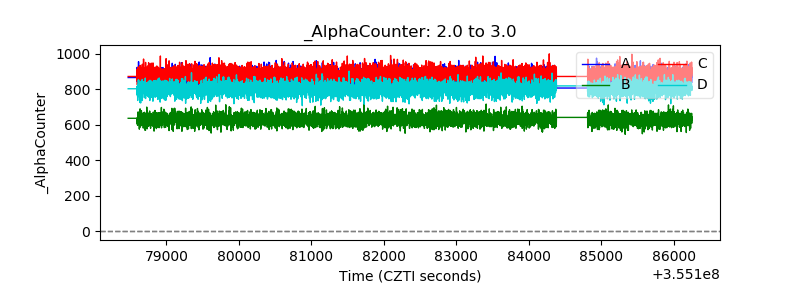 |
| _CPM_Rate |  |
| CZT Counter | 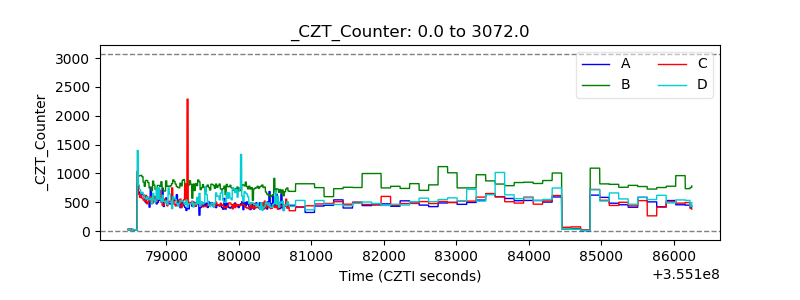 |
| +2.5 Volts monitor | 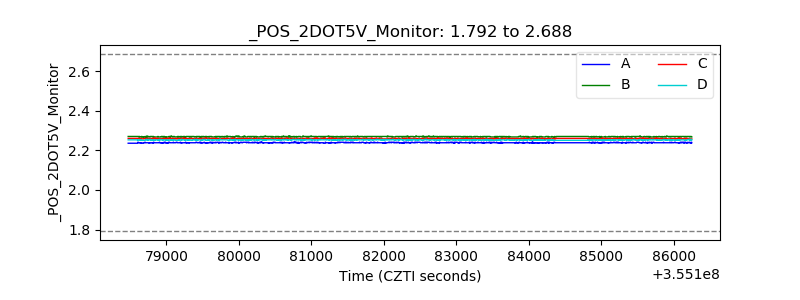 |
| +5 Volts monitor |  |
| _ROLL_ROT | 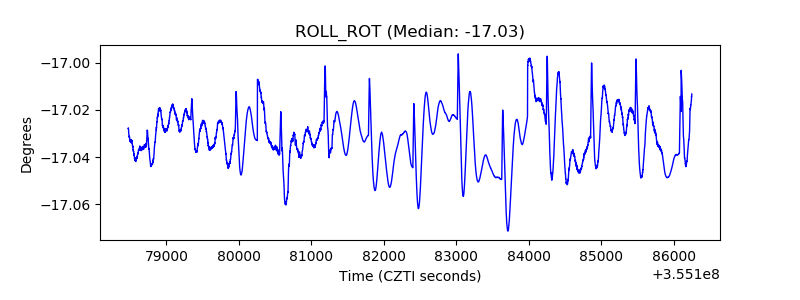 |
| _Roll_DEC | 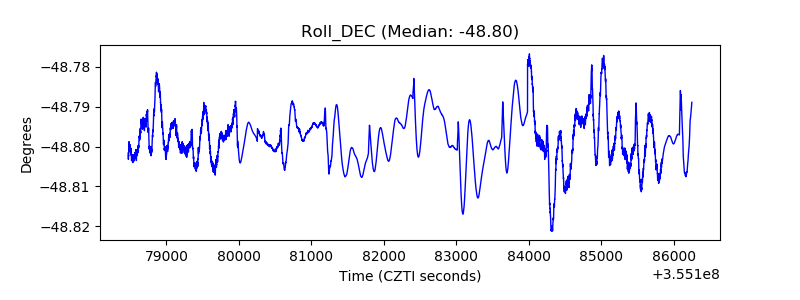 |
| _Roll_RA | 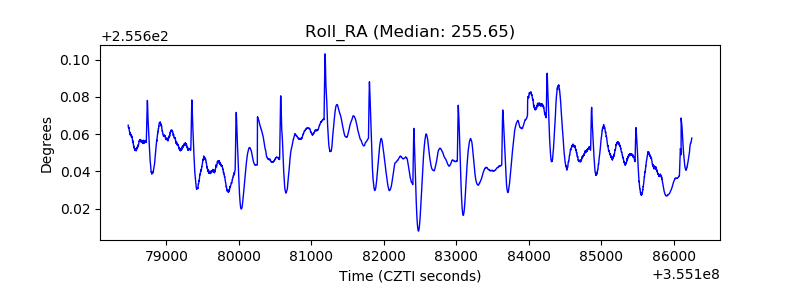 |
| Veto Counter | 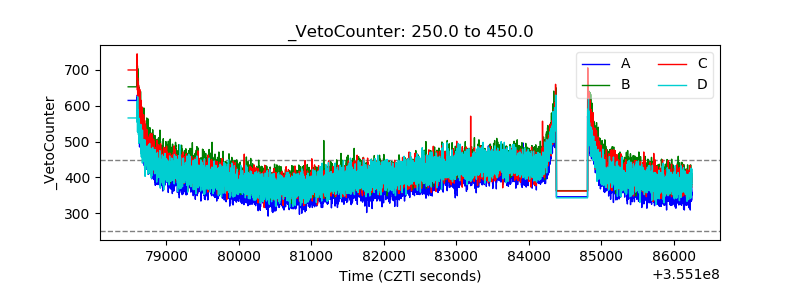 |