| Param | Original file | Final file |
|---|---|---|
| Filename | modeM0/AS1T03_291T01_9000004278_29823cztM0_level2.evt | modeM0/AS1T03_291T01_9000004278_29823cztM0_level2_quad_clean.evt |
| Size (bytes) | 654,477,120 | 116,979,840 |
| Size | 624.2 MB | 111.6 MB |
| Events in quadrant A | 3,990,399 | 766,549 |
| Events in quadrant B | 6,677,071 | 762,753 |
| Events in quadrant C | 4,096,275 | 727,094 |
| Events in quadrant D | 4,496,774 | 711,209 |
| Mode SS | |||
|---|---|---|---|
| Quadrant | BADHDUFLAG | Total packets | Discarded packets |
| A | 0 | 170 | 0 |
| B | 0 | 170 | 0 |
| C | 0 | 170 | 0 |
| D | 0 | 170 | 0 |
| Mode M0 | |||
|---|---|---|---|
| Quadrant | BADHDUFLAG | Total packets | Discarded packets |
| A | 0 | 17195 | 3 |
| B | 0 | 25632 | 3 |
| C | 0 | 17302 | 3 |
| D | 0 | 18660 | 3 |
| Mode M9 | |||
|---|---|---|---|
| Quadrant | BADHDUFLAG | Total packets | Discarded packets |
| A | 0 | 5 | 0 |
| B | 0 | 5 | 0 |
| C | 0 | 5 | 0 |
| D | 0 | 5 | 0 |
| Quadrant | Total seconds | Saturated seconds | Saturation percentage |
|---|---|---|---|
| A | 8276 | 40 | 0.483325% |
| B | 8276 | 288 | 3.479942% |
| C | 8277 | 171 | 2.065966% |
| D | 8277 | 69 | 0.833635% |
Noise dominated data is calculated using 1-second bins in cleaned event files. If a bin has >2000 counts, and if more than 50% of those come from <1% of pixels, then it is considered to be noise-dominated and hence unusable.
| Quadrant | # 1 sec bins | Bins with >0 counts | Bins with >2000 counts | High rate bins dominated by noise | Noise dominated (total time) | Noise dominated (detector-on time) | Marked lightcurve |
|---|---|---|---|---|---|---|---|
| A | 8806 | 8279 | 0 | 0 | 0.00% | 0.00% | 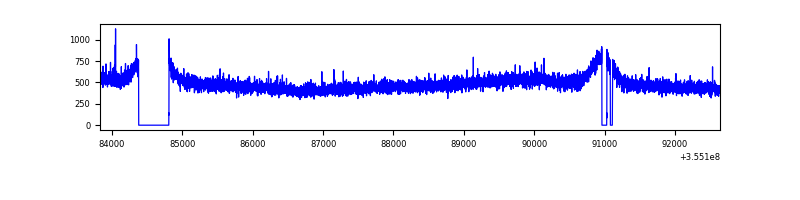 |
| B | 8806 | 8279 | 12 | 12 | 0.14% | 0.14% | 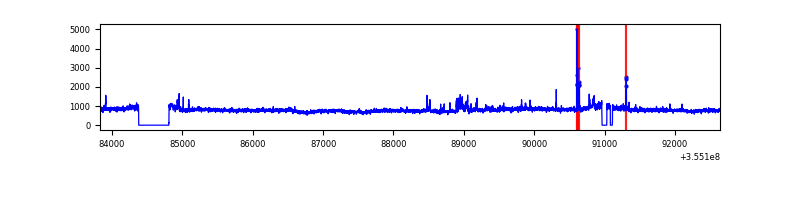 |
| C | 8807 | 8280 | 5 | 5 | 0.06% | 0.06% | 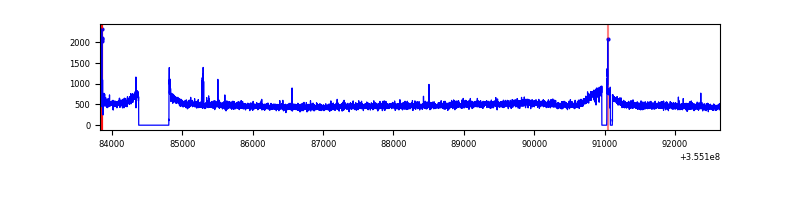 |
| D | 8807 | 8280 | 14 | 14 | 0.16% | 0.17% | 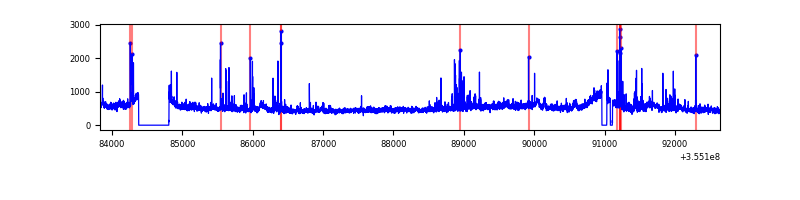 |
Top three noisy pixels from each quadrant. If the there are fewer than three noisy pixels in the level2.evt file, extra rows are filled as -1
| Pixel properties | Quadrant properties | ||||||
|---|---|---|---|---|---|---|---|
| Quadrant | DetID | PixID | Counts | Sigma | Mean | Median | Sigma |
| A | 13 | 254 | 15504 | 70.28 | 1031 | 1008 | 206.3 |
| A | 3 | 137 | 10288 | 44.99 | 1031 | 1008 | 206.3 |
| A | 0 | 226 | 8671 | 37.15 | 1031 | 1008 | 206.3 |
| B | 6 | 159 | 2472867 | 12642.74 | 1020 | 995 | 195.5 |
| B | 0 | 190 | 125009 | 634.29 | 1020 | 995 | 195.5 |
| B | 4 | 171 | 34663 | 172.2 | 1020 | 995 | 195.5 |
| C | 14 | 238 | 158511 | 677.8 | 987 | 991 | 232.4 |
| C | 3 | 233 | 36118 | 151.15 | 987 | 991 | 232.4 |
| C | 2 | 114 | 20222 | 82.75 | 987 | 991 | 232.4 |
| D | 8 | 195 | 469920 | 1982.93 | 989 | 961 | 236.5 |
| D | 13 | 104 | 101130 | 423.55 | 989 | 961 | 236.5 |
| D | 2 | 250 | 78630 | 328.41 | 989 | 961 | 236.5 |
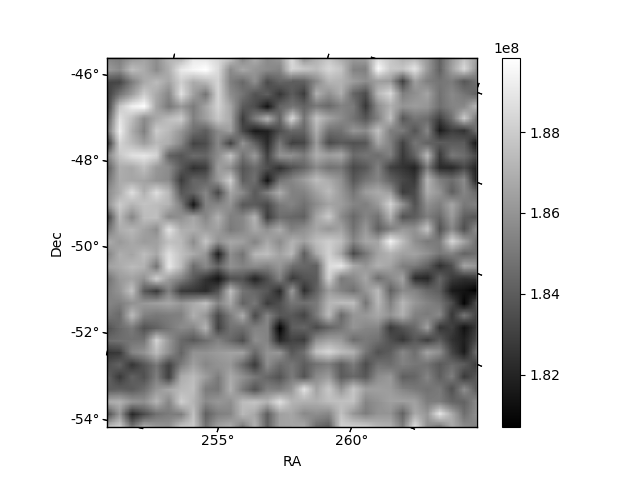
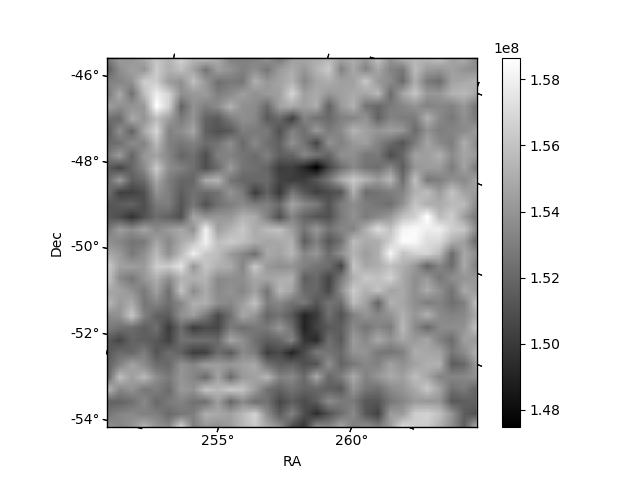
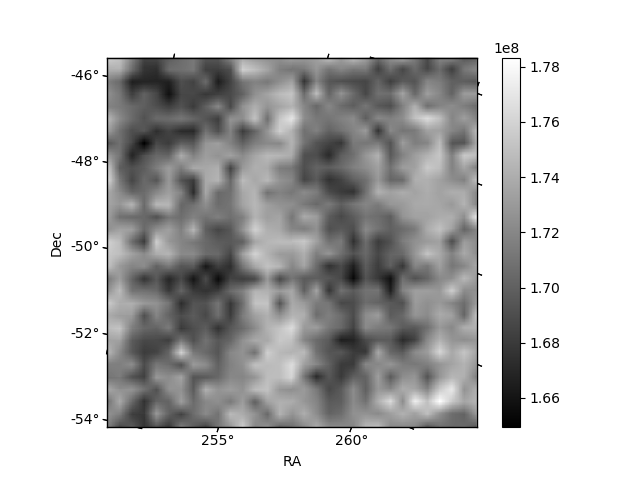
Histogram calculated using DETX and DETY for each event in the final _common_clean file
| Quadrant A | 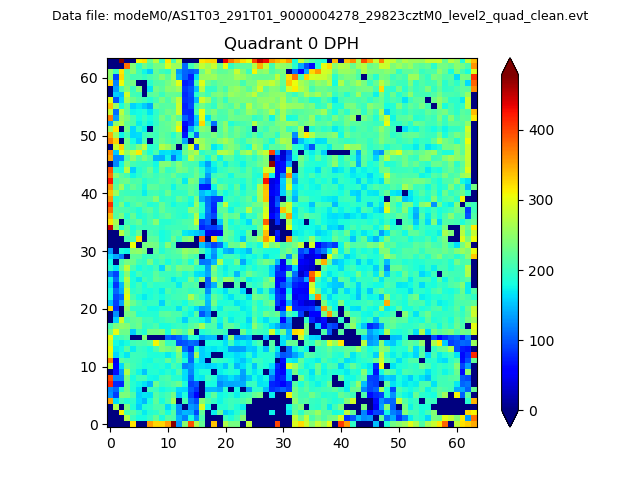 |
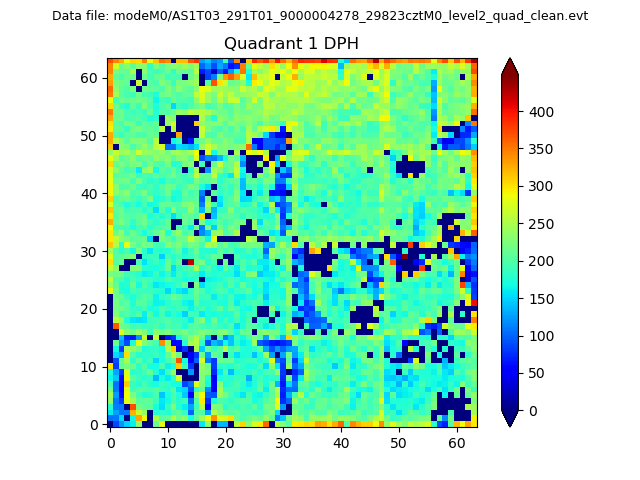 |
Quadrant B |
|---|---|---|---|
| Quadrant D | 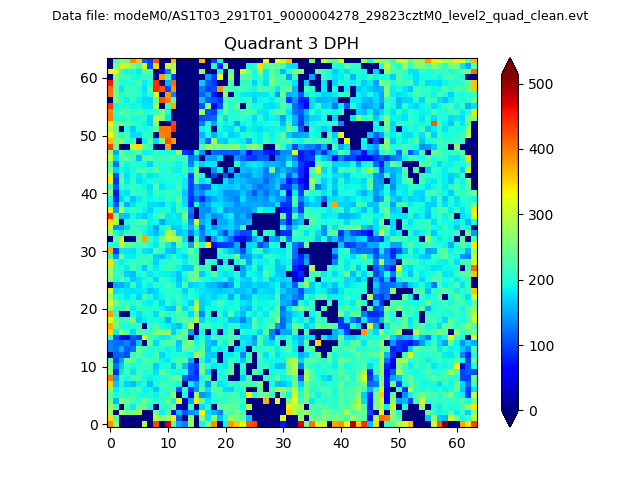 |
 |
Quadrant C |
| Plot type | Count rate plots | Images |
|---|---|---|
| Comparison with Poisson distribution Blue bars denote a histogram of data divided into 1 sec bins. Red curve is a Poisson curve with rate = median count rate of data. |
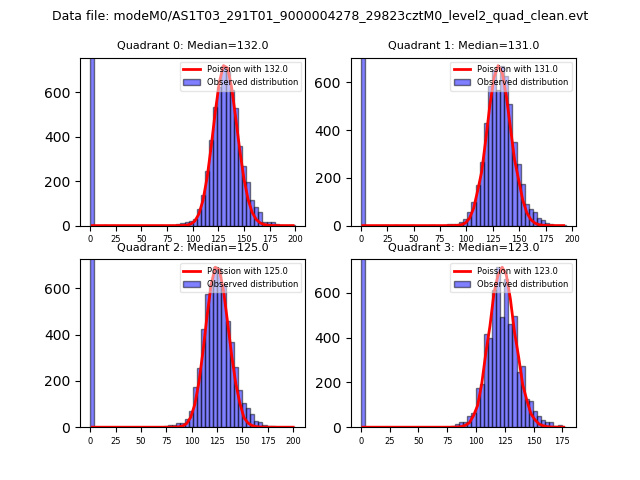 |
 |
| Quadrant-wise count rates Data is divided into 100 sec bins |
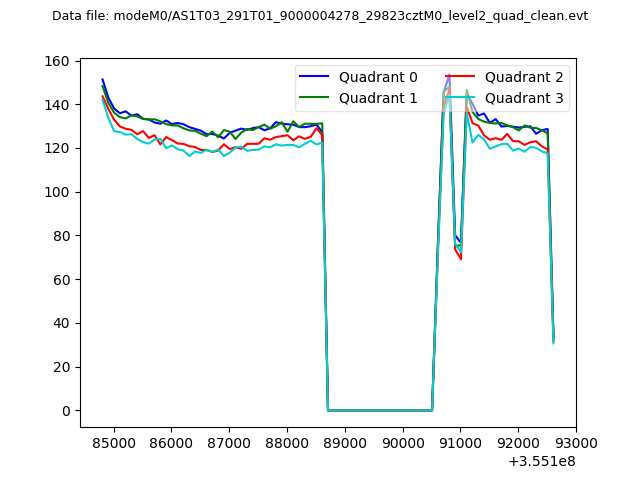 |
|
| Module-wise count rates for Quadrant A Data is divided into 100 sec bins |
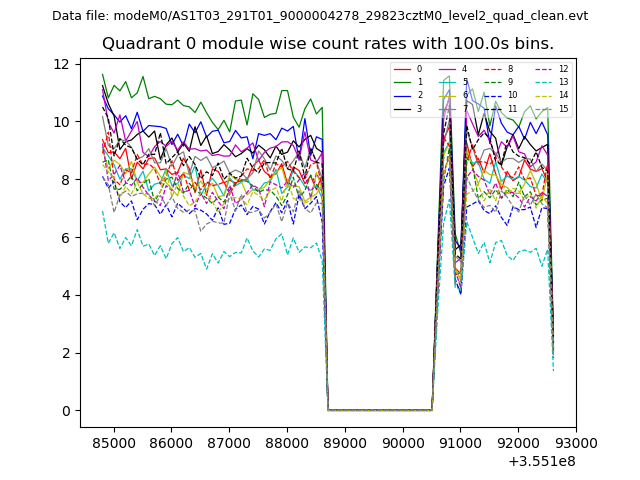 |
 |
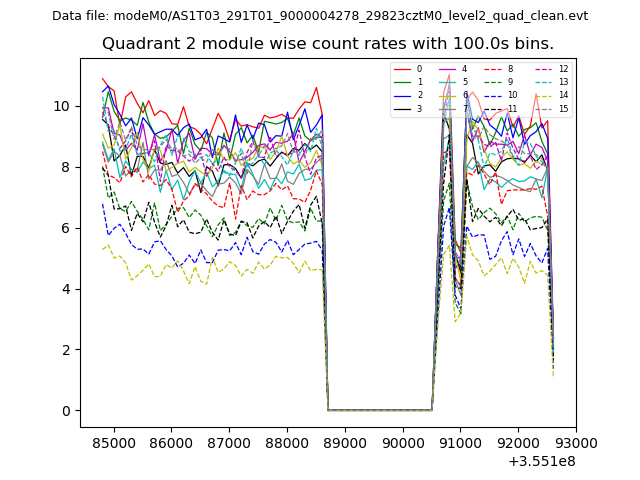
| Module-wise count rates for Quadrant B Data is divided into 100 sec bins |
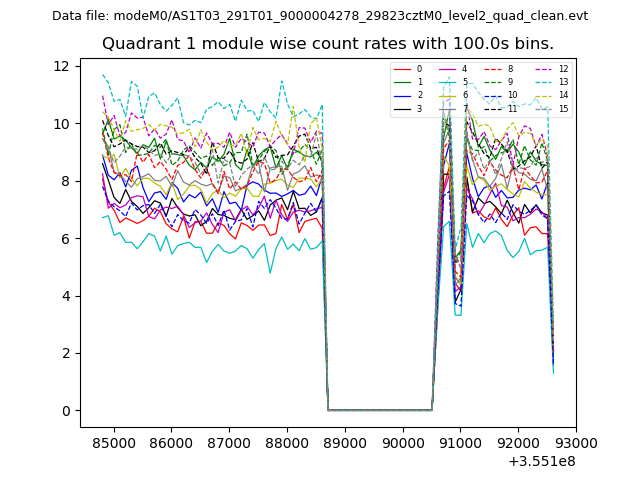 |
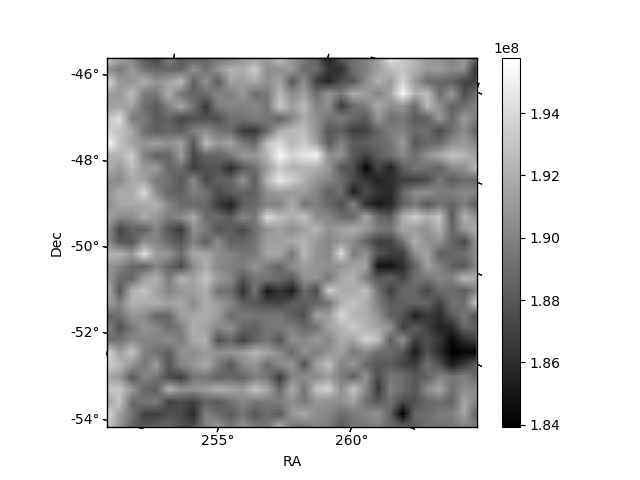 |
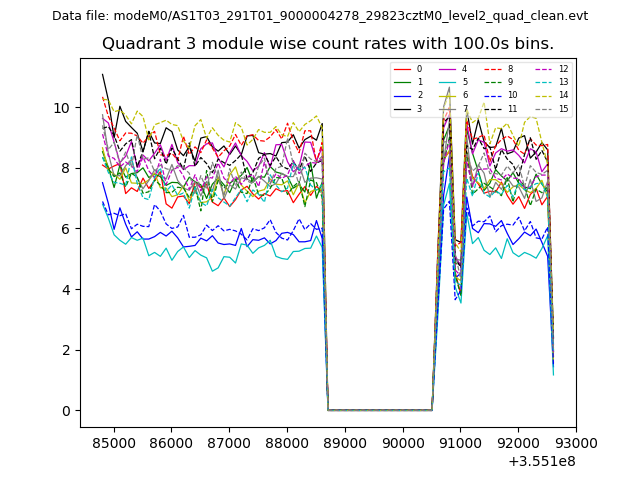
| Module-wise count rates for Quadrant C Data is divided into 100 sec bins |
 |
 |
| Module-wise count rates for Quadrant D Data is divided into 100 sec bins |
 |
 |
| Parameter | Plot |
|---|---|
| CZT HV Monitor | 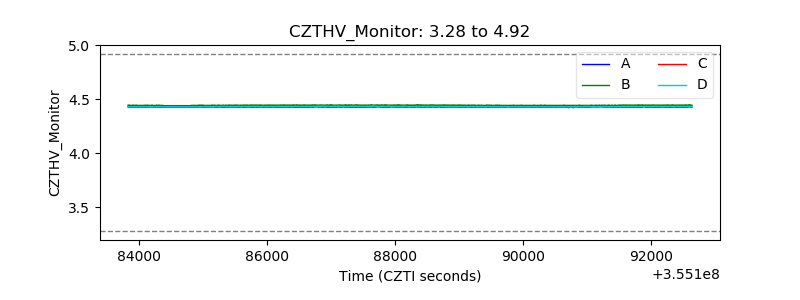 |
| D_VDD | 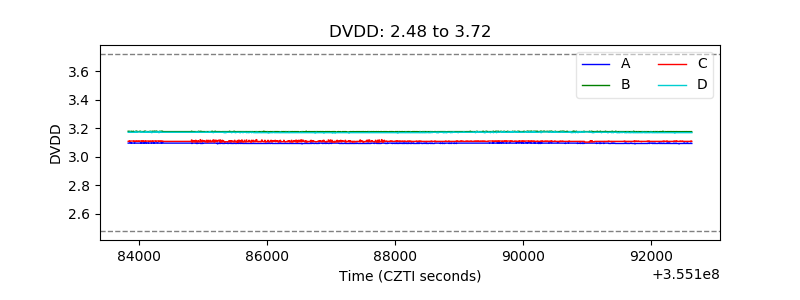 |
| Temperature 1 | 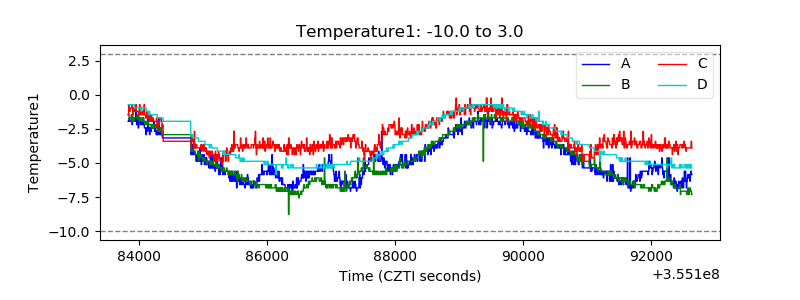 |
| Veto HV Monitor | 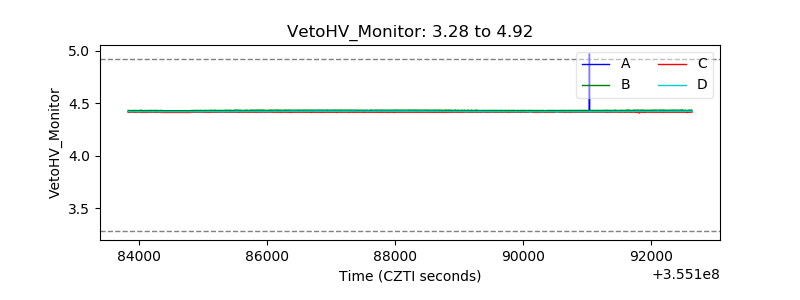 |
| Veto LLD | 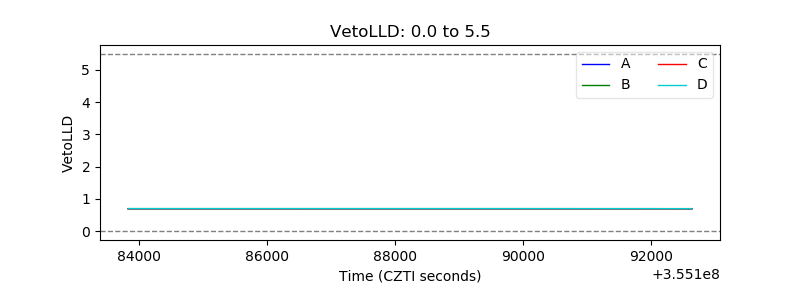 |
| Alpha Counter | 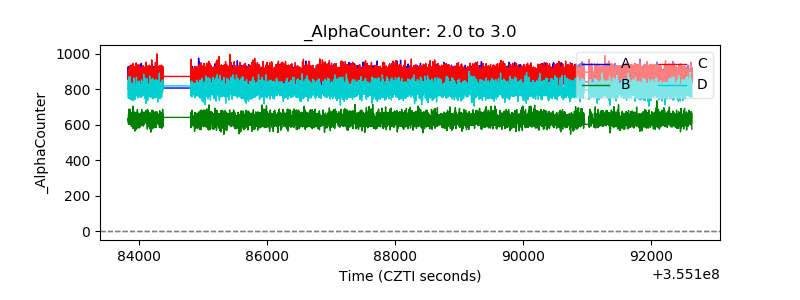 |
| _CPM_Rate | 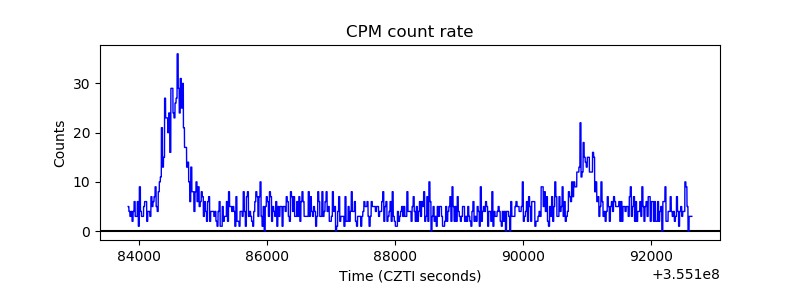 |
| CZT Counter | 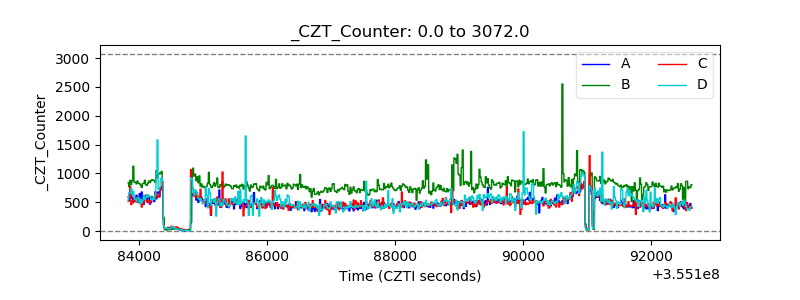 |
| +2.5 Volts monitor |  |
| +5 Volts monitor | 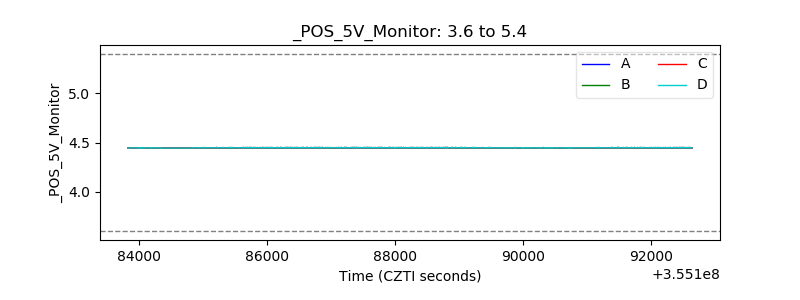 |
| _ROLL_ROT | 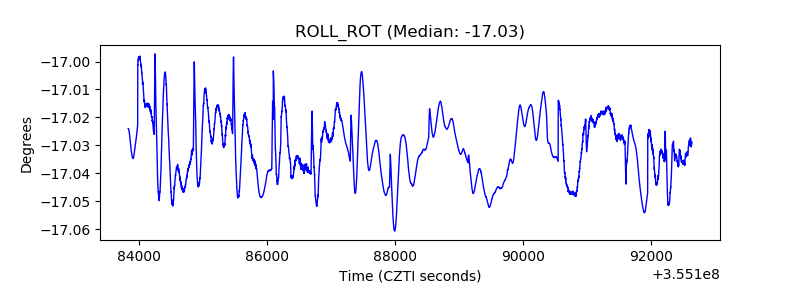 |
| _Roll_DEC | 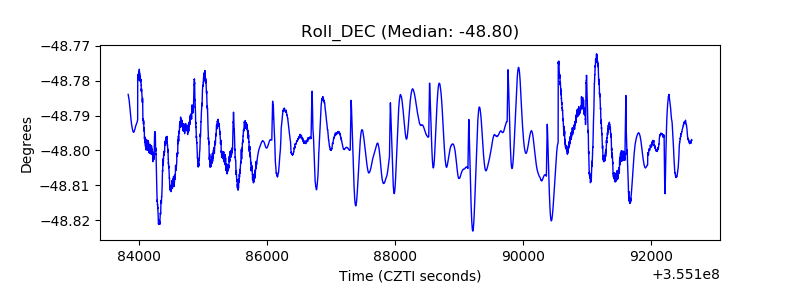 |
| _Roll_RA | 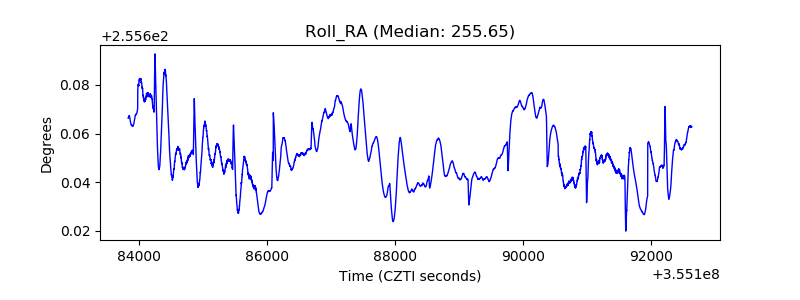 |
| Veto Counter | 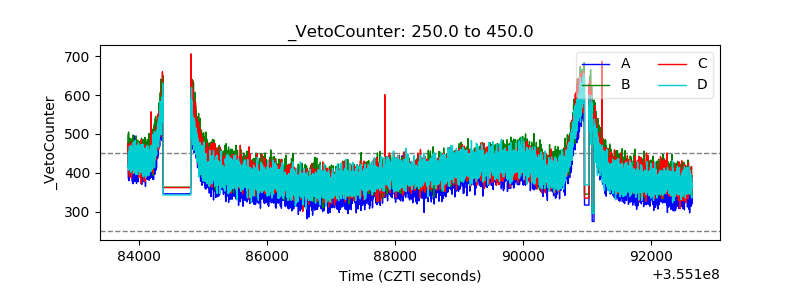 |