| Param | Original file | Final file |
|---|---|---|
| Filename | modeM0/AS1T03_291T01_9000004278_29828cztM0_level2.evt | modeM0/AS1T03_291T01_9000004278_29828cztM0_level2_quad_clean.evt |
| Size (bytes) | 691,410,240 | 129,009,600 |
| Size | 659.4 MB | 123.0 MB |
| Events in quadrant A | 4,168,541 | 853,653 |
| Events in quadrant B | 6,929,396 | 852,359 |
| Events in quadrant C | 4,282,681 | 812,541 |
| Events in quadrant D | 4,967,193 | 781,769 |
| Mode SS | |||
|---|---|---|---|
| Quadrant | BADHDUFLAG | Total packets | Discarded packets |
| A | 0 | 180 | 0 |
| B | 0 | 180 | 0 |
| C | 0 | 180 | 0 |
| D | 0 | 180 | 0 |
| Mode M0 | |||
|---|---|---|---|
| Quadrant | BADHDUFLAG | Total packets | Discarded packets |
| A | 0 | 18098 | 3 |
| B | 0 | 26941 | 3 |
| C | 0 | 18275 | 3 |
| D | 0 | 20244 | 3 |
| Mode M9 | |||
|---|---|---|---|
| Quadrant | BADHDUFLAG | Total packets | Discarded packets |
| A | 0 | 3 | 0 |
| B | 0 | 3 | 0 |
| C | 0 | 3 | 0 |
| D | 0 | 3 | 0 |
| Quadrant | Total seconds | Saturated seconds | Saturation percentage |
|---|---|---|---|
| A | 8737 | 67 | 0.766854% |
| B | 8737 | 309 | 3.536683% |
| C | 8737 | 224 | 2.563809% |
| D | 8737 | 237 | 2.712602% |
Noise dominated data is calculated using 1-second bins in cleaned event files. If a bin has >2000 counts, and if more than 50% of those come from <1% of pixels, then it is considered to be noise-dominated and hence unusable.
| Quadrant | # 1 sec bins | Bins with >0 counts | Bins with >2000 counts | High rate bins dominated by noise | Noise dominated (total time) | Noise dominated (detector-on time) | Marked lightcurve |
|---|---|---|---|---|---|---|---|
| A | 9052 | 8740 | 0 | 0 | 0.00% | 0.00% | 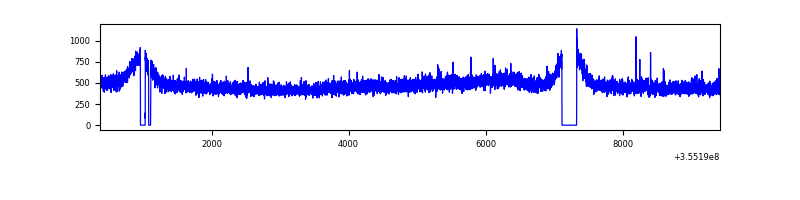 |
| B | 9052 | 8740 | 12 | 12 | 0.13% | 0.14% | 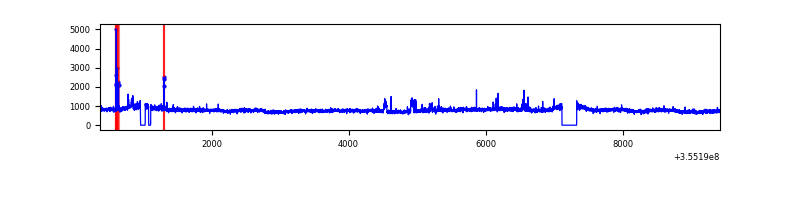 |
| C | 9052 | 8740 | 3 | 3 | 0.03% | 0.03% | 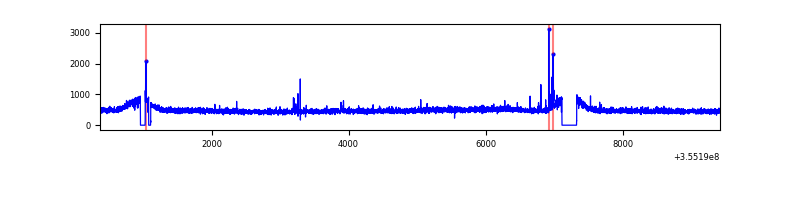 |
| D | 9052 | 8740 | 119 | 119 | 1.31% | 1.36% | 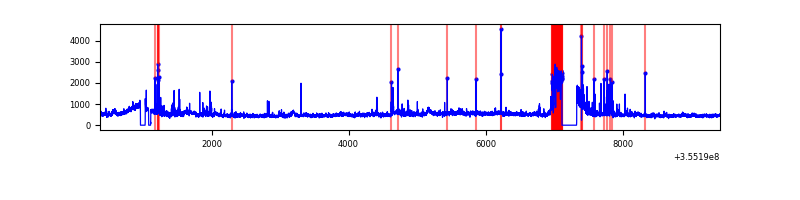 |
Top three noisy pixels from each quadrant. If the there are fewer than three noisy pixels in the level2.evt file, extra rows are filled as -1
| Pixel properties | Quadrant properties | ||||||
|---|---|---|---|---|---|---|---|
| Quadrant | DetID | PixID | Counts | Sigma | Mean | Median | Sigma |
| A | 13 | 254 | 16092 | 69.19 | 1077 | 1054 | 217.4 |
| A | 12 | 96 | 12321 | 51.84 | 1077 | 1054 | 217.4 |
| A | 3 | 137 | 10941 | 45.49 | 1077 | 1054 | 217.4 |
| B | 6 | 159 | 2575843 | 12636.65 | 1065 | 1038 | 203.8 |
| B | 0 | 190 | 99218 | 481.85 | 1065 | 1038 | 203.8 |
| B | 4 | 171 | 34579 | 164.61 | 1065 | 1038 | 203.8 |
| C | 14 | 238 | 170240 | 695.63 | 1036 | 1041 | 243.2 |
| C | 10 | 22 | 39384 | 157.64 | 1036 | 1041 | 243.2 |
| C | 2 | 114 | 20968 | 81.93 | 1036 | 1041 | 243.2 |
| D | 8 | 195 | 555077 | 2265.61 | 1027 | 1000 | 244.6 |
| D | 13 | 104 | 301554 | 1228.96 | 1027 | 1000 | 244.6 |
| D | 2 | 250 | 153211 | 622.39 | 1027 | 1000 | 244.6 |
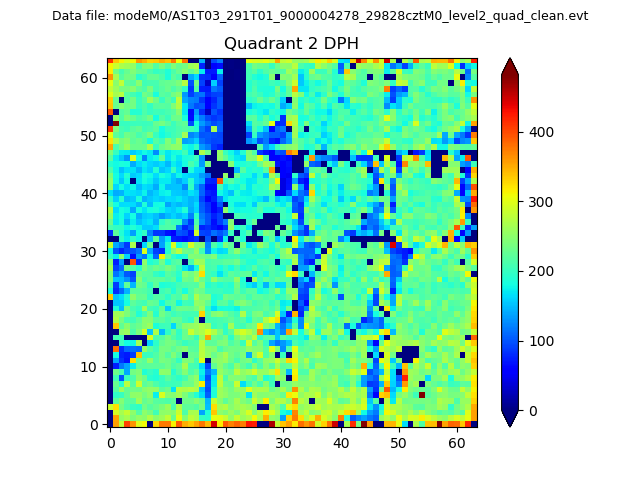
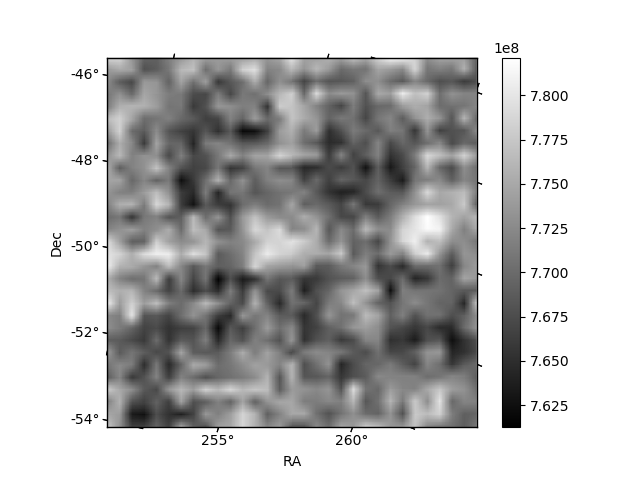
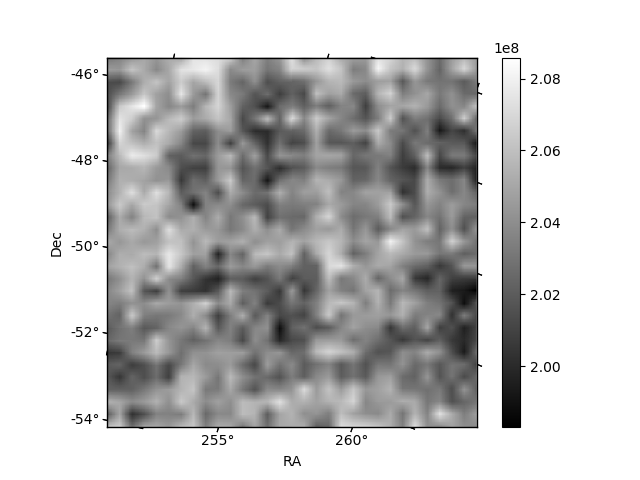
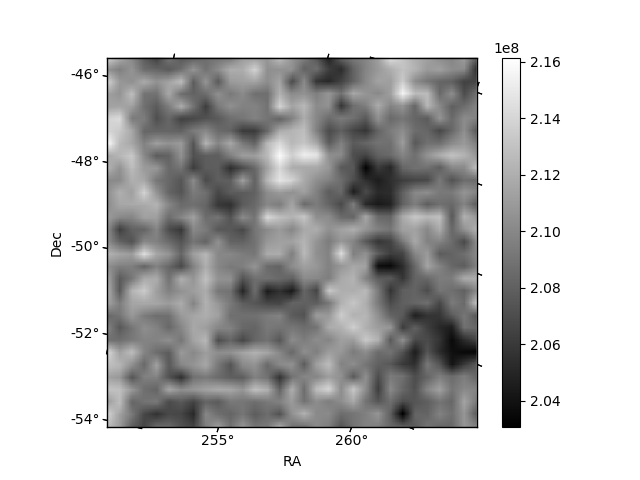
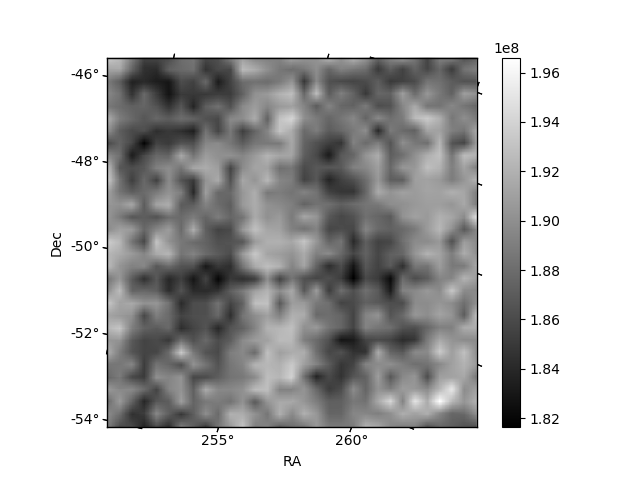
Histogram calculated using DETX and DETY for each event in the final _common_clean file
| Quadrant A | 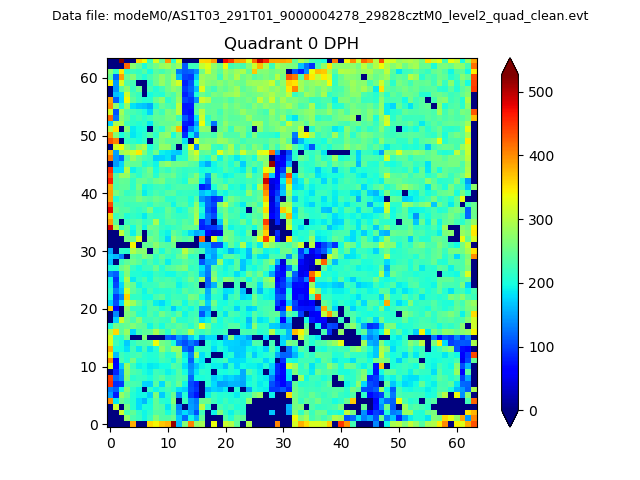 |
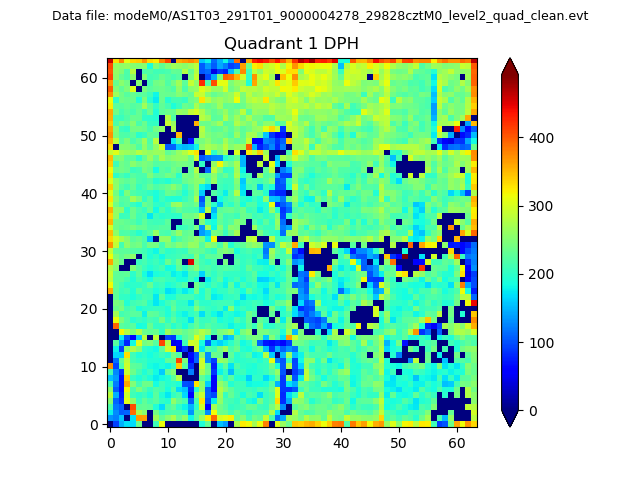 |
Quadrant B |
|---|---|---|---|
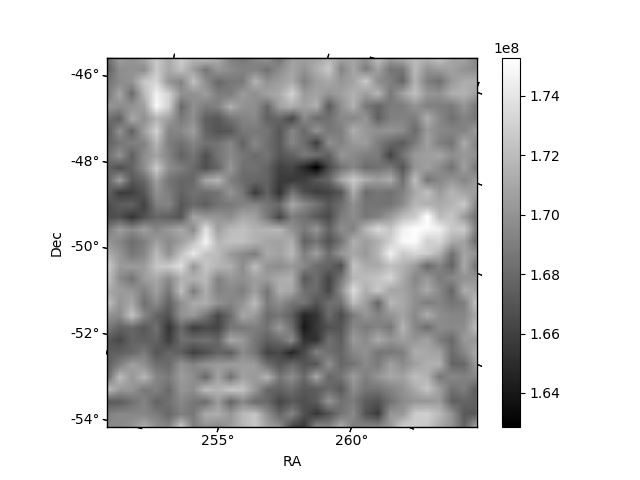
| Quadrant D | 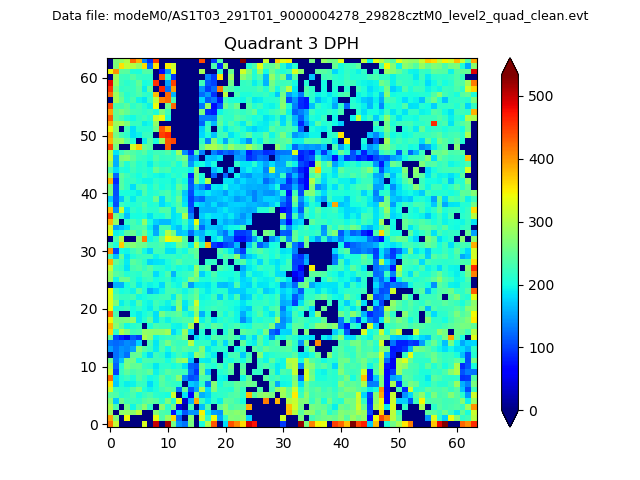 |
 |
Quadrant C |
| Plot type | Count rate plots | Images |
|---|---|---|
| Comparison with Poisson distribution Blue bars denote a histogram of data divided into 1 sec bins. Red curve is a Poisson curve with rate = median count rate of data. |
 |
 |
| Quadrant-wise count rates Data is divided into 100 sec bins |
 |
|
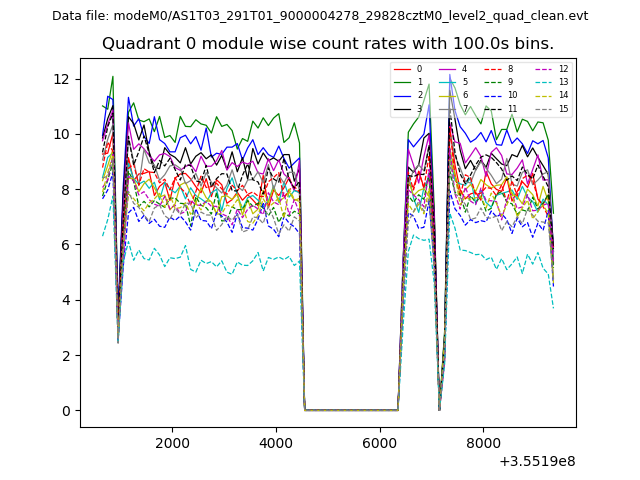
| Module-wise count rates for Quadrant A Data is divided into 100 sec bins |
 |
 |
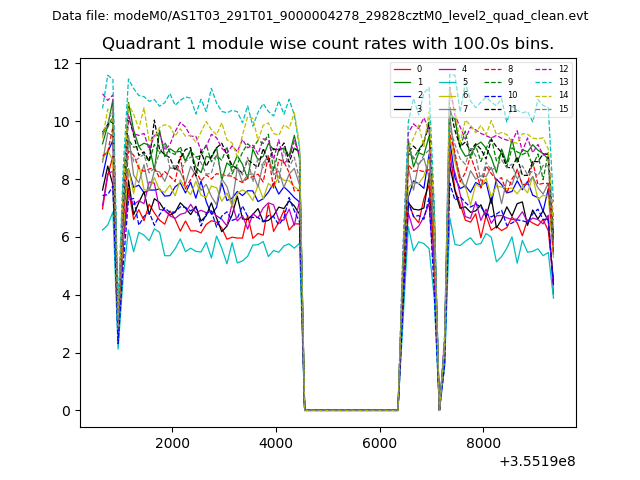
| Module-wise count rates for Quadrant B Data is divided into 100 sec bins |
 |
 |
| Module-wise count rates for Quadrant C Data is divided into 100 sec bins |
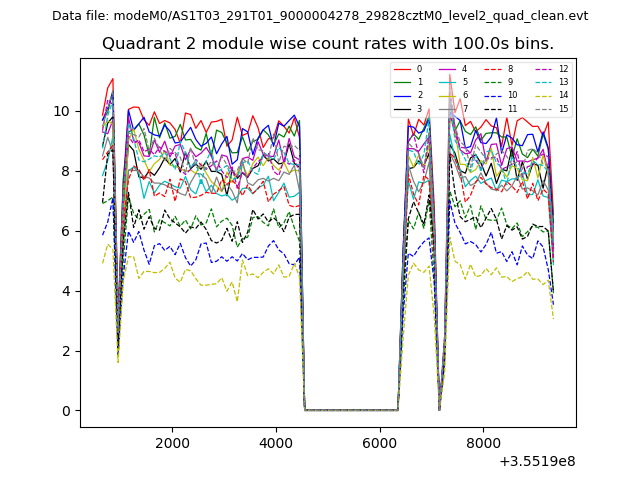 |
 |
| Module-wise count rates for Quadrant D Data is divided into 100 sec bins |
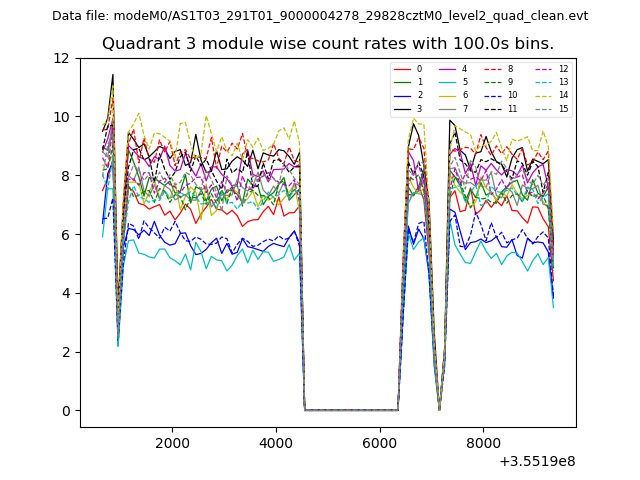 |
 |
| Parameter | Plot |
|---|---|
| CZT HV Monitor | 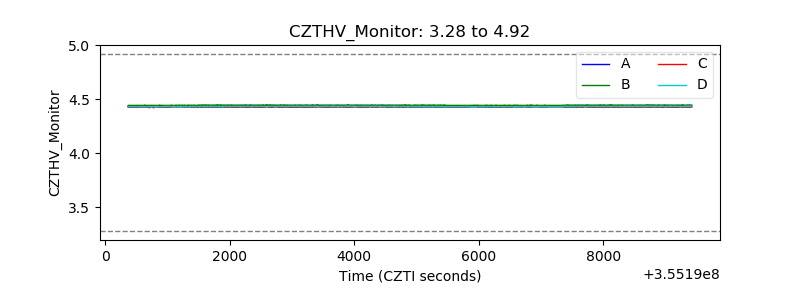 |
| D_VDD |  |
| Temperature 1 | 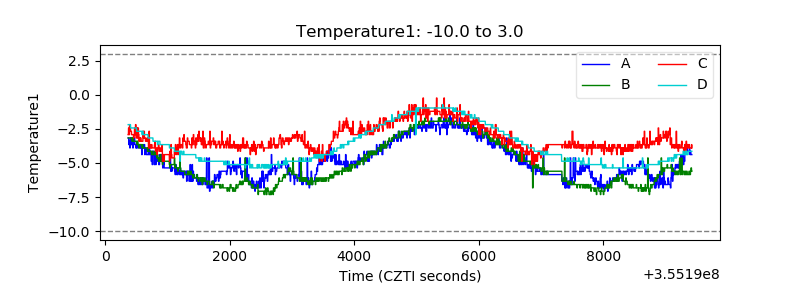 |
| Veto HV Monitor | 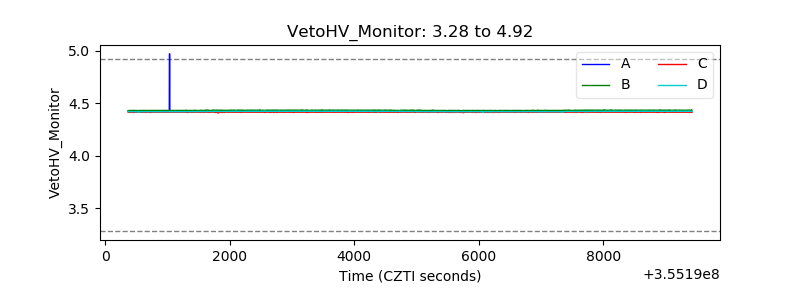 |
| Veto LLD | 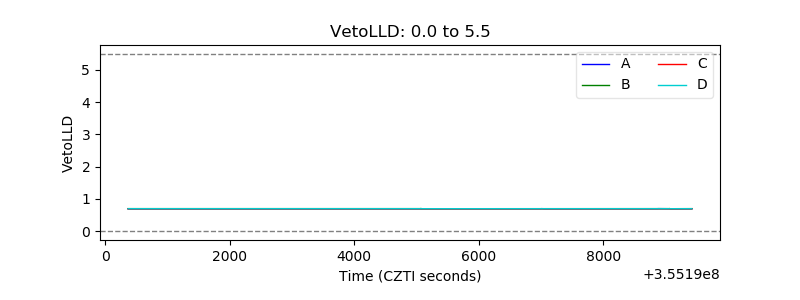 |
| Alpha Counter | 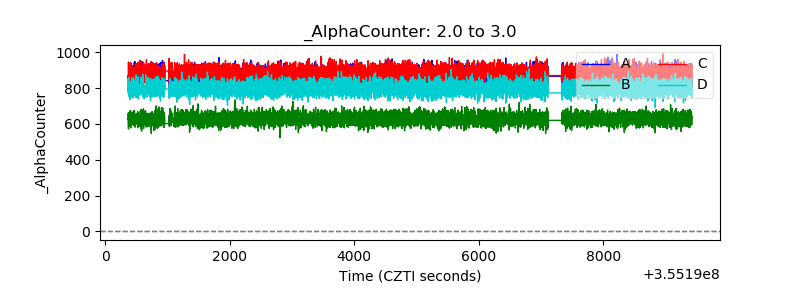 |
| _CPM_Rate | 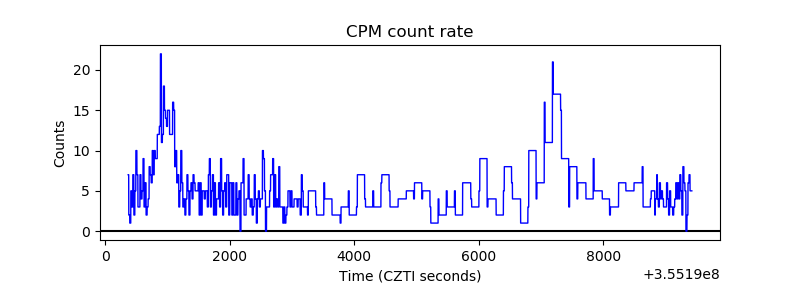 |
| CZT Counter | 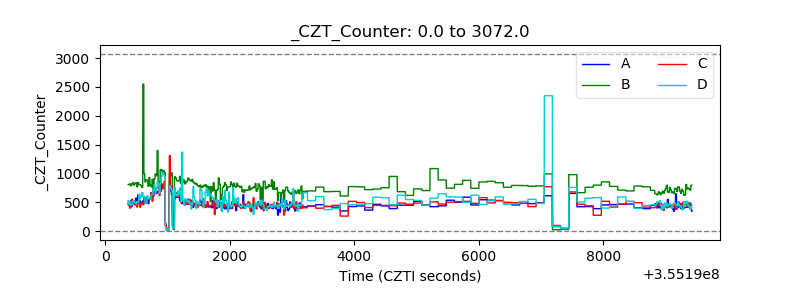 |
| +2.5 Volts monitor |  |
| +5 Volts monitor |  |
| _ROLL_ROT | 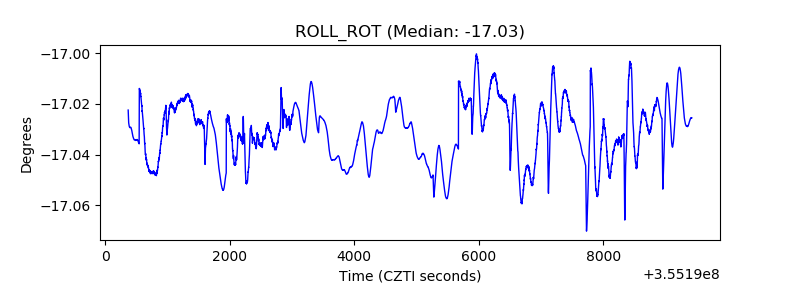 |
| _Roll_DEC | 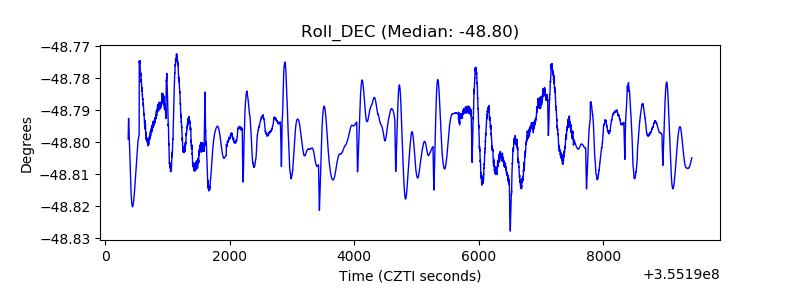 |
| _Roll_RA | 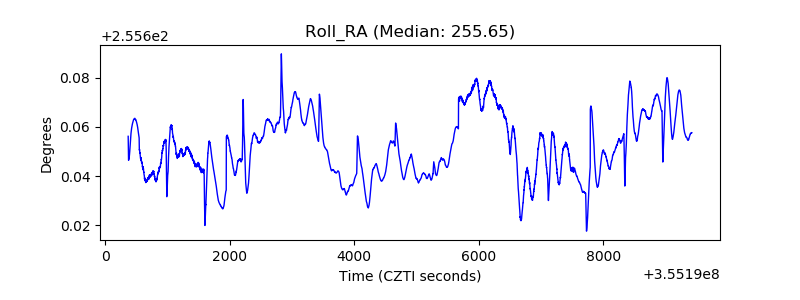 |
| Veto Counter | 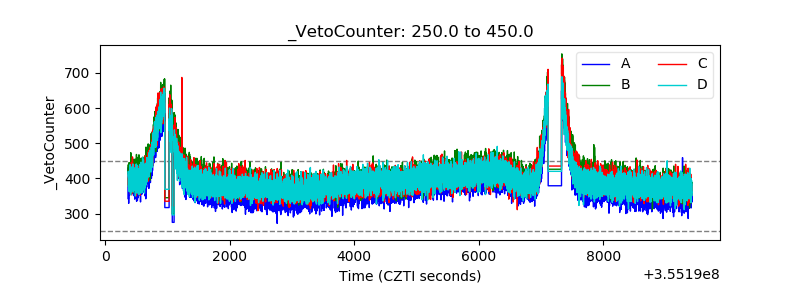 |