| Param | Original file | Final file |
|---|---|---|
| Filename | modeM0/AS1T03_291T01_9000004278_29830cztM0_level2.evt | modeM0/AS1T03_291T01_9000004278_29830cztM0_level2_quad_clean.evt |
| Size (bytes) | 2,224,779,840 | 353,672,640 |
| Size | 2.1 GB | 337.3 MB |
| Events in quadrant A | 13,157,783 | 2,279,263 |
| Events in quadrant B | 21,150,673 | 2,278,635 |
| Events in quadrant C | 13,722,849 | 2,176,324 |
| Events in quadrant D | 17,517,281 | 2,109,657 |
| Mode SS | |||
|---|---|---|---|
| Quadrant | BADHDUFLAG | Total packets | Discarded packets |
| A | 0 | 556 | 0 |
| B | 0 | 556 | 0 |
| C | 0 | 556 | 0 |
| D | 0 | 556 | 0 |
| Mode M0 | |||
|---|---|---|---|
| Quadrant | BADHDUFLAG | Total packets | Discarded packets |
| A | 0 | 56415 | 5 |
| B | 0 | 82604 | 5 |
| C | 0 | 57709 | 5 |
| D | 0 | 69541 | 9 |
| Mode M9 | |||
|---|---|---|---|
| Quadrant | BADHDUFLAG | Total packets | Discarded packets |
| A | 0 | 40 | 0 |
| B | 0 | 40 | 0 |
| C | 0 | 40 | 0 |
| D | 0 | 40 | 0 |
| Quadrant | Total seconds | Saturated seconds | Saturation percentage |
|---|---|---|---|
| A | 27158 | 220 | 0.810074% |
| B | 27159 | 422 | 1.553813% |
| C | 27159 | 511 | 1.881513% |
| D | 27158 | 726 | 2.673245% |
Noise dominated data is calculated using 1-second bins in cleaned event files. If a bin has >2000 counts, and if more than 50% of those come from <1% of pixels, then it is considered to be noise-dominated and hence unusable.
| Quadrant | # 1 sec bins | Bins with >0 counts | Bins with >2000 counts | High rate bins dominated by noise | Noise dominated (total time) | Noise dominated (detector-on time) | Marked lightcurve |
|---|---|---|---|---|---|---|---|
| A | 31223 | 27163 | 7 | 7 | 0.02% | 0.03% | 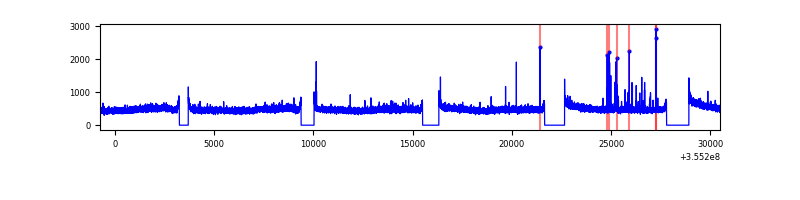 |
| B | 31224 | 27164 | 13 | 13 | 0.04% | 0.05% | 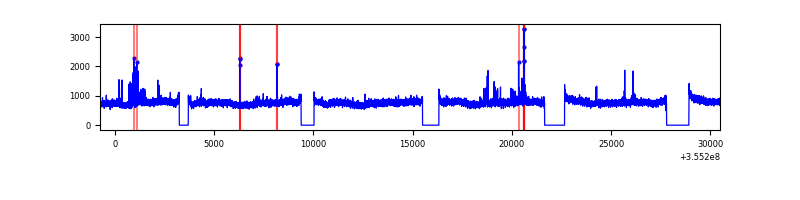 |
| C | 31224 | 27164 | 50 | 50 | 0.16% | 0.18% | 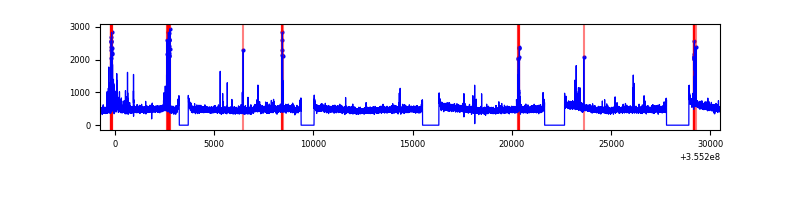 |
| D | 31223 | 27163 | 455 | 455 | 1.46% | 1.68% | 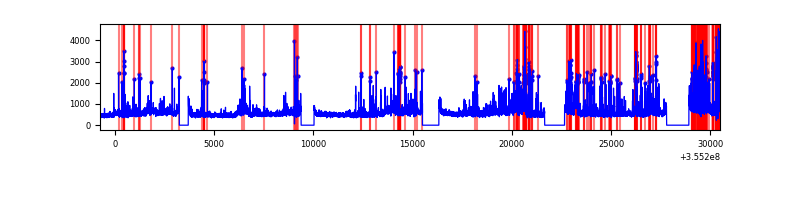 |
Top three noisy pixels from each quadrant. If the there are fewer than three noisy pixels in the level2.evt file, extra rows are filled as -1
| Pixel properties | Quadrant properties | ||||||
|---|---|---|---|---|---|---|---|
| Quadrant | DetID | PixID | Counts | Sigma | Mean | Median | Sigma |
| A | 12 | 96 | 115453 | 167.84 | 3371 | 3300 | 668.2 |
| A | 13 | 254 | 50331 | 70.38 | 3371 | 3300 | 668.2 |
| A | 3 | 137 | 33121 | 44.63 | 3371 | 3300 | 668.2 |
| B | 6 | 159 | 7722321 | 12344.74 | 3319 | 3240 | 625.3 |
| B | 15 | 33 | 210154 | 330.91 | 3319 | 3240 | 625.3 |
| B | 5 | 255 | 94638 | 146.17 | 3319 | 3240 | 625.3 |
| C | 14 | 238 | 535855 | 715.02 | 3216 | 3239 | 744.9 |
| C | 10 | 22 | 491342 | 655.26 | 3216 | 3239 | 744.9 |
| C | 3 | 233 | 93779 | 121.55 | 3216 | 3239 | 744.9 |
| D | 7 | 80 | 2157696 | 2828.39 | 3234 | 3147 | 761.8 |
| D | 8 | 195 | 1564719 | 2049.96 | 3234 | 3147 | 761.8 |
| D | 13 | 189 | 677486 | 885.24 | 3234 | 3147 | 761.8 |
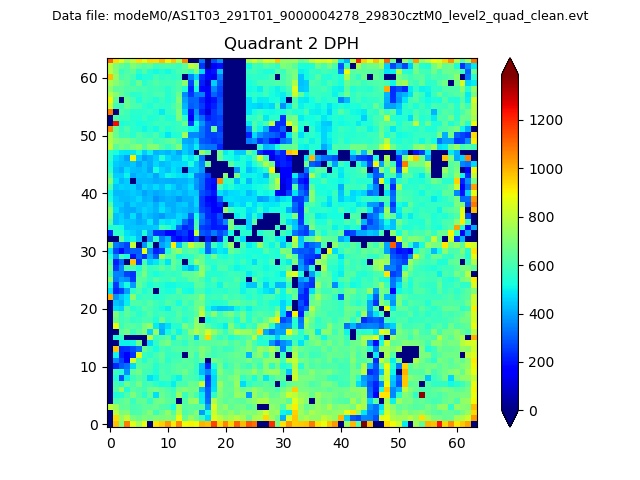
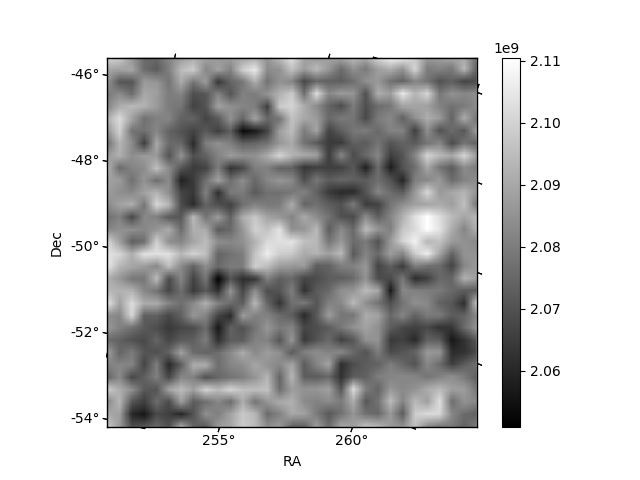
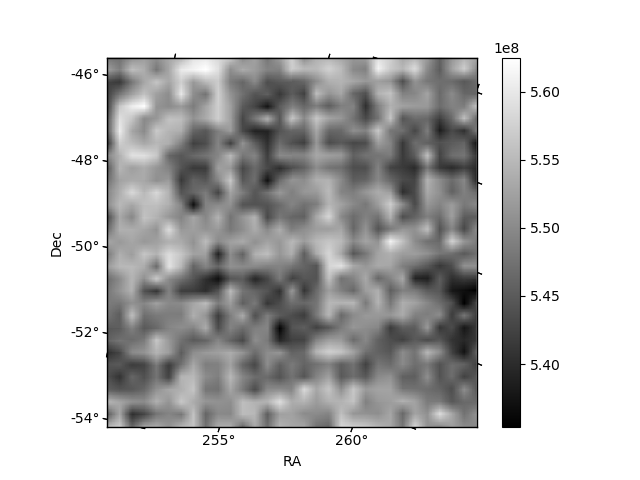
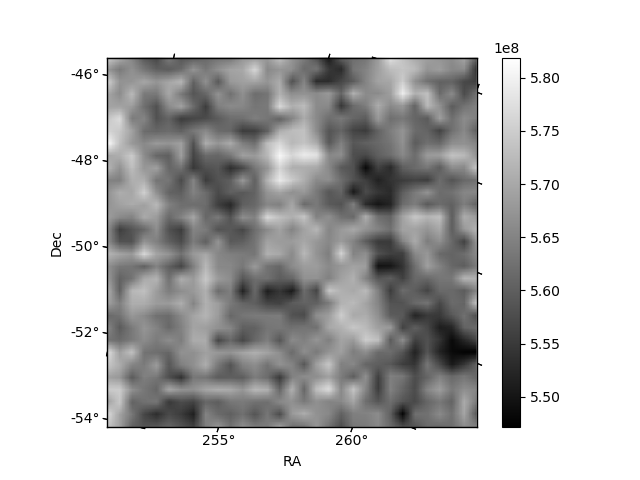
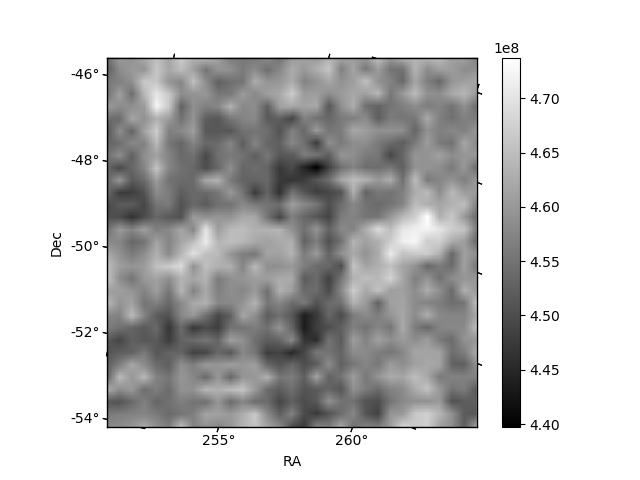
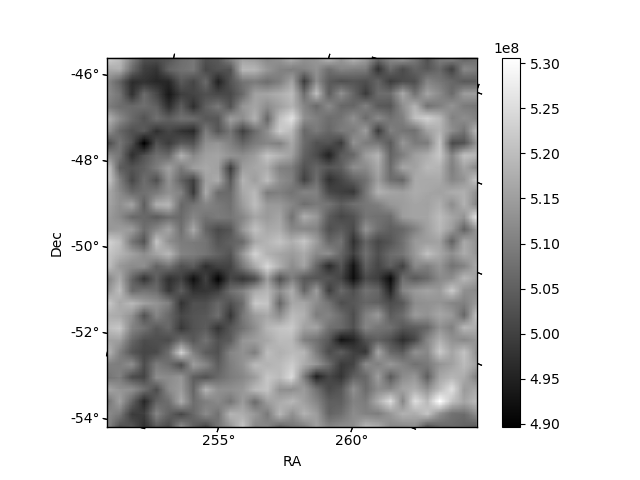
Histogram calculated using DETX and DETY for each event in the final _common_clean file
| Quadrant A | 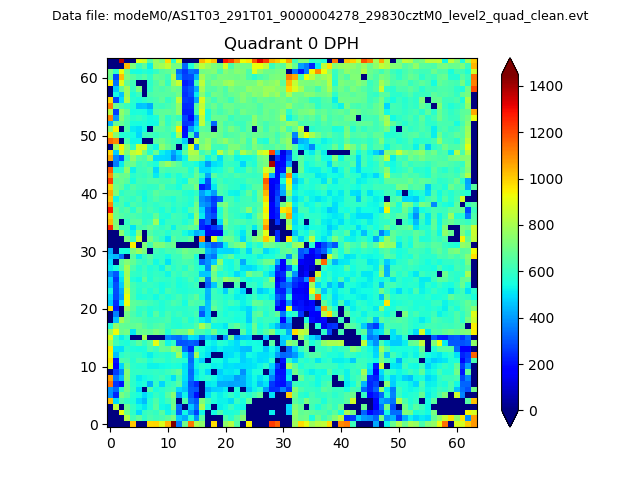 |
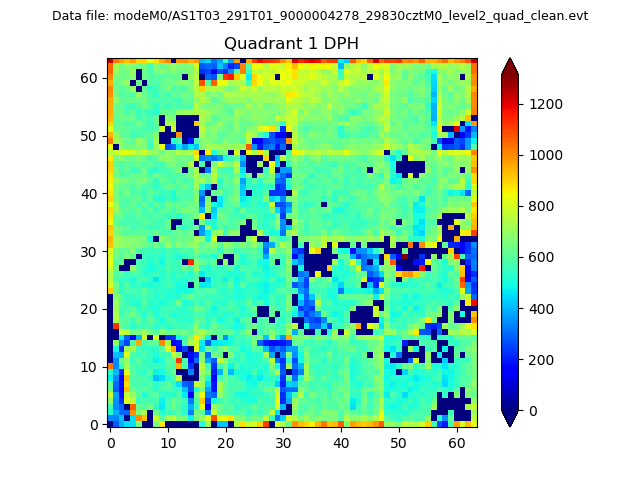 |
Quadrant B |
|---|---|---|---|
| Quadrant D | 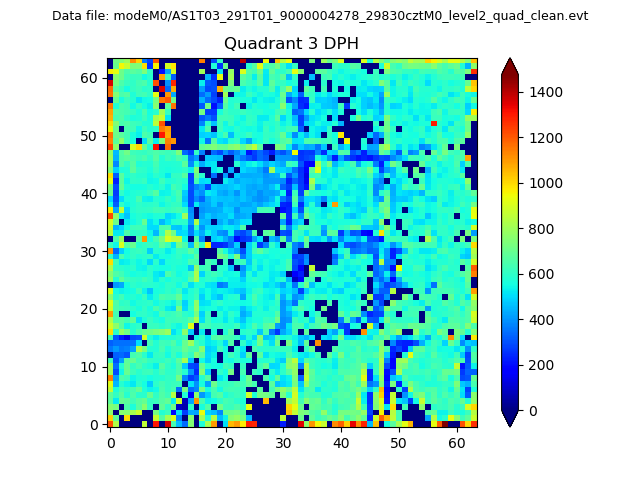 |
 |
Quadrant C |
| Plot type | Count rate plots | Images |
|---|---|---|
| Comparison with Poisson distribution Blue bars denote a histogram of data divided into 1 sec bins. Red curve is a Poisson curve with rate = median count rate of data. |
 |
 |
| Quadrant-wise count rates Data is divided into 100 sec bins |
 |
|
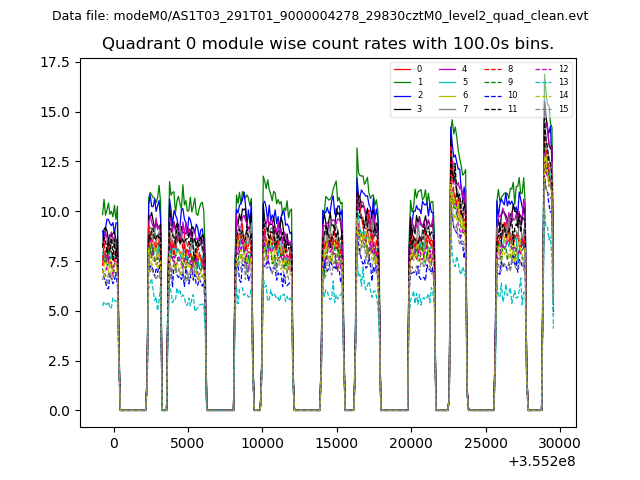
| Module-wise count rates for Quadrant A Data is divided into 100 sec bins |
 |
 |
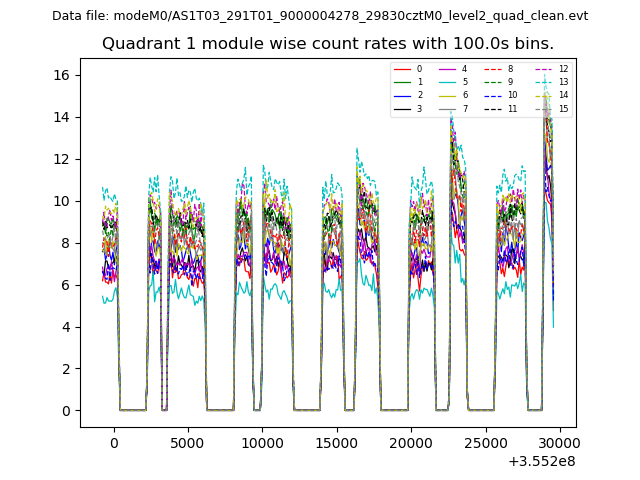
| Module-wise count rates for Quadrant B Data is divided into 100 sec bins |
 |
 |
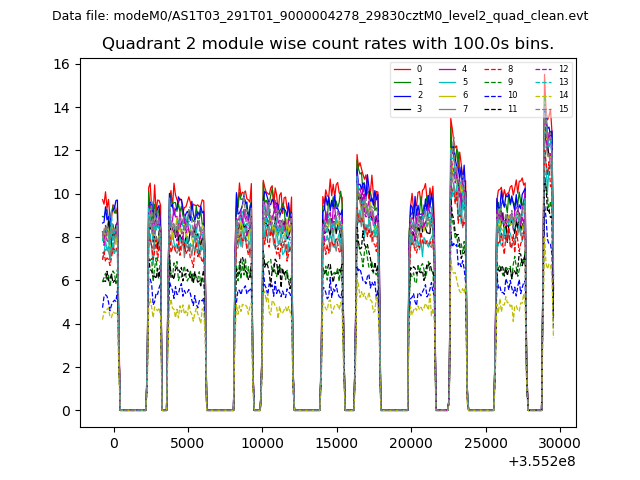
| Module-wise count rates for Quadrant C Data is divided into 100 sec bins |
 |
 |
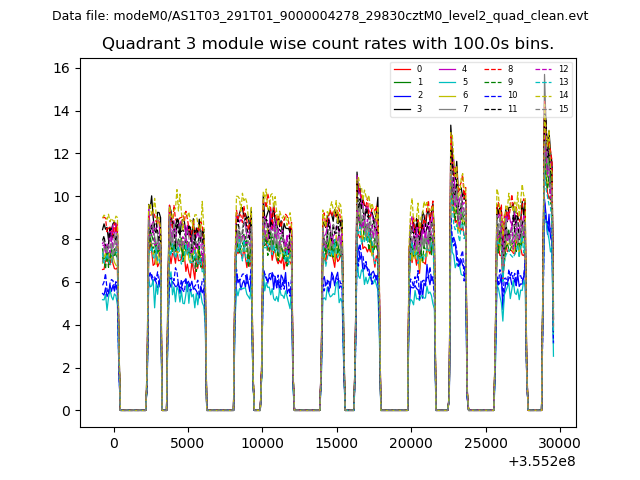
| Module-wise count rates for Quadrant D Data is divided into 100 sec bins |
 |
 |
| Parameter | Plot |
|---|---|
| CZT HV Monitor | 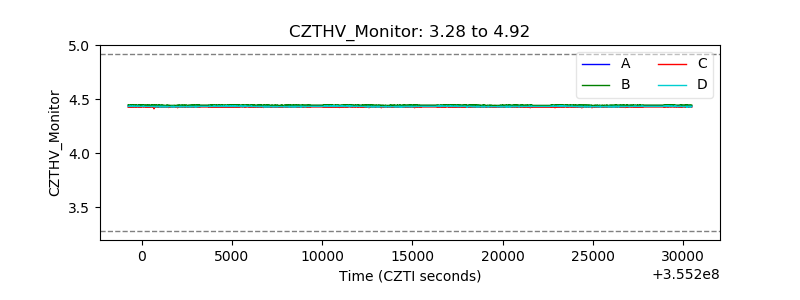 |
| D_VDD | 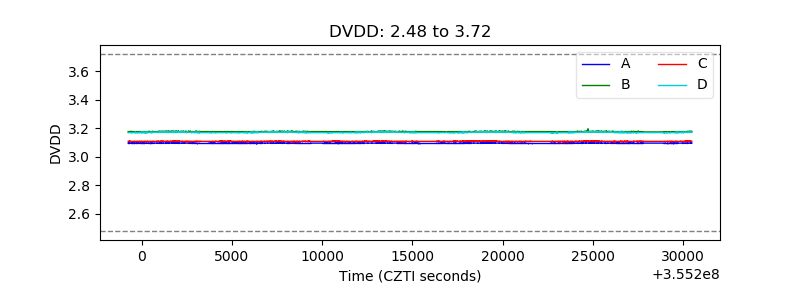 |
| Temperature 1 | 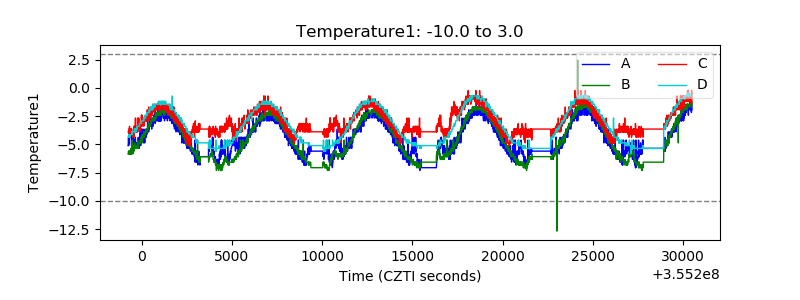 |
| Veto HV Monitor | 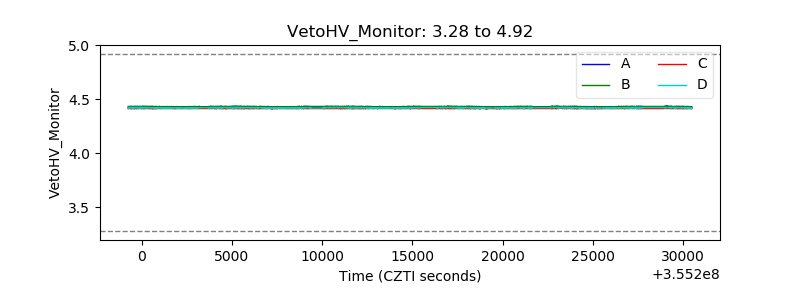 |
| Veto LLD | 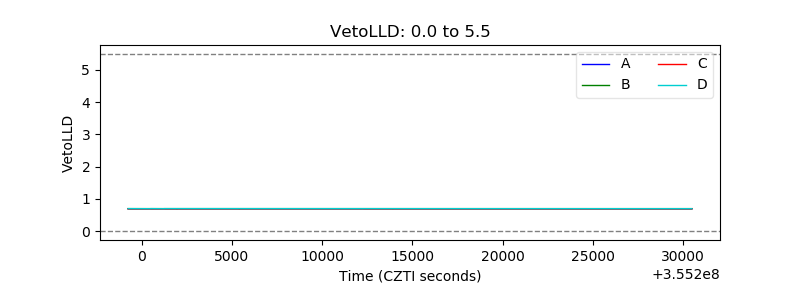 |
| Alpha Counter | 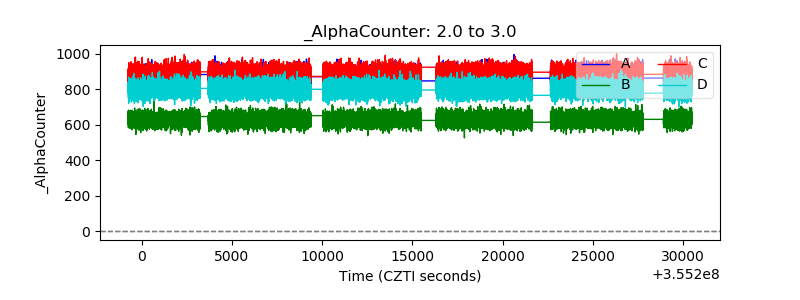 |
| _CPM_Rate |  |
| CZT Counter | 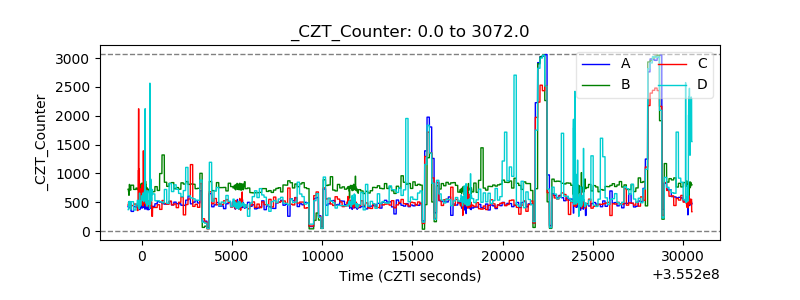 |
| +2.5 Volts monitor |  |
| +5 Volts monitor |  |
| _ROLL_ROT | 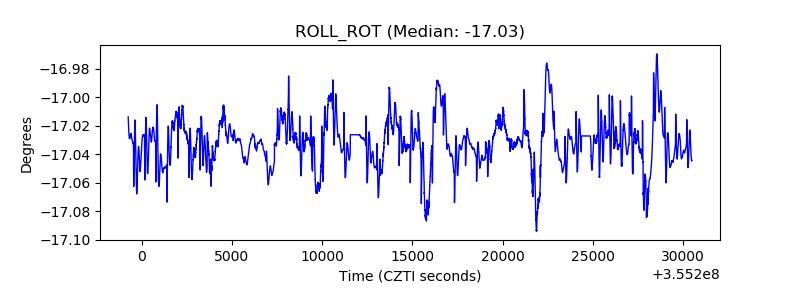 |
| _Roll_DEC | 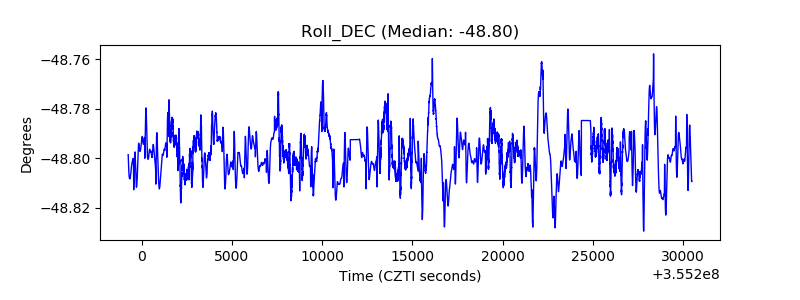 |
| _Roll_RA | 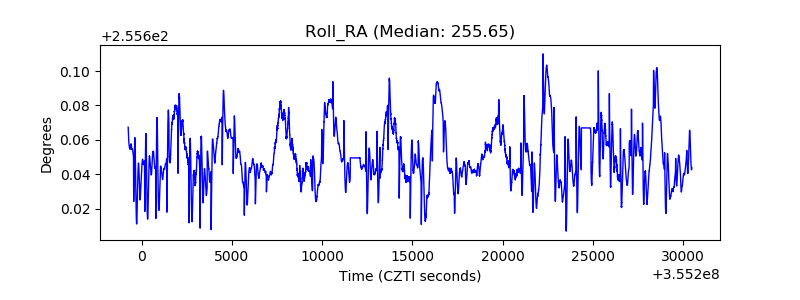 |
| Veto Counter | 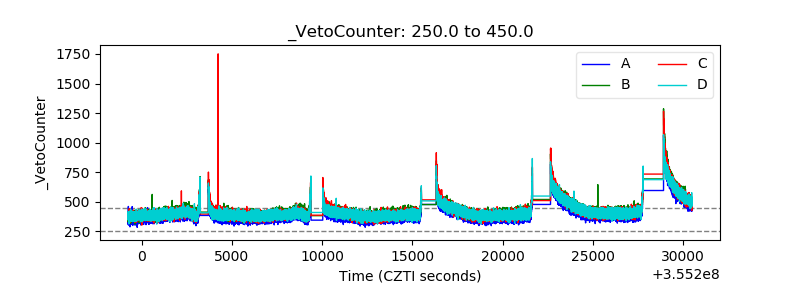 |