| Param | Original file | Final file |
|---|---|---|
| Filename | modeM0/AS1T03_291T01_9000004278_29832cztM0_level2.evt | modeM0/AS1T03_291T01_9000004278_29832cztM0_level2_quad_clean.evt |
| Size (bytes) | 719,228,160 | 63,720,000 |
| Size | 685.9 MB | 60.8 MB |
| Events in quadrant A | 3,364,674 | 413,834 |
| Events in quadrant B | 5,114,975 | 408,522 |
| Events in quadrant C | 3,304,683 | 383,752 |
| Events in quadrant D | 9,592,606 | 303,206 |
| Mode SS | |||
|---|---|---|---|
| Quadrant | BADHDUFLAG | Total packets | Discarded packets |
| A | 0 | 124 | 0 |
| B | 0 | 124 | 0 |
| C | 0 | 124 | 0 |
| D | 0 | 124 | 0 |
| Mode M0 | |||
|---|---|---|---|
| Quadrant | BADHDUFLAG | Total packets | Discarded packets |
| A | 0 | 13861 | 1 |
| B | 0 | 18827 | 1 |
| C | 0 | 13549 | 1 |
| D | 0 | 32660 | 1 |
| Mode M9 | |||
|---|---|---|---|
| Quadrant | BADHDUFLAG | Total packets | Discarded packets |
| A | 0 | 13 | 0 |
| B | 0 | 13 | 0 |
| C | 0 | 13 | 0 |
| D | 0 | 13 | 0 |
| Quadrant | Total seconds | Saturated seconds | Saturation percentage |
|---|---|---|---|
| A | 5998 | 55 | 0.916972% |
| B | 5999 | 111 | 1.850308% |
| C | 5999 | 79 | 1.316886% |
| D | 5999 | 2101 | 35.022504% |
Noise dominated data is calculated using 1-second bins in cleaned event files. If a bin has >2000 counts, and if more than 50% of those come from <1% of pixels, then it is considered to be noise-dominated and hence unusable.
| Quadrant | # 1 sec bins | Bins with >0 counts | Bins with >2000 counts | High rate bins dominated by noise | Noise dominated (total time) | Noise dominated (detector-on time) | Marked lightcurve |
|---|---|---|---|---|---|---|---|
| A | 7353 | 5999 | 2 | 2 | 0.03% | 0.03% | 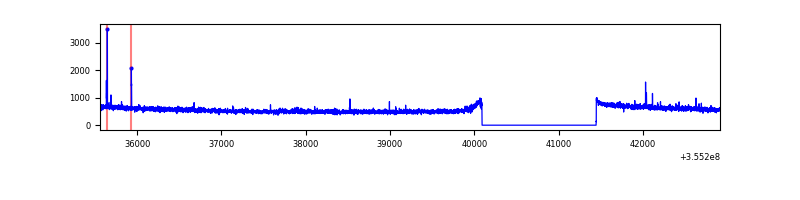 |
| B | 7354 | 6000 | 0 | 0 | 0.00% | 0.00% | 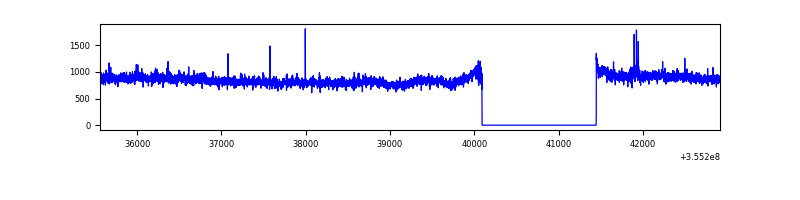 |
| C | 7354 | 6000 | 0 | 0 | 0.00% | 0.00% | 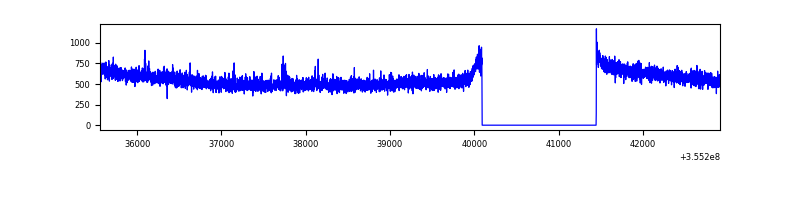 |
| D | 7354 | 6000 | 1920 | 1920 | 26.11% | 32.00% | 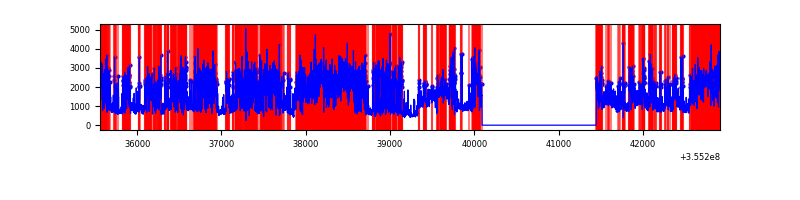 |
Top three noisy pixels from each quadrant. If the there are fewer than three noisy pixels in the level2.evt file, extra rows are filled as -1
| Pixel properties | Quadrant properties | ||||||
|---|---|---|---|---|---|---|---|
| Quadrant | DetID | PixID | Counts | Sigma | Mean | Median | Sigma |
| A | 12 | 96 | 19102 | 108.11 | 867 | 855 | 168.8 |
| A | 13 | 254 | 11724 | 64.4 | 867 | 855 | 168.8 |
| A | 3 | 137 | 7458 | 39.12 | 867 | 855 | 168.8 |
| B | 6 | 159 | 1752643 | 11358.67 | 849 | 834 | 154.2 |
| B | 15 | 33 | 20129 | 125.11 | 849 | 834 | 154.2 |
| B | 12 | 111 | 17449 | 107.73 | 849 | 834 | 154.2 |
| C | 14 | 238 | 136355 | 741.29 | 802 | 808 | 182.9 |
| C | 3 | 233 | 23056 | 121.67 | 802 | 808 | 182.9 |
| C | 2 | 114 | 14272 | 73.63 | 802 | 808 | 182.9 |
| D | 7 | 80 | 6165208 | 37128.91 | 711 | 696 | 166.0 |
| D | 8 | 195 | 376073 | 2260.9 | 711 | 696 | 166.0 |
| D | 13 | 189 | 212817 | 1277.61 | 711 | 696 | 166.0 |
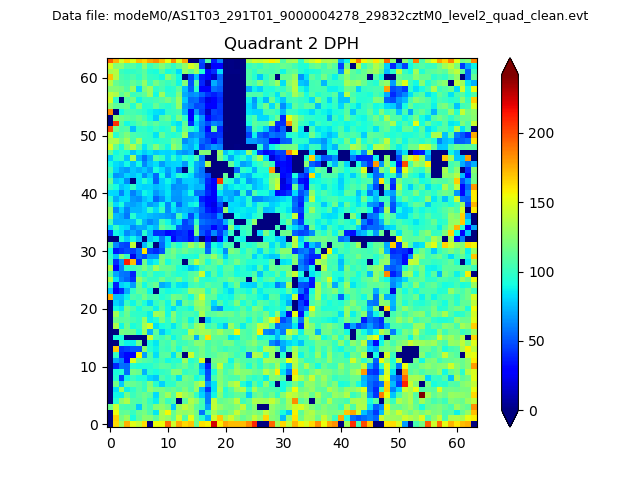
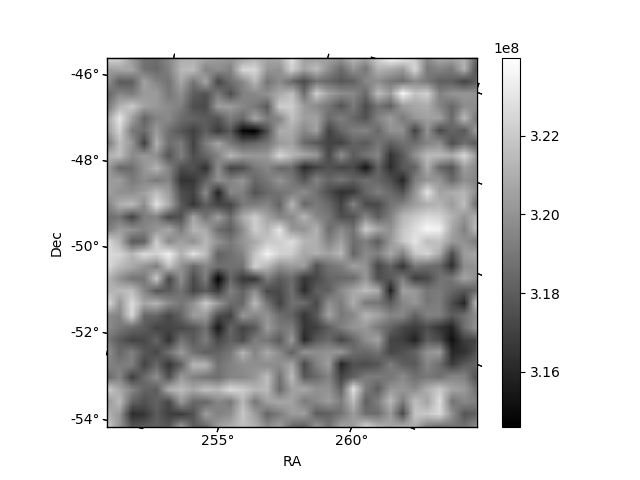
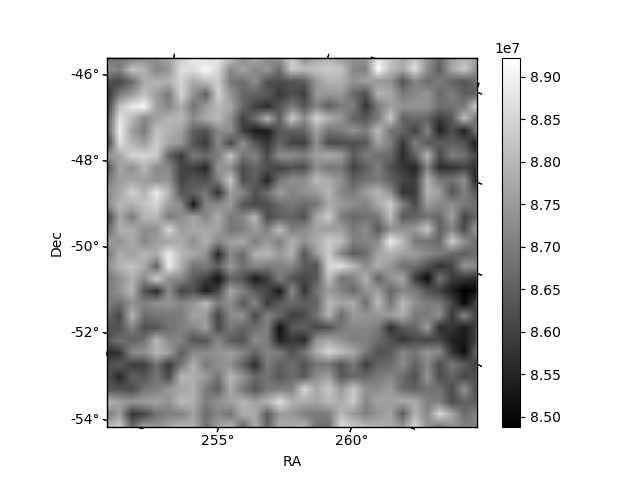
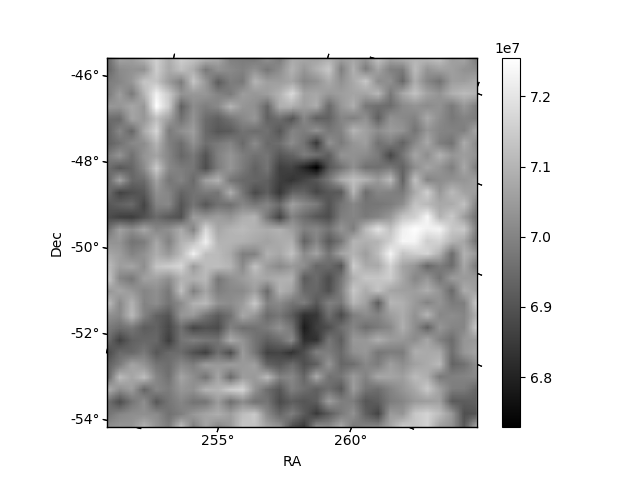
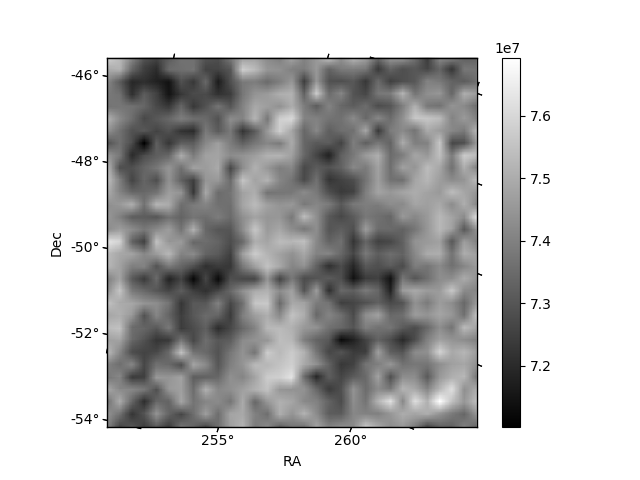
Histogram calculated using DETX and DETY for each event in the final _common_clean file
| Quadrant A | 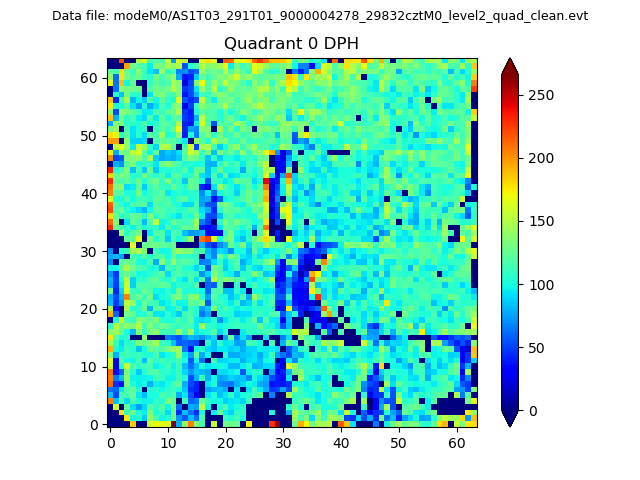 |
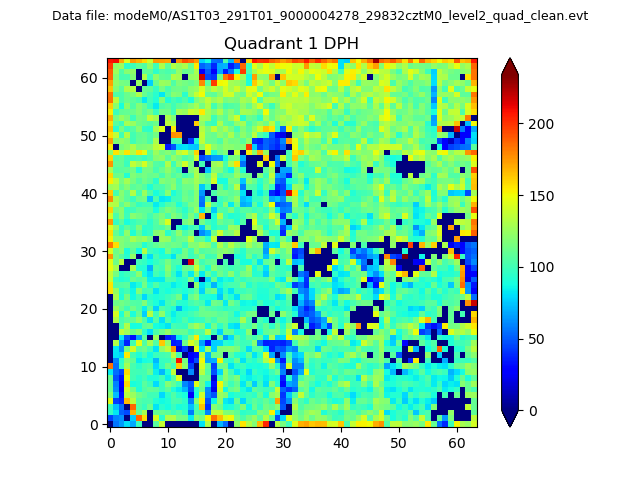 |
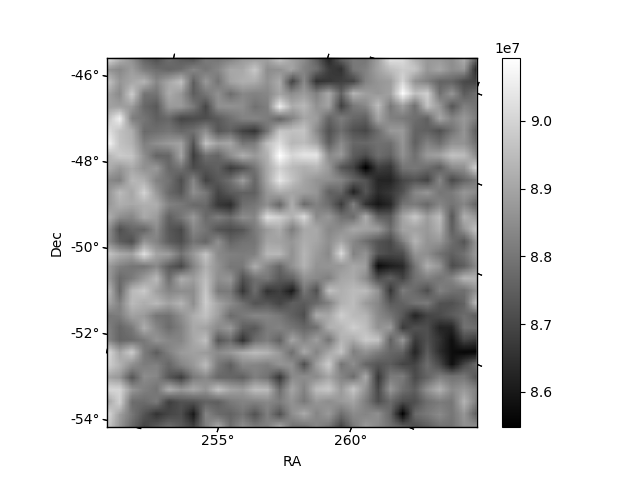
Quadrant B |
|---|---|---|---|
| Quadrant D | 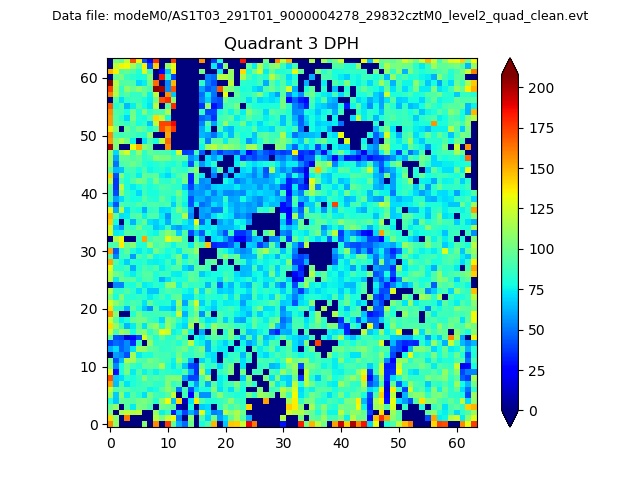 |
 |
Quadrant C |
| Plot type | Count rate plots | Images |
|---|---|---|
| Comparison with Poisson distribution Blue bars denote a histogram of data divided into 1 sec bins. Red curve is a Poisson curve with rate = median count rate of data. |
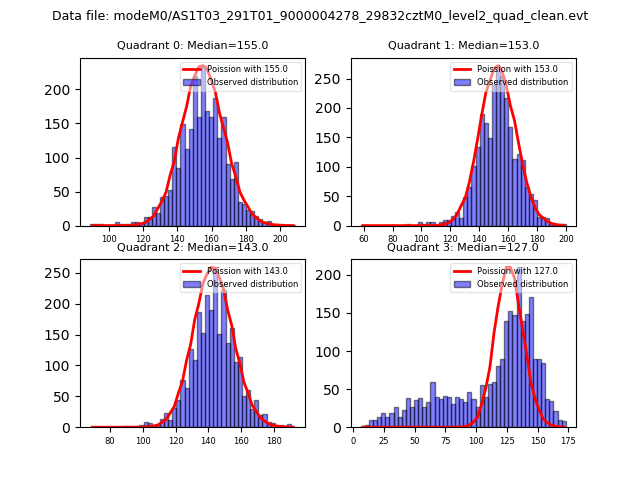 |
 |
| Quadrant-wise count rates Data is divided into 100 sec bins |
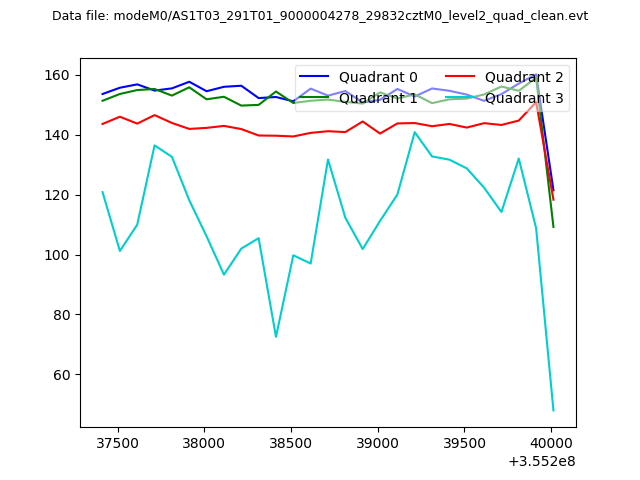 |
|
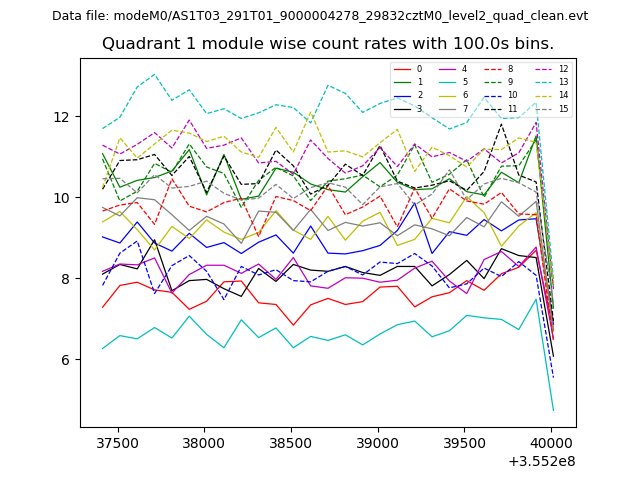
| Module-wise count rates for Quadrant A Data is divided into 100 sec bins |
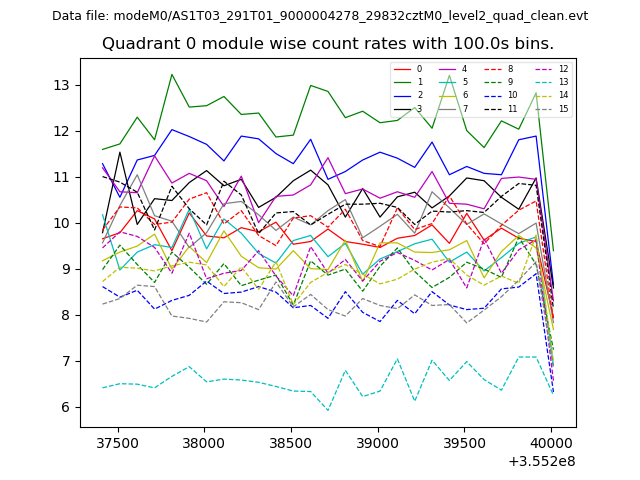 |
 |
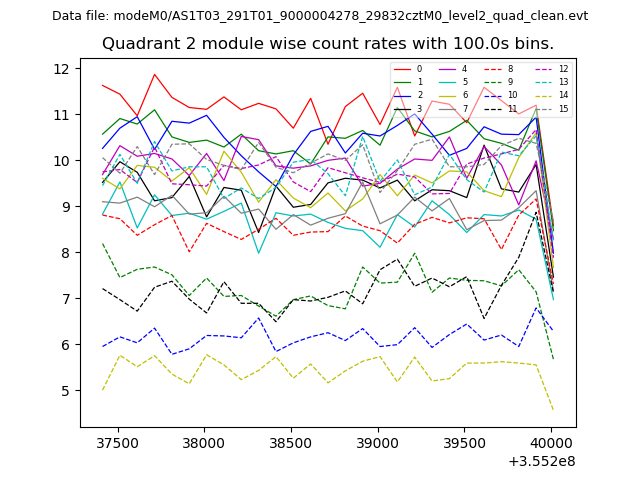
| Module-wise count rates for Quadrant B Data is divided into 100 sec bins |
 |
 |
| Module-wise count rates for Quadrant C Data is divided into 100 sec bins |
 |
 |
| Module-wise count rates for Quadrant D Data is divided into 100 sec bins |
 |
 |
| Parameter | Plot |
|---|---|
| CZT HV Monitor | 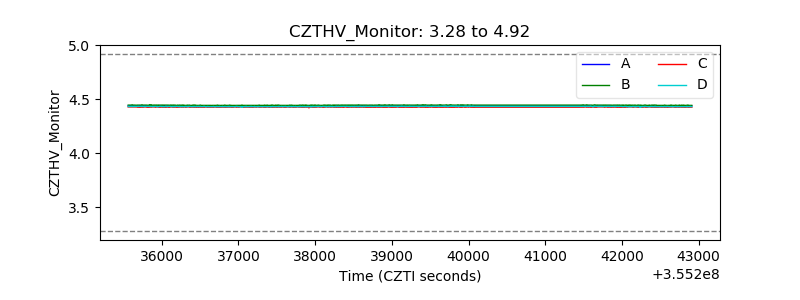 |
| D_VDD | 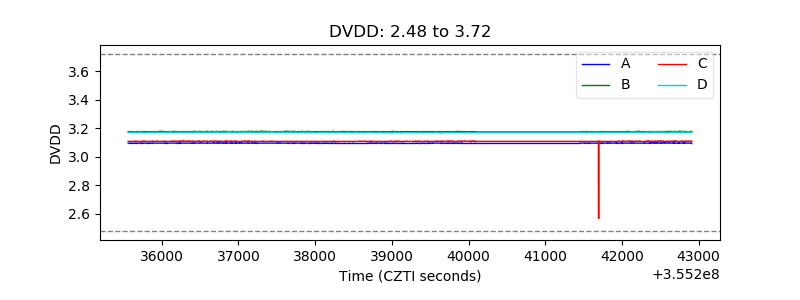 |
| Temperature 1 | 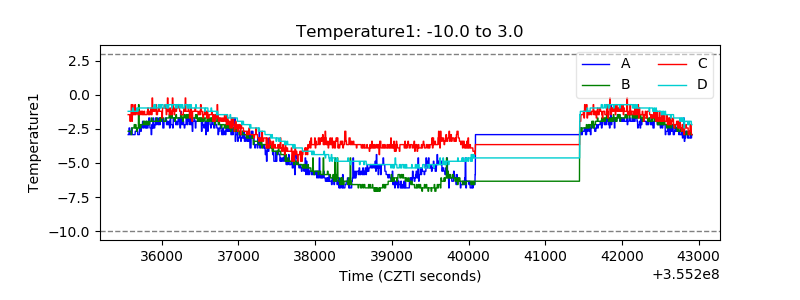 |
| Veto HV Monitor | 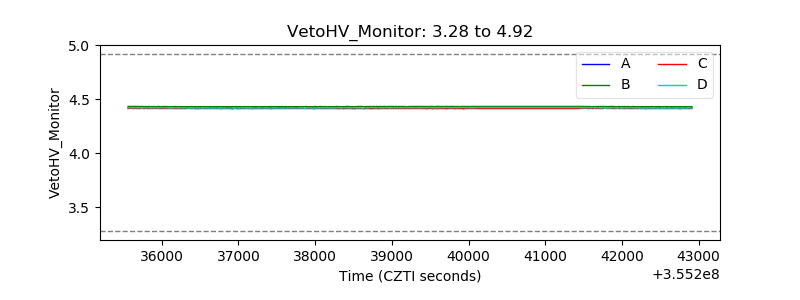 |
| Veto LLD | 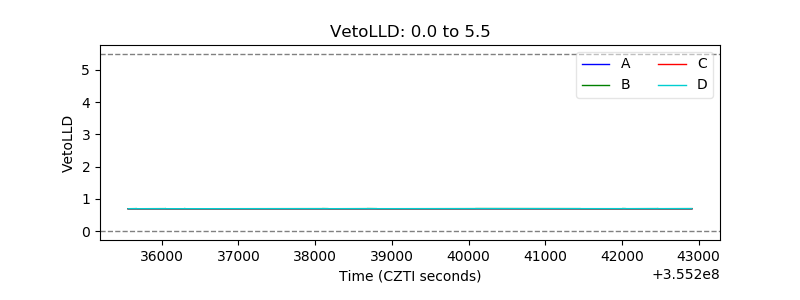 |
| Alpha Counter | 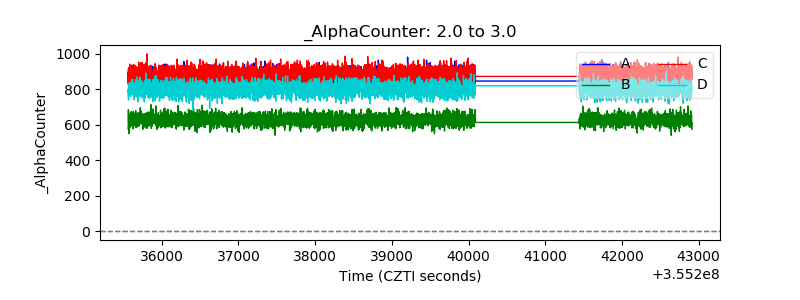 |
| _CPM_Rate | 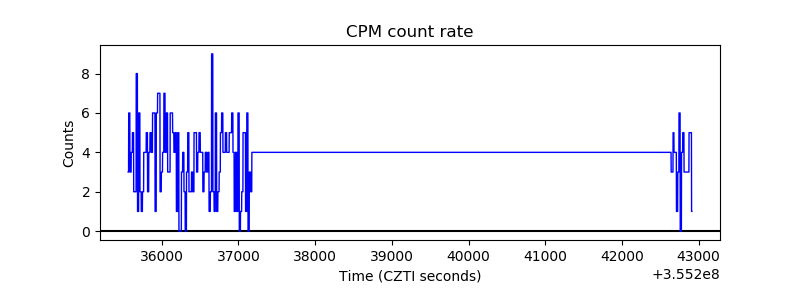 |
| CZT Counter | 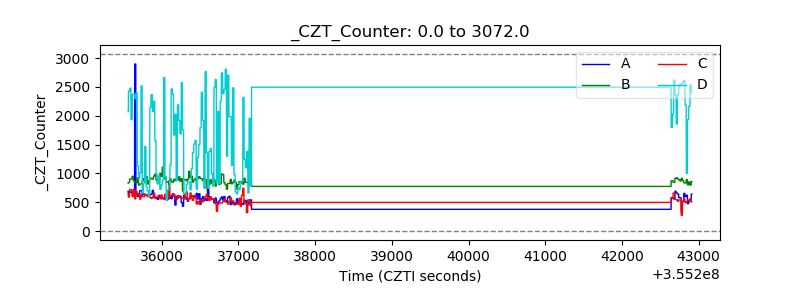 |
| +2.5 Volts monitor |  |
| +5 Volts monitor |  |
| _ROLL_ROT | 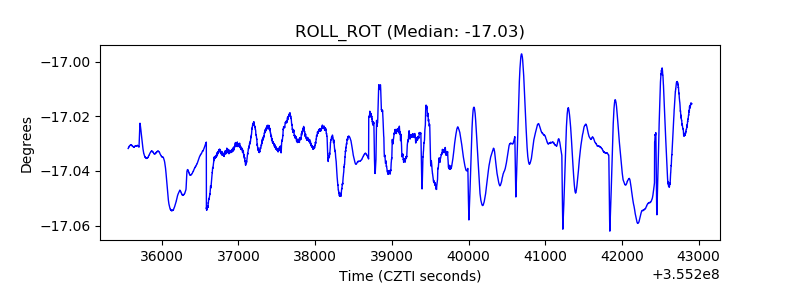 |
| _Roll_DEC | 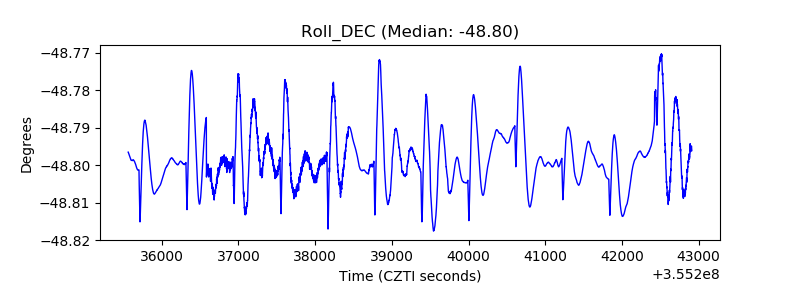 |
| _Roll_RA | 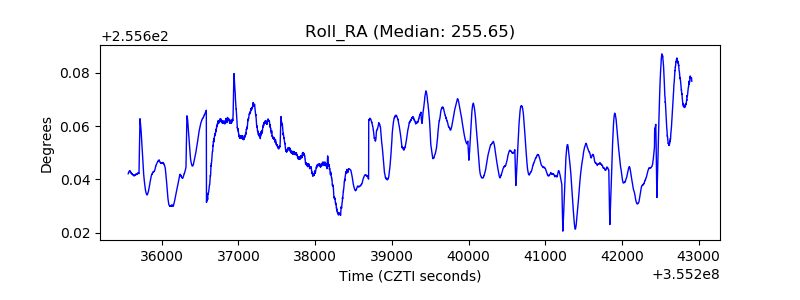 |
| Veto Counter | 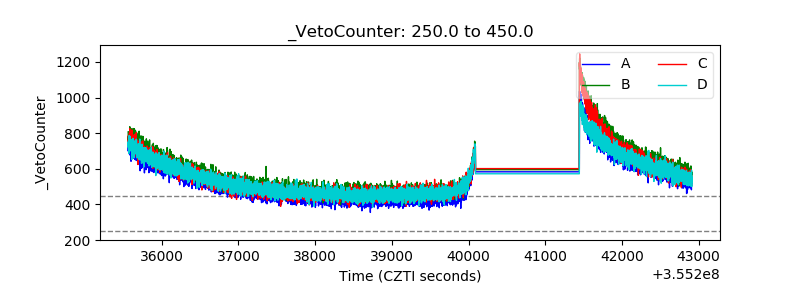 |