| Param | Original file | Final file |
|---|---|---|
| Filename | modeM0/AS1T03_291T01_9000004278_29835cztM0_level2.evt | modeM0/AS1T03_291T01_9000004278_29835cztM0_level2_quad_clean.evt |
| Size (bytes) | 731,344,320 | 96,819,840 |
| Size | 697.5 MB | 92.3 MB |
| Events in quadrant A | 3,439,164 | 668,153 |
| Events in quadrant B | 5,309,463 | 672,742 |
| Events in quadrant C | 3,315,799 | 630,949 |
| Events in quadrant D | 9,644,987 | 505,581 |
| Mode SS | |||
|---|---|---|---|
| Quadrant | BADHDUFLAG | Total packets | Discarded packets |
| A | 0 | 132 | 0 |
| B | 0 | 132 | 0 |
| C | 0 | 132 | 0 |
| D | 0 | 132 | 0 |
| Mode M0 | |||
|---|---|---|---|
| Quadrant | BADHDUFLAG | Total packets | Discarded packets |
| A | 0 | 14194 | 2 |
| B | 0 | 19926 | 2 |
| C | 0 | 13730 | 2 |
| D | 0 | 33202 | 2 |
| Mode M9 | |||
|---|---|---|---|
| Quadrant | BADHDUFLAG | Total packets | Discarded packets |
| A | 0 | 19 | 0 |
| B | 0 | 20 | 0 |
| C | 0 | 20 | 0 |
| D | 0 | 20 | 0 |
| Quadrant | Total seconds | Saturated seconds | Saturation percentage |
|---|---|---|---|
| A | 6511 | 79 | 1.213331% |
| B | 6511 | 138 | 2.119490% |
| C | 6511 | 76 | 1.167255% |
| D | 6511 | 2099 | 32.237751% |
Noise dominated data is calculated using 1-second bins in cleaned event files. If a bin has >2000 counts, and if more than 50% of those come from <1% of pixels, then it is considered to be noise-dominated and hence unusable.
| Quadrant | # 1 sec bins | Bins with >0 counts | Bins with >2000 counts | High rate bins dominated by noise | Noise dominated (total time) | Noise dominated (detector-on time) | Marked lightcurve |
|---|---|---|---|---|---|---|---|
| A | 7586 | 6512 | 22 | 22 | 0.29% | 0.34% | 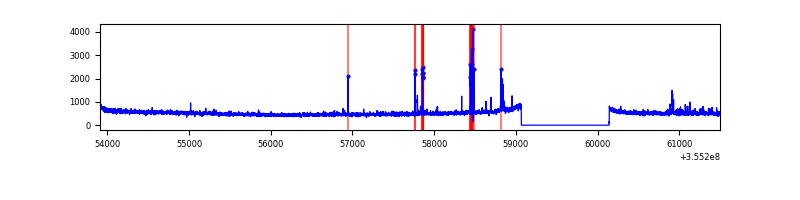 |
| B | 7586 | 6512 | 2 | 2 | 0.03% | 0.03% | 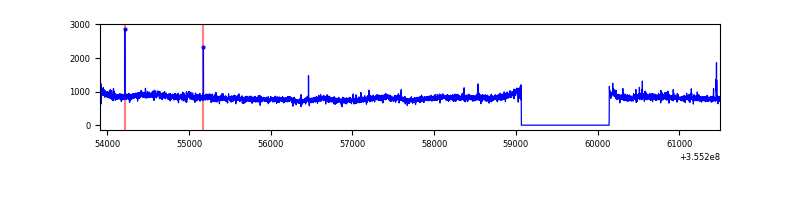 |
| C | 7586 | 6512 | 0 | 0 | 0.00% | 0.00% | 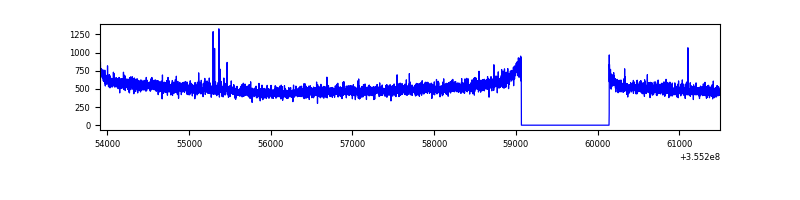 |
| D | 7586 | 6512 | 1931 | 1931 | 25.45% | 29.65% | 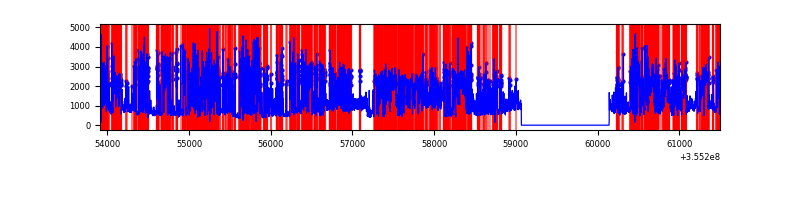 |
Top three noisy pixels from each quadrant. If the there are fewer than three noisy pixels in the level2.evt file, extra rows are filled as -1
| Pixel properties | Quadrant properties | ||||||
|---|---|---|---|---|---|---|---|
| Quadrant | DetID | PixID | Counts | Sigma | Mean | Median | Sigma |
| A | 15 | 174 | 93747 | 547.81 | 853 | 837 | 169.6 |
| A | 14 | 238 | 27431 | 156.8 | 853 | 837 | 169.6 |
| A | 12 | 96 | 13981 | 77.5 | 853 | 837 | 169.6 |
| B | 6 | 159 | 1940901 | 12148.15 | 849 | 829 | 159.7 |
| B | 12 | 111 | 18764 | 112.3 | 849 | 829 | 159.7 |
| B | 11 | 111 | 16995 | 101.23 | 849 | 829 | 159.7 |
| C | 14 | 238 | 134786 | 714.4 | 808 | 813 | 187.5 |
| C | 2 | 114 | 15662 | 79.18 | 808 | 813 | 187.5 |
| C | 10 | 22 | 11509 | 57.04 | 808 | 813 | 187.5 |
| D | 7 | 80 | 6493326 | 39713.99 | 689 | 670 | 163.5 |
| D | 8 | 195 | 405273 | 2474.86 | 689 | 670 | 163.5 |
| D | 13 | 189 | 56548 | 341.79 | 689 | 670 | 163.5 |
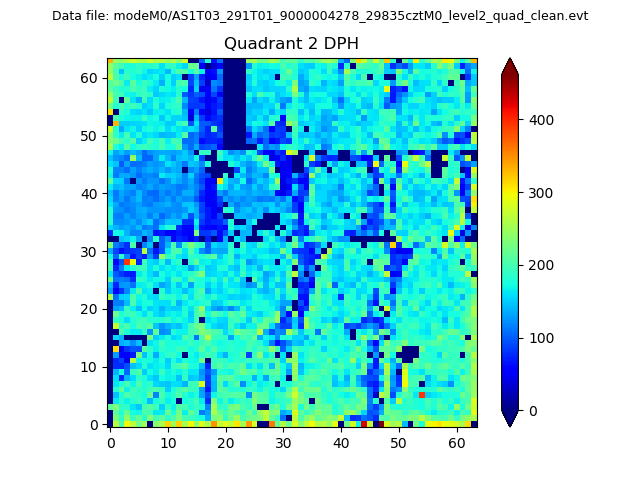
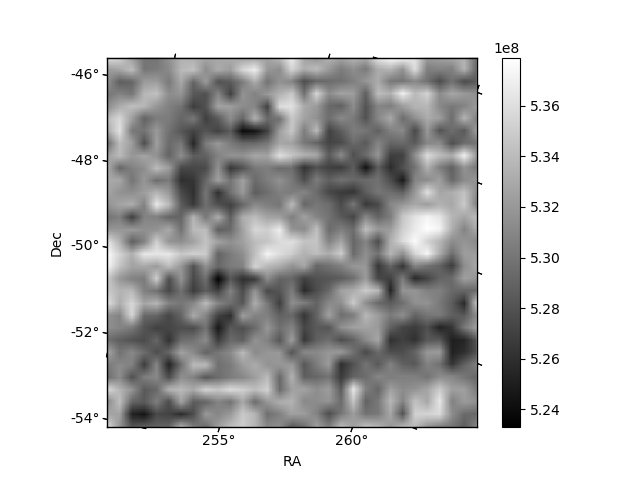
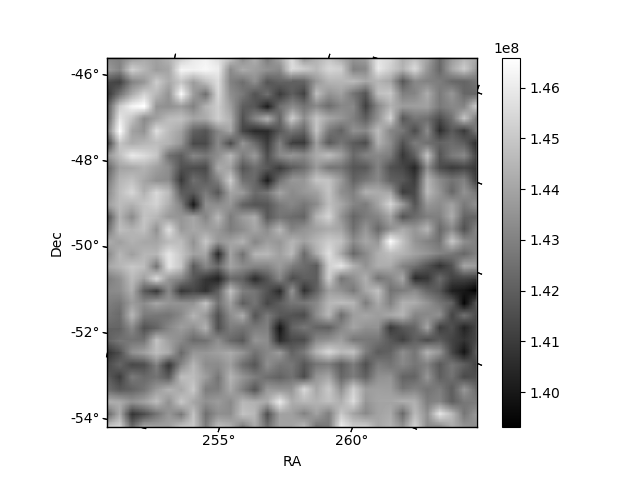
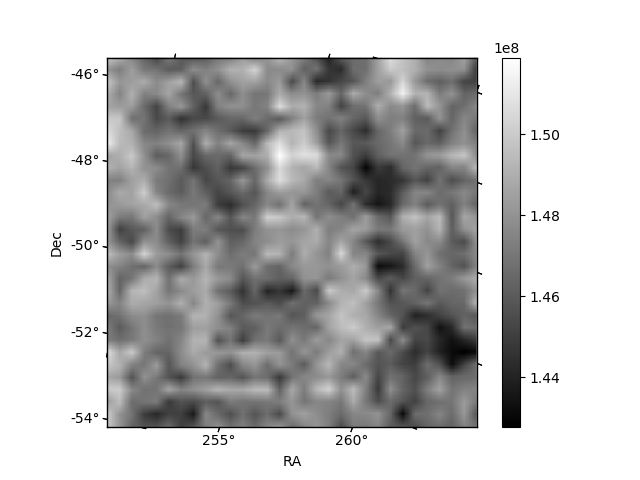
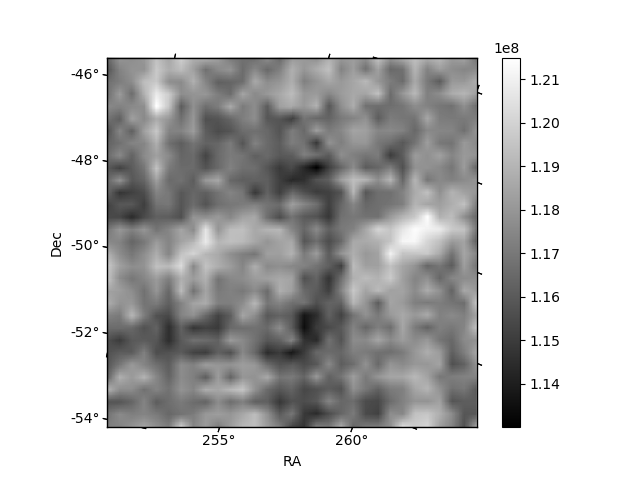
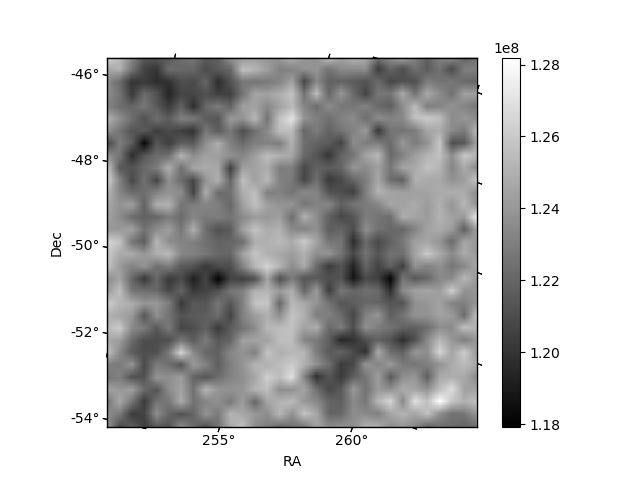
Histogram calculated using DETX and DETY for each event in the final _common_clean file
| Quadrant A | 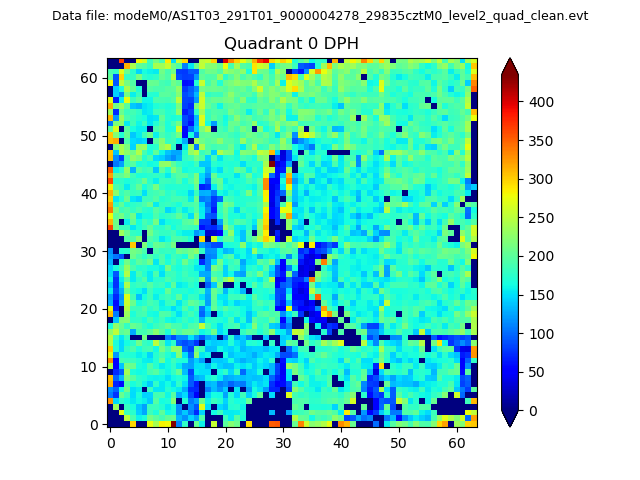 |
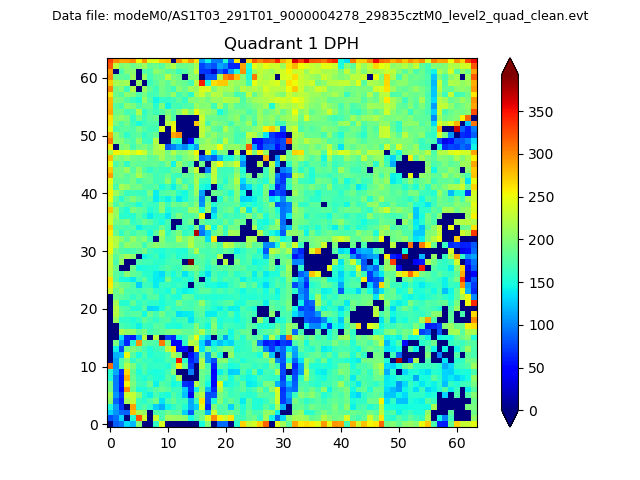 |
Quadrant B |
|---|---|---|---|
| Quadrant D | 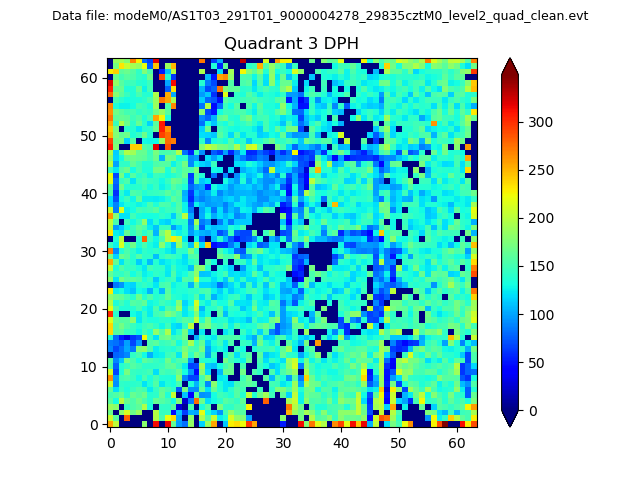 |
 |
Quadrant C |
| Plot type | Count rate plots | Images |
|---|---|---|
| Comparison with Poisson distribution Blue bars denote a histogram of data divided into 1 sec bins. Red curve is a Poisson curve with rate = median count rate of data. |
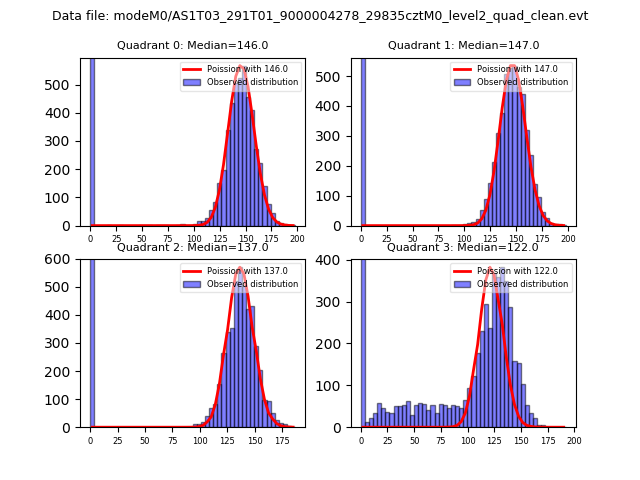 |
 |
| Quadrant-wise count rates Data is divided into 100 sec bins |
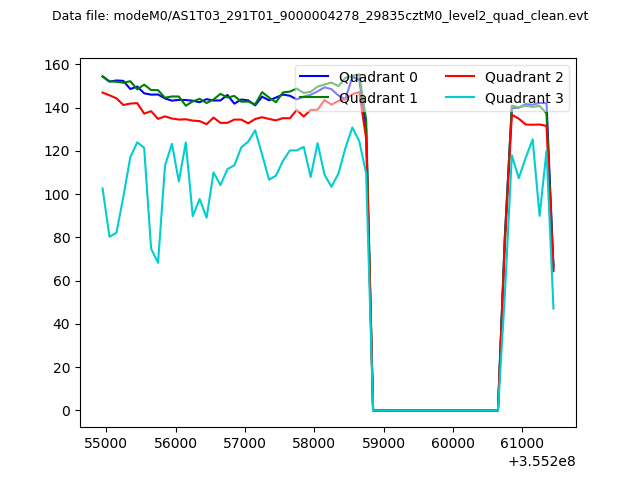 |
|
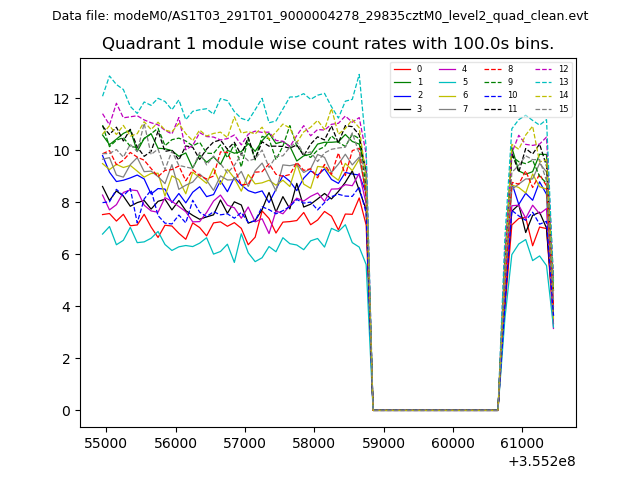
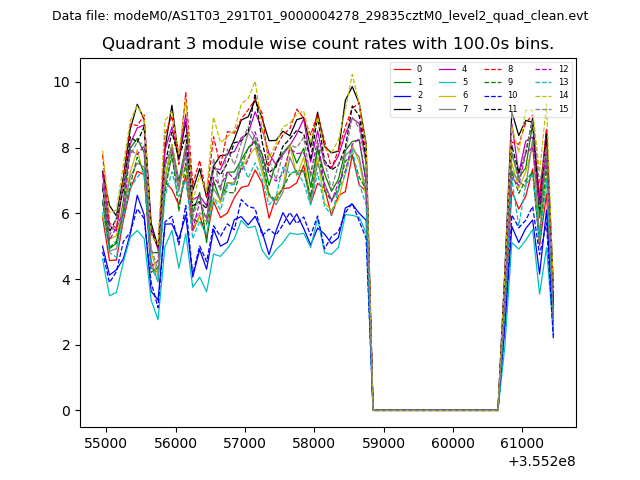
| Module-wise count rates for Quadrant A Data is divided into 100 sec bins |
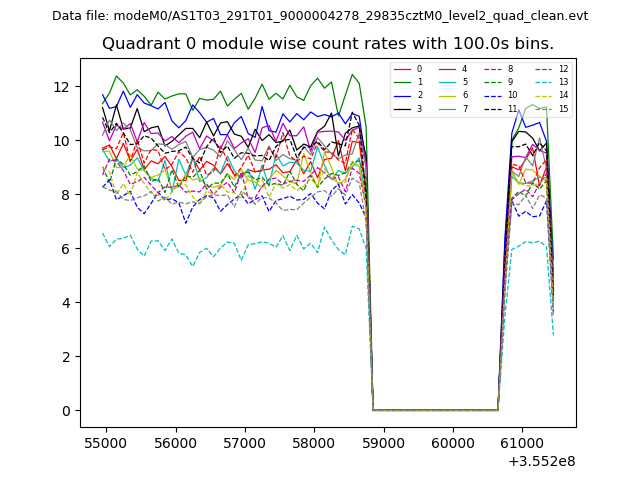 |
 |
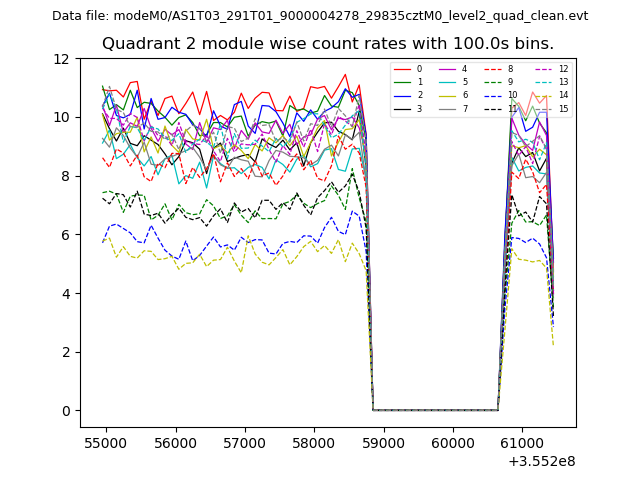
| Module-wise count rates for Quadrant B Data is divided into 100 sec bins |
 |
 |
| Module-wise count rates for Quadrant C Data is divided into 100 sec bins |
 |
 |
| Module-wise count rates for Quadrant D Data is divided into 100 sec bins |
 |
 |
| Parameter | Plot |
|---|---|
| CZT HV Monitor | 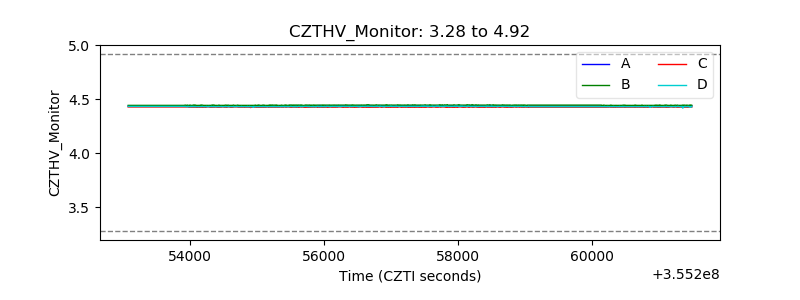 |
| D_VDD | 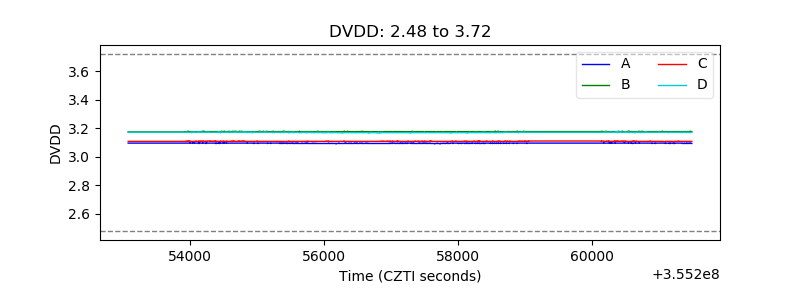 |
| Temperature 1 |  |
| Veto HV Monitor | 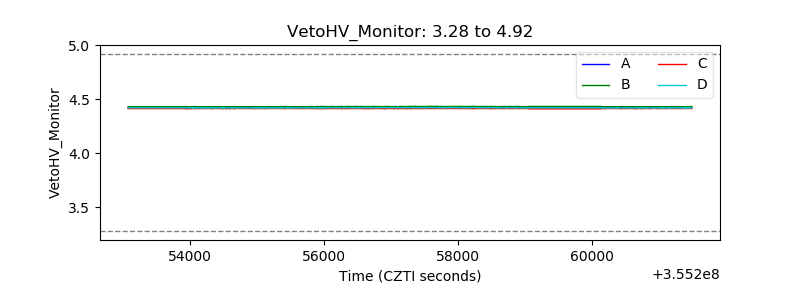 |
| Veto LLD | 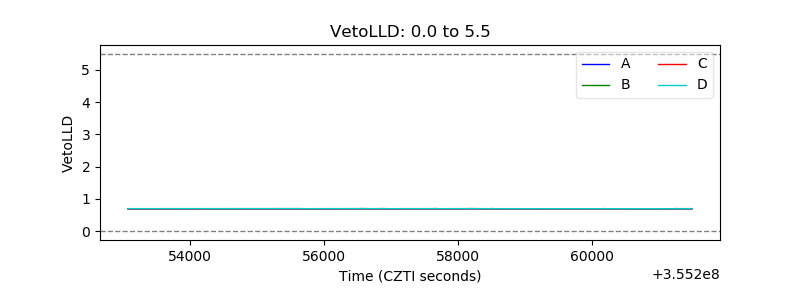 |
| Alpha Counter | 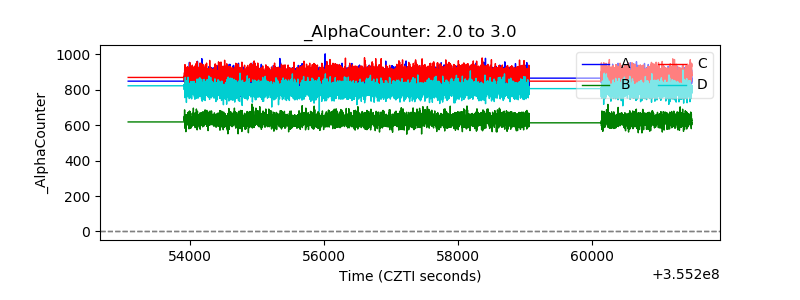 |
| _CPM_Rate | 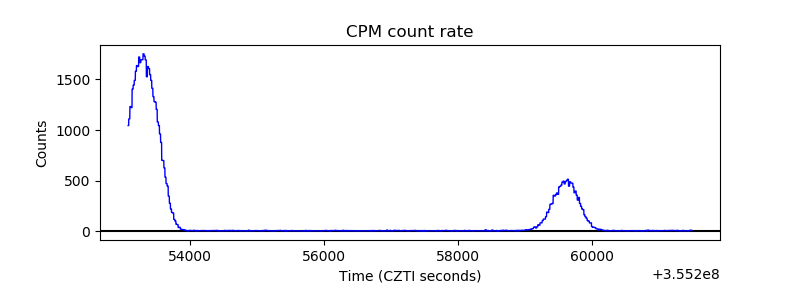 |
| CZT Counter | 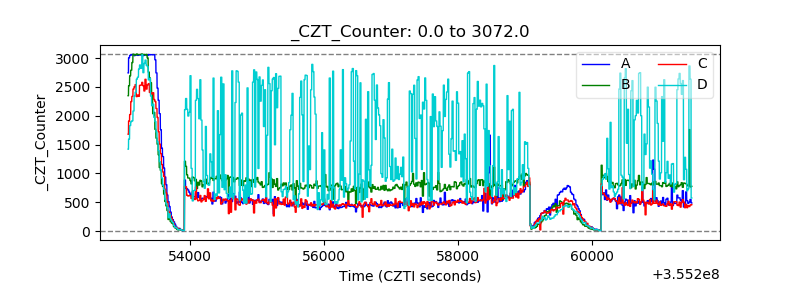 |
| +2.5 Volts monitor |  |
| +5 Volts monitor |  |
| _ROLL_ROT | 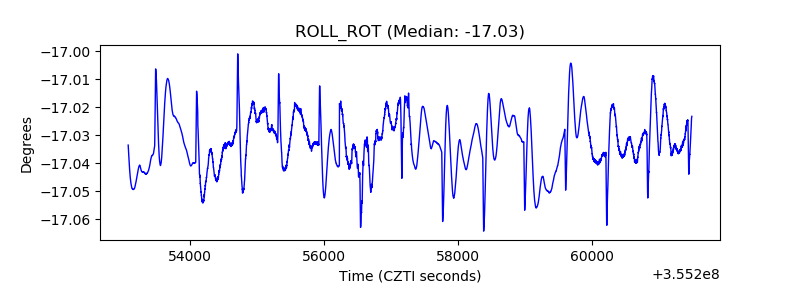 |
| _Roll_DEC | 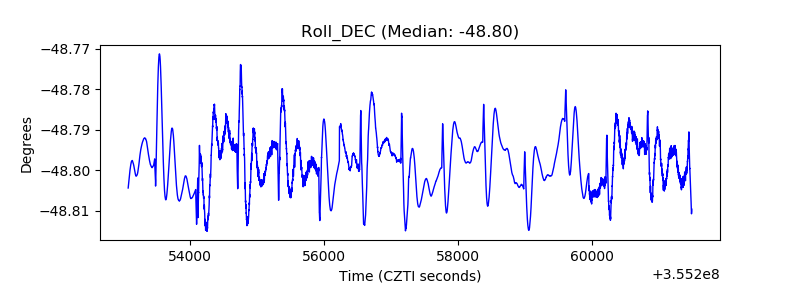 |
| _Roll_RA | 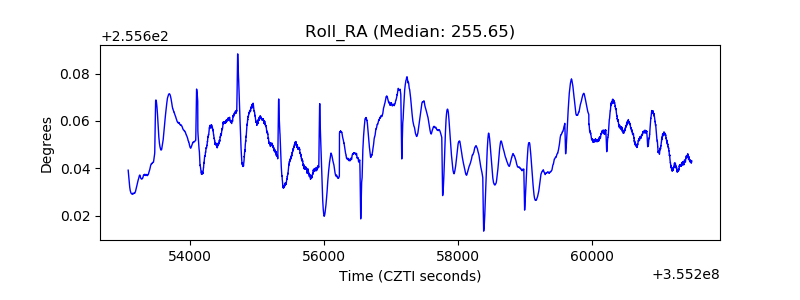 |
| Veto Counter | 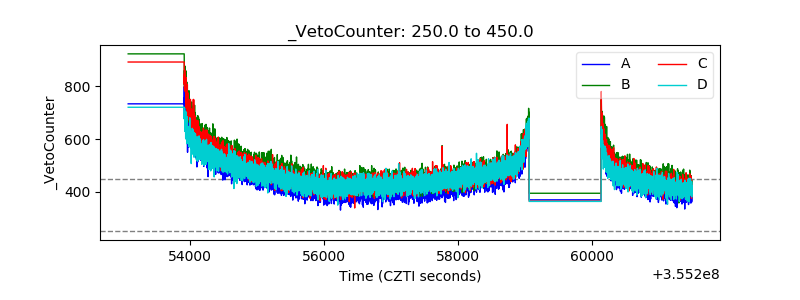 |