| Param | Original file | Final file |
|---|---|---|
| Filename | modeM0/AS1T03_291T01_9000004278_29836cztM0_level2.evt | modeM0/AS1T03_291T01_9000004278_29836cztM0_level2_quad_clean.evt |
| Size (bytes) | 645,053,760 | 103,962,240 |
| Size | 615.2 MB | 99.1 MB |
| Events in quadrant A | 3,680,953 | 690,298 |
| Events in quadrant B | 5,531,869 | 693,661 |
| Events in quadrant C | 3,571,101 | 656,443 |
| Events in quadrant D | 6,274,980 | 617,050 |
| Mode SS | |||
|---|---|---|---|
| Quadrant | BADHDUFLAG | Total packets | Discarded packets |
| A | 0 | 144 | 0 |
| B | 0 | 144 | 0 |
| C | 0 | 144 | 0 |
| D | 0 | 144 | 0 |
| Mode M0 | |||
|---|---|---|---|
| Quadrant | BADHDUFLAG | Total packets | Discarded packets |
| A | 0 | 15283 | 2 |
| B | 0 | 21344 | 2 |
| C | 0 | 14996 | 2 |
| D | 0 | 23326 | 2 |
| Mode M9 | |||
|---|---|---|---|
| Quadrant | BADHDUFLAG | Total packets | Discarded packets |
| A | 0 | 6 | 0 |
| B | 0 | 7 | 0 |
| C | 0 | 7 | 0 |
| D | 0 | 7 | 0 |
| Quadrant | Total seconds | Saturated seconds | Saturation percentage |
|---|---|---|---|
| A | 7045 | 76 | 1.078779% |
| B | 7045 | 127 | 1.802697% |
| C | 7045 | 111 | 1.575586% |
| D | 7045 | 704 | 9.992903% |
Noise dominated data is calculated using 1-second bins in cleaned event files. If a bin has >2000 counts, and if more than 50% of those come from <1% of pixels, then it is considered to be noise-dominated and hence unusable.
| Quadrant | # 1 sec bins | Bins with >0 counts | Bins with >2000 counts | High rate bins dominated by noise | Noise dominated (total time) | Noise dominated (detector-on time) | Marked lightcurve |
|---|---|---|---|---|---|---|---|
| A | 7690 | 7046 | 23 | 23 | 0.30% | 0.33% | 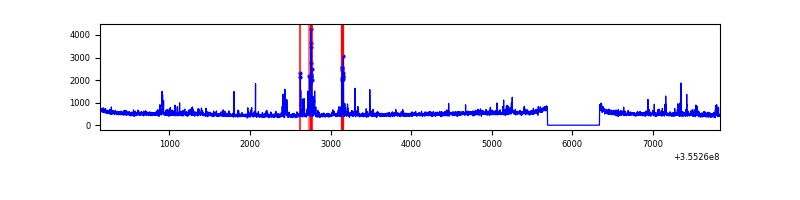 |
| B | 7690 | 7046 | 1 | 1 | 0.01% | 0.01% | 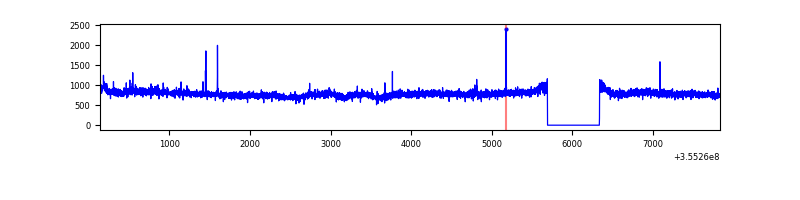 |
| C | 7690 | 7046 | 19 | 19 | 0.25% | 0.27% |  |
| D | 7689 | 7045 | 611 | 611 | 7.95% | 8.67% | 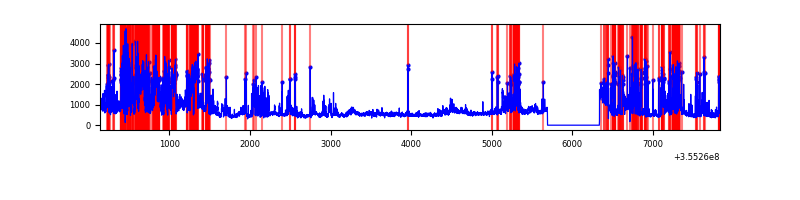 |
Top three noisy pixels from each quadrant. If the there are fewer than three noisy pixels in the level2.evt file, extra rows are filled as -1
| Pixel properties | Quadrant properties | ||||||
|---|---|---|---|---|---|---|---|
| Quadrant | DetID | PixID | Counts | Sigma | Mean | Median | Sigma |
| A | 14 | 238 | 261709 | 1481.62 | 879 | 864 | 176.1 |
| A | 13 | 254 | 13574 | 72.19 | 879 | 864 | 176.1 |
| A | 15 | 174 | 11930 | 62.86 | 879 | 864 | 176.1 |
| B | 6 | 159 | 2076645 | 12513.44 | 873 | 852 | 165.9 |
| B | 12 | 111 | 20184 | 116.54 | 873 | 852 | 165.9 |
| B | 11 | 111 | 18252 | 104.89 | 873 | 852 | 165.9 |
| C | 10 | 22 | 141565 | 717.12 | 835 | 841 | 196.2 |
| C | 14 | 238 | 138949 | 703.79 | 835 | 841 | 196.2 |
| C | 3 | 233 | 19958 | 97.42 | 835 | 841 | 196.2 |
| D | 7 | 80 | 2576847 | 13482.67 | 809 | 789 | 191.1 |
| D | 8 | 195 | 524243 | 2739.67 | 809 | 789 | 191.1 |
| D | 2 | 250 | 65291 | 337.59 | 809 | 789 | 191.1 |
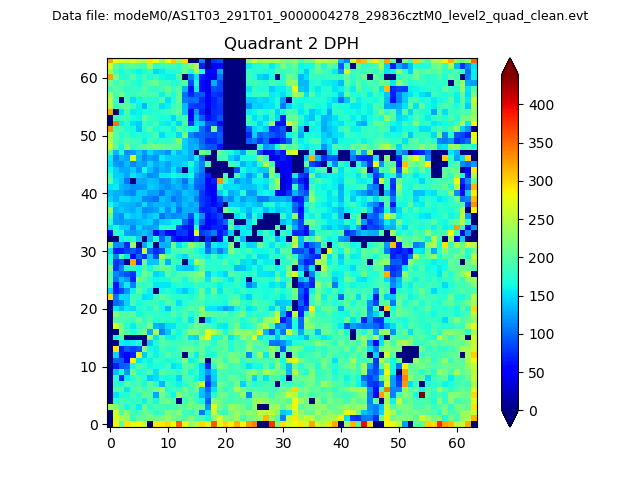
Histogram calculated using DETX and DETY for each event in the final _common_clean file
| Quadrant A | 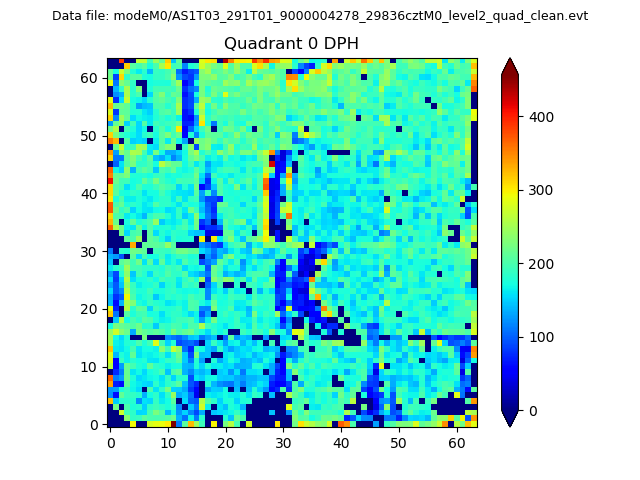 |
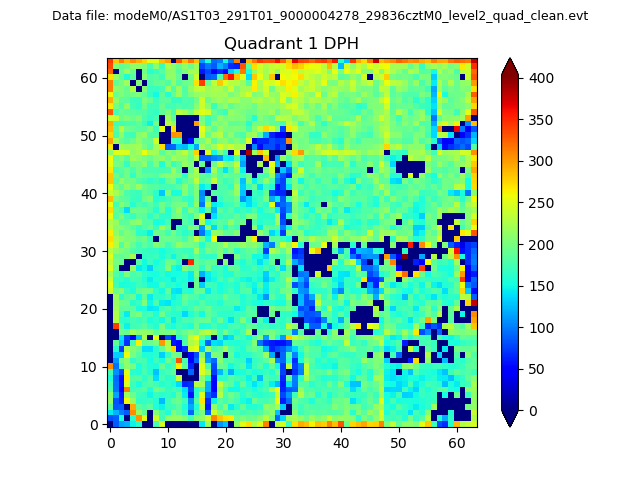 |
Quadrant B |
|---|---|---|---|
| Quadrant D | 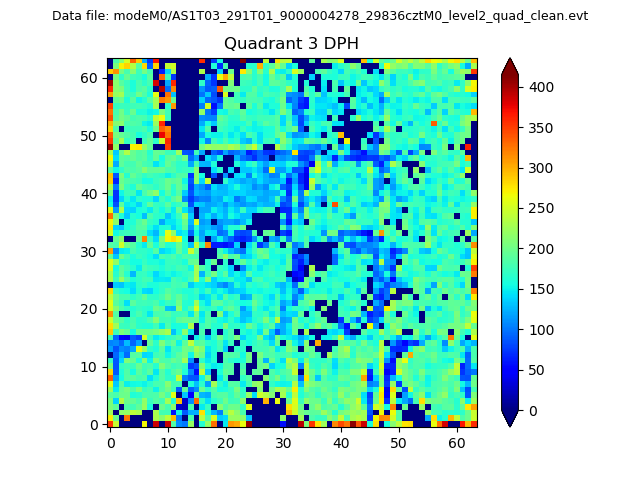 |
 |
Quadrant C |
| Plot type | Count rate plots | Images |
|---|---|---|
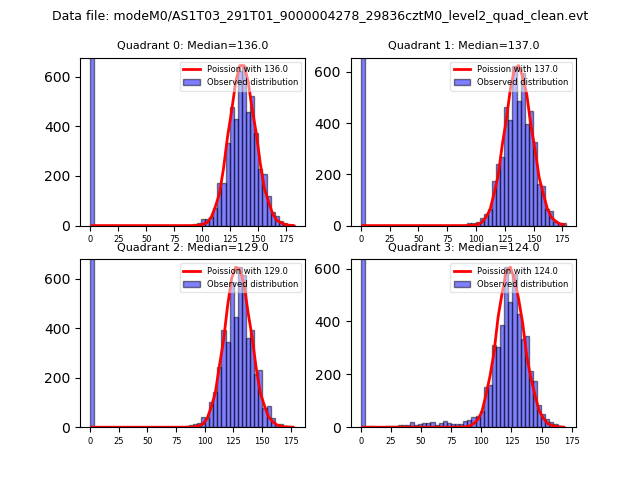
| Comparison with Poisson distribution Blue bars denote a histogram of data divided into 1 sec bins. Red curve is a Poisson curve with rate = median count rate of data. |
 |
 |
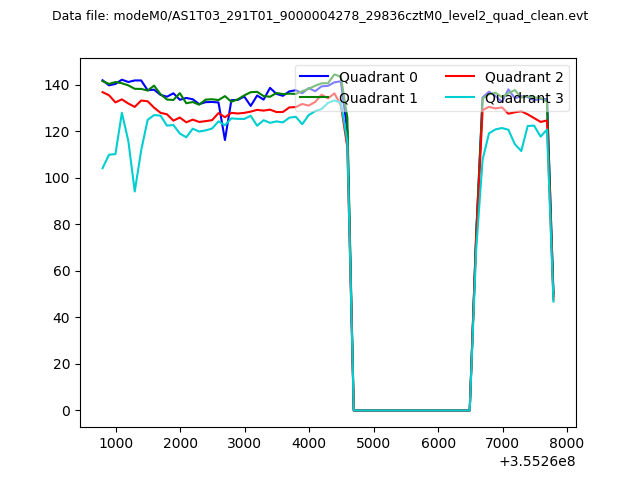
| Quadrant-wise count rates Data is divided into 100 sec bins |
 |
|
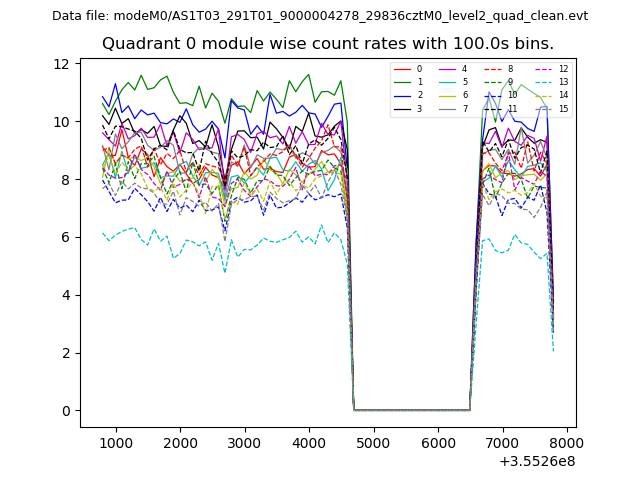
| Module-wise count rates for Quadrant A Data is divided into 100 sec bins |
 |
 |
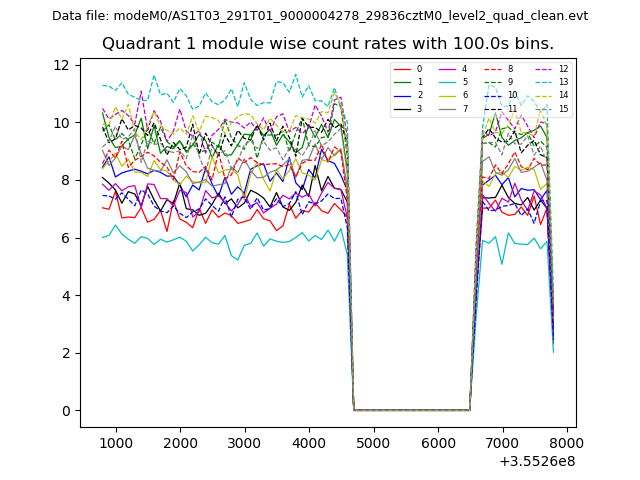
| Module-wise count rates for Quadrant B Data is divided into 100 sec bins |
 |
 |
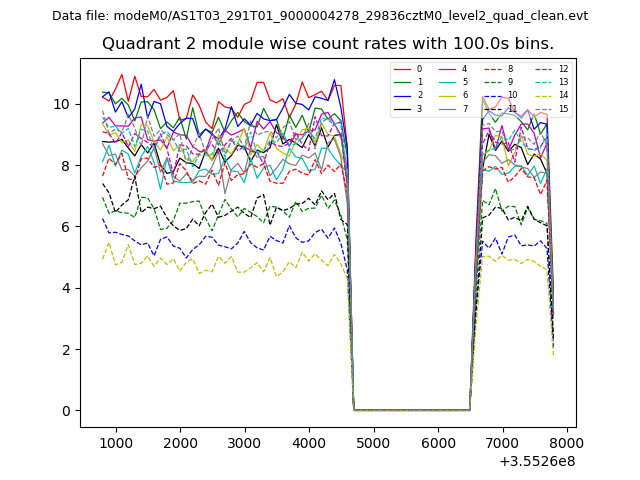
| Module-wise count rates for Quadrant C Data is divided into 100 sec bins |
 |
 |
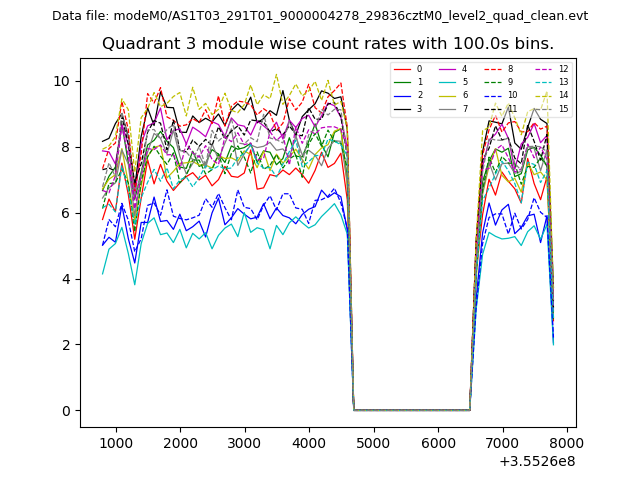
| Module-wise count rates for Quadrant D Data is divided into 100 sec bins |
 |
 |
| Parameter | Plot |
|---|---|
| CZT HV Monitor |  |
| D_VDD | 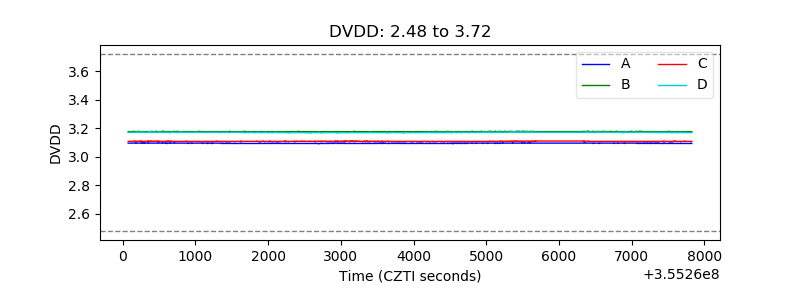 |
| Temperature 1 | 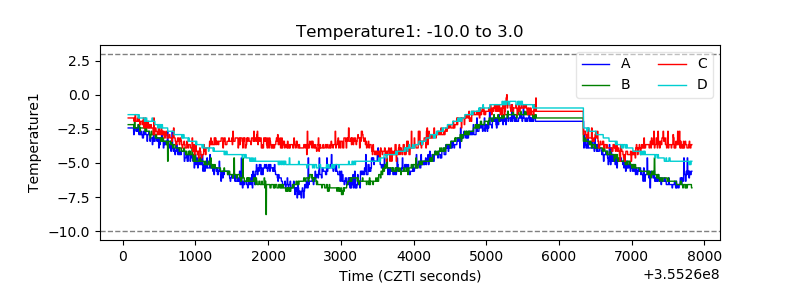 |
| Veto HV Monitor | 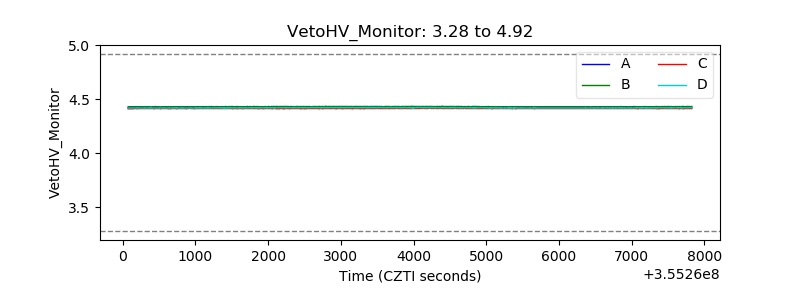 |
| Veto LLD | 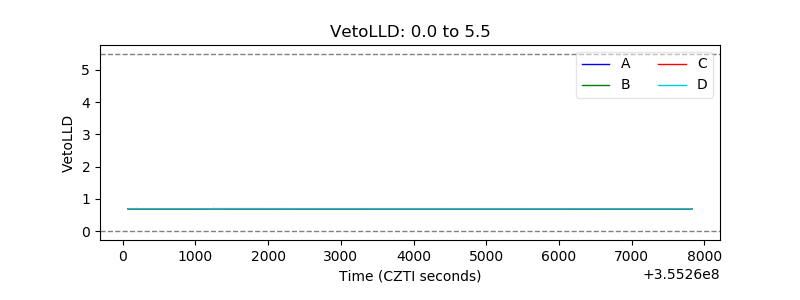 |
| Alpha Counter | 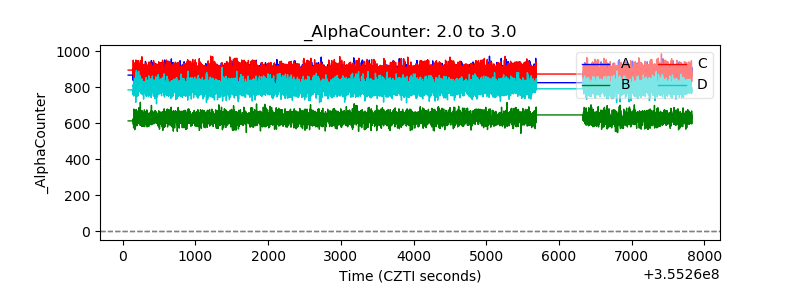 |
| _CPM_Rate | 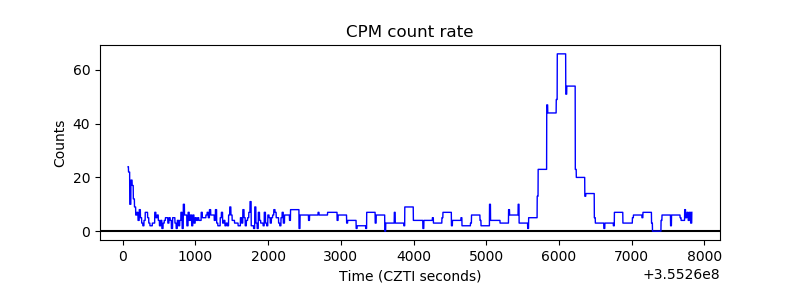 |
| CZT Counter | 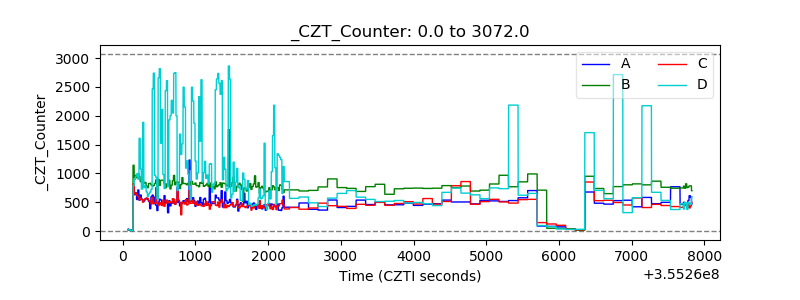 |
| +2.5 Volts monitor |  |
| +5 Volts monitor |  |
| _ROLL_ROT | 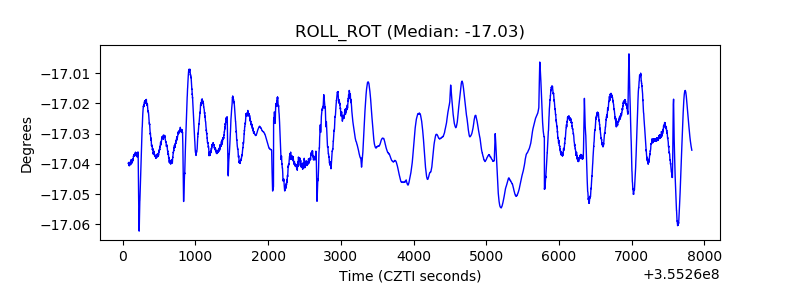 |
| _Roll_DEC | 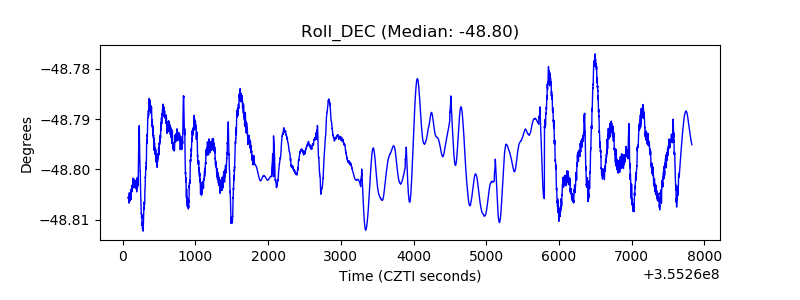 |
| _Roll_RA | 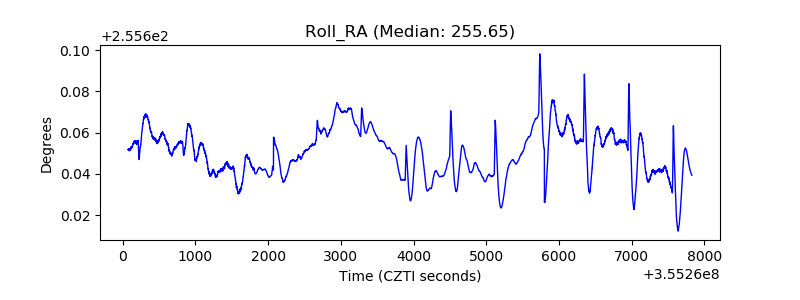 |
| Veto Counter | 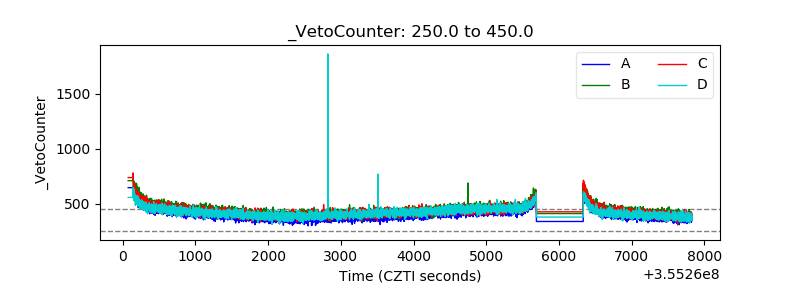 |