| Param | Original file | Final file |
|---|---|---|
| Filename | modeM0/AS1T03_291T01_9000004278_29838cztM0_level2.evt | modeM0/AS1T03_291T01_9000004278_29838cztM0_level2_quad_clean.evt |
| Size (bytes) | 747,362,880 | 105,707,520 |
| Size | 712.7 MB | 100.8 MB |
| Events in quadrant A | 3,556,448 | 718,796 |
| Events in quadrant B | 5,843,178 | 718,248 |
| Events in quadrant C | 3,711,945 | 684,320 |
| Events in quadrant D | 9,018,001 | 559,639 |
| Mode SS | |||
|---|---|---|---|
| Quadrant | BADHDUFLAG | Total packets | Discarded packets |
| A | 0 | 152 | 0 |
| B | 0 | 152 | 0 |
| C | 0 | 152 | 0 |
| D | 0 | 152 | 0 |
| Mode M0 | |||
|---|---|---|---|
| Quadrant | BADHDUFLAG | Total packets | Discarded packets |
| A | 0 | 15433 | 1 |
| B | 0 | 22764 | 1 |
| C | 0 | 15693 | 1 |
| D | 0 | 31872 | 1 |
| Mode M9 | |||
|---|---|---|---|
| Quadrant | BADHDUFLAG | Total packets | Discarded packets |
| A | 0 | 1 | 0 |
| B | 0 | 1 | 0 |
| C | 0 | 1 | 0 |
| D | 0 | 1 | 0 |
| Quadrant | Total seconds | Saturated seconds | Saturation percentage |
|---|---|---|---|
| A | 7463 | 36 | 0.482380% |
| B | 7463 | 178 | 2.385100% |
| C | 7464 | 146 | 1.956056% |
| D | 7463 | 1677 | 22.470856% |
Noise dominated data is calculated using 1-second bins in cleaned event files. If a bin has >2000 counts, and if more than 50% of those come from <1% of pixels, then it is considered to be noise-dominated and hence unusable.
| Quadrant | # 1 sec bins | Bins with >0 counts | Bins with >2000 counts | High rate bins dominated by noise | Noise dominated (total time) | Noise dominated (detector-on time) | Marked lightcurve |
|---|---|---|---|---|---|---|---|
| A | 7608 | 7464 | 7 | 7 | 0.09% | 0.09% | 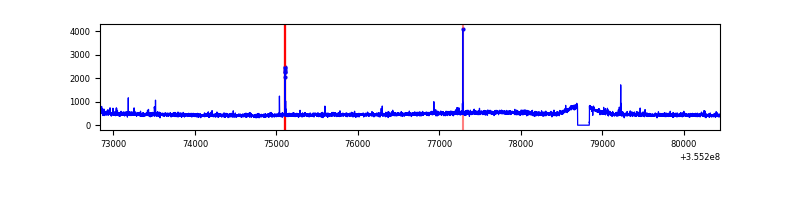 |
| B | 7608 | 7464 | 10 | 10 | 0.13% | 0.13% | 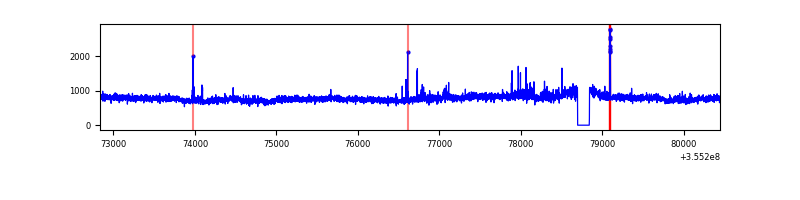 |
| C | 7609 | 7465 | 3 | 3 | 0.04% | 0.04% | 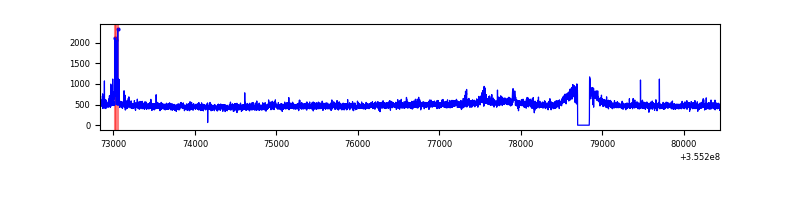 |
| D | 7608 | 7464 | 1363 | 1363 | 17.92% | 18.26% | 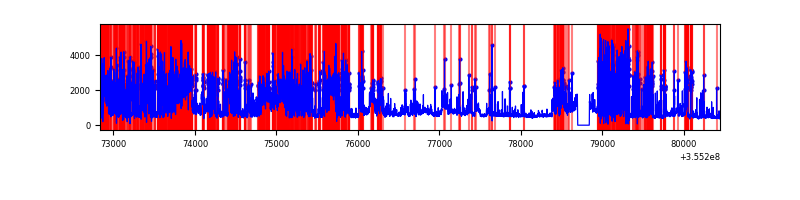 |
Top three noisy pixels from each quadrant. If the there are fewer than three noisy pixels in the level2.evt file, extra rows are filled as -1
| Pixel properties | Quadrant properties | ||||||
|---|---|---|---|---|---|---|---|
| Quadrant | DetID | PixID | Counts | Sigma | Mean | Median | Sigma |
| A | 14 | 238 | 41293 | 221.69 | 904 | 882 | 182.3 |
| A | 13 | 254 | 13984 | 71.88 | 904 | 882 | 182.3 |
| A | 3 | 1 | 9343 | 46.42 | 904 | 882 | 182.3 |
| B | 6 | 159 | 2187705 | 12575.52 | 901 | 878 | 173.9 |
| B | 0 | 189 | 64350 | 365.0 | 901 | 878 | 173.9 |
| B | 15 | 33 | 24717 | 137.09 | 901 | 878 | 173.9 |
| C | 14 | 238 | 155611 | 758.15 | 870 | 876 | 204.1 |
| C | 3 | 233 | 89917 | 436.27 | 870 | 876 | 204.1 |
| C | 10 | 22 | 38089 | 182.33 | 870 | 876 | 204.1 |
| D | 7 | 80 | 5449389 | 28807.86 | 791 | 768 | 189.1 |
| D | 8 | 195 | 403032 | 2126.84 | 791 | 768 | 189.1 |
| D | 2 | 250 | 152301 | 801.18 | 791 | 768 | 189.1 |
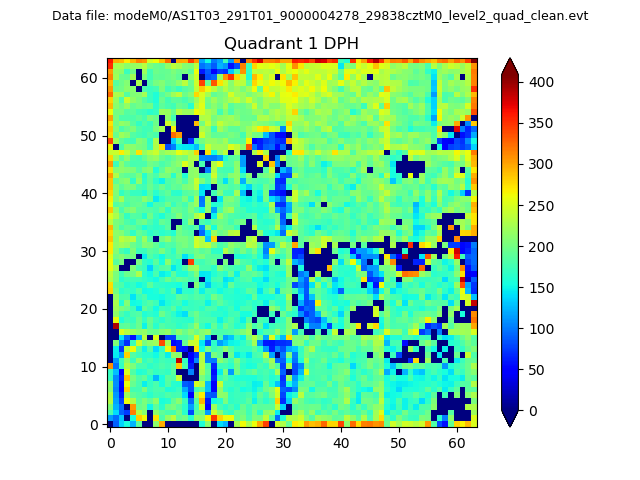
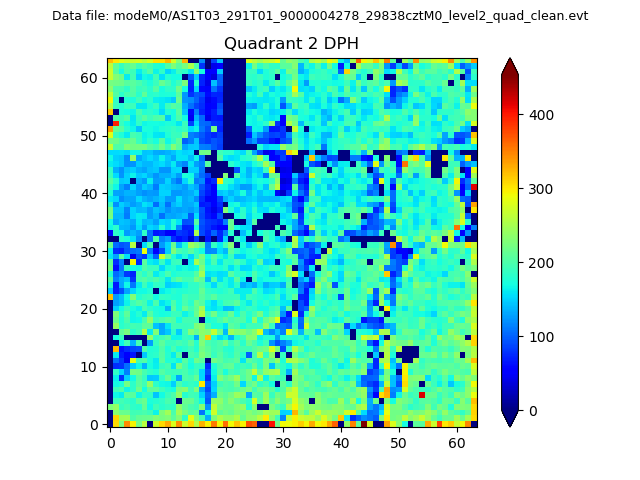
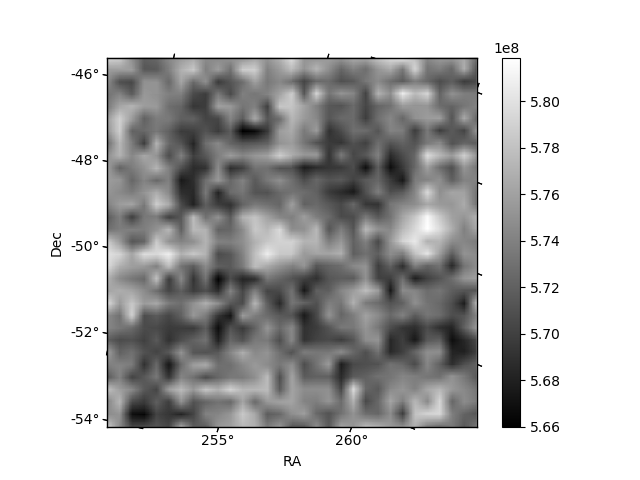
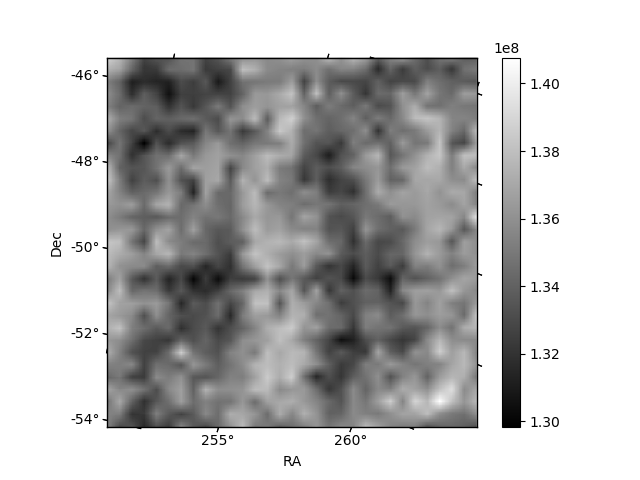
Histogram calculated using DETX and DETY for each event in the final _common_clean file
| Quadrant A |  |
 |
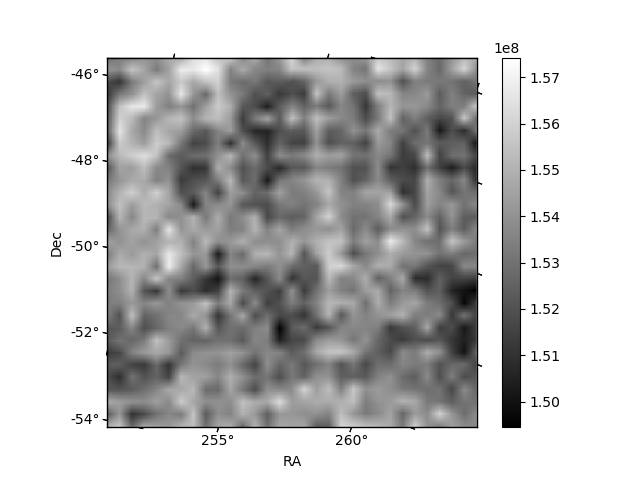
Quadrant B |
|---|---|---|---|
| Quadrant D | 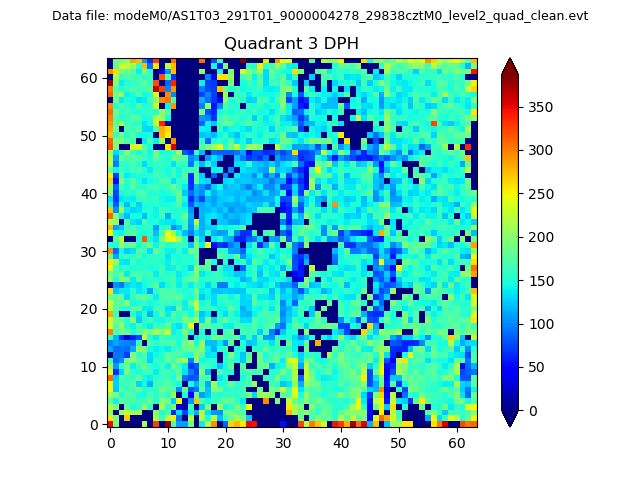 |
 |
Quadrant C |
| Plot type | Count rate plots | Images |
|---|---|---|
| Comparison with Poisson distribution Blue bars denote a histogram of data divided into 1 sec bins. Red curve is a Poisson curve with rate = median count rate of data. |
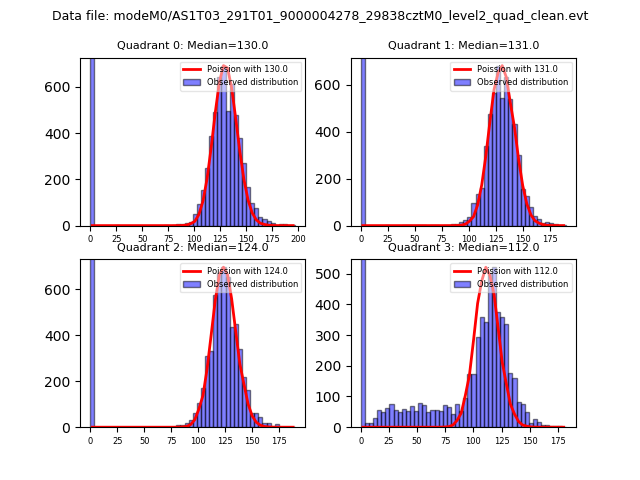 |
 |
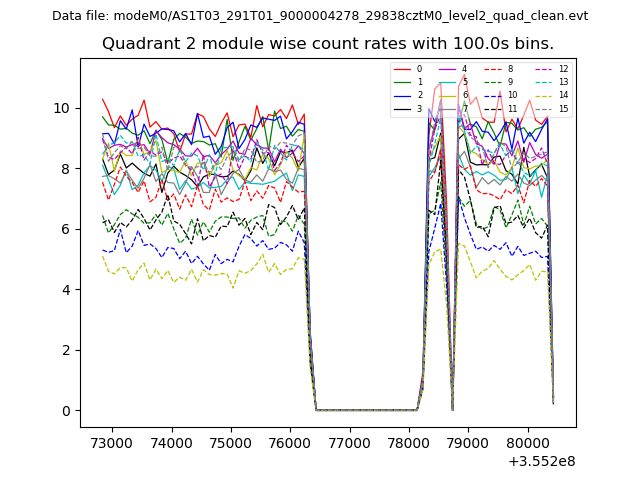
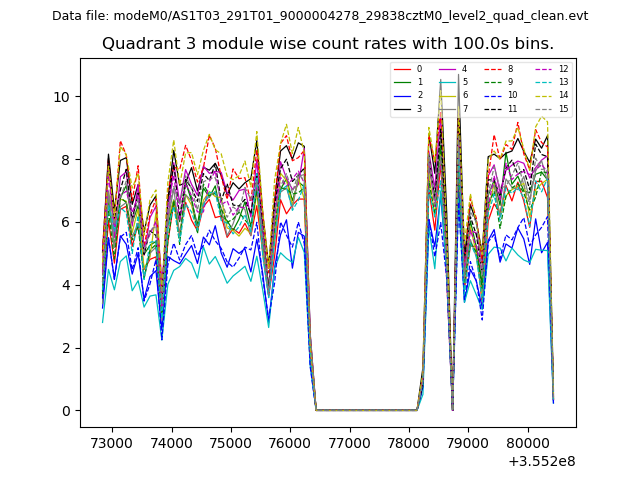
| Quadrant-wise count rates Data is divided into 100 sec bins |
 |
|
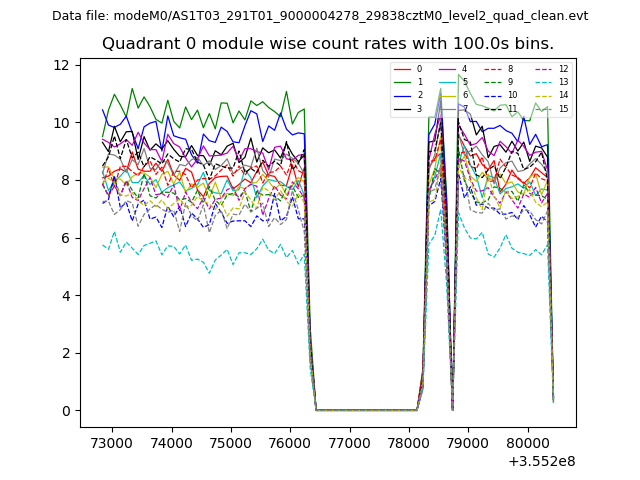
| Module-wise count rates for Quadrant A Data is divided into 100 sec bins |
 |
 |
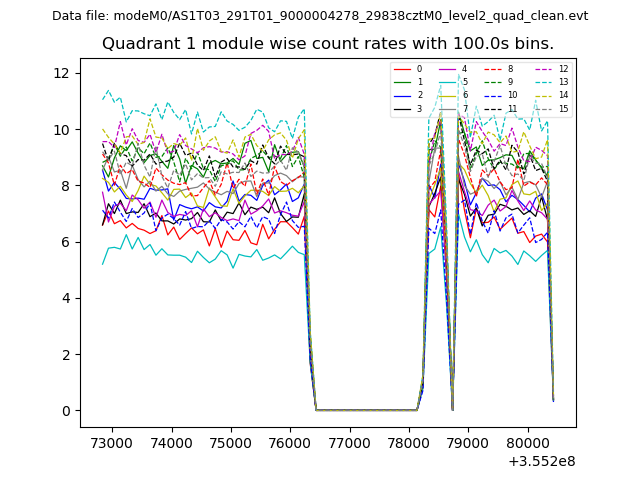
| Module-wise count rates for Quadrant B Data is divided into 100 sec bins |
 |
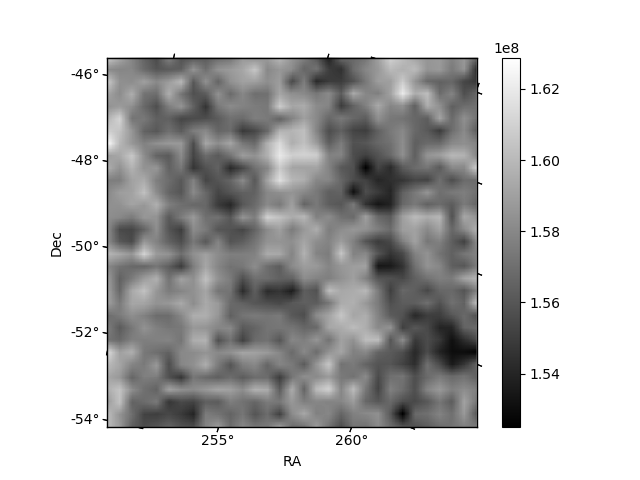 |
| Module-wise count rates for Quadrant C Data is divided into 100 sec bins |
 |
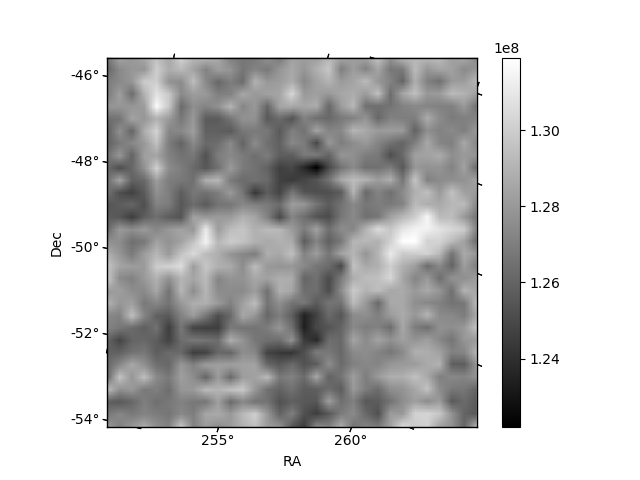 |
| Module-wise count rates for Quadrant D Data is divided into 100 sec bins |
 |
 |
| Parameter | Plot |
|---|---|
| CZT HV Monitor | 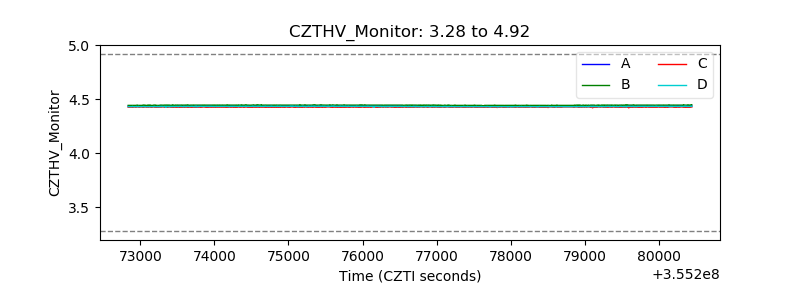 |
| D_VDD | 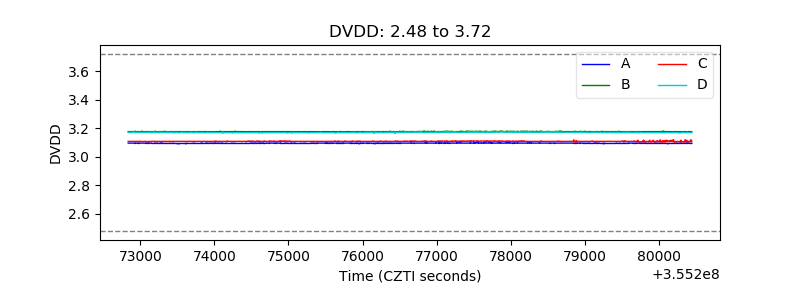 |
| Temperature 1 | 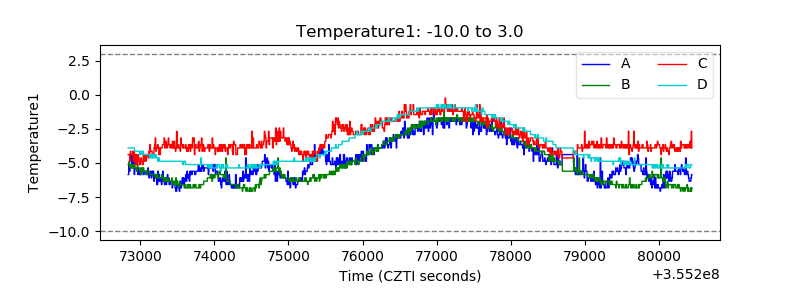 |
| Veto HV Monitor |  |
| Veto LLD | 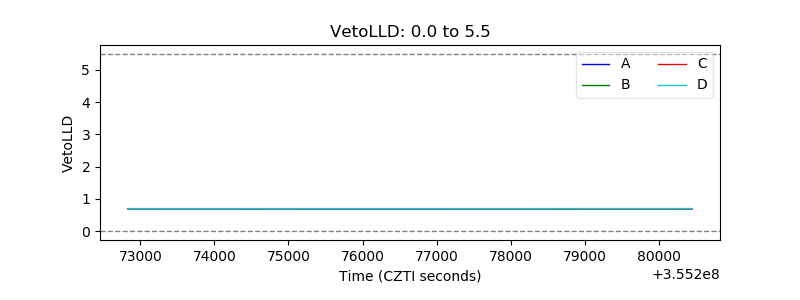 |
| Alpha Counter | 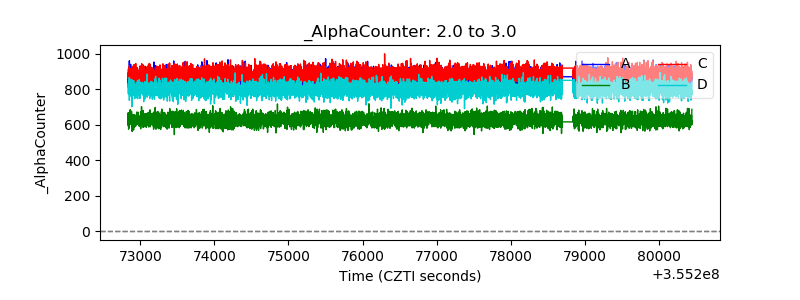 |
| _CPM_Rate |  |
| CZT Counter | 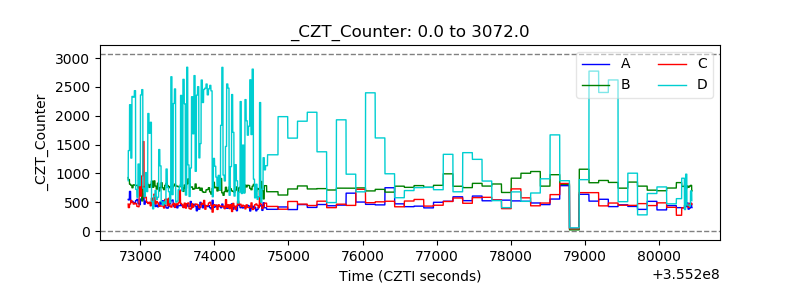 |
| +2.5 Volts monitor | 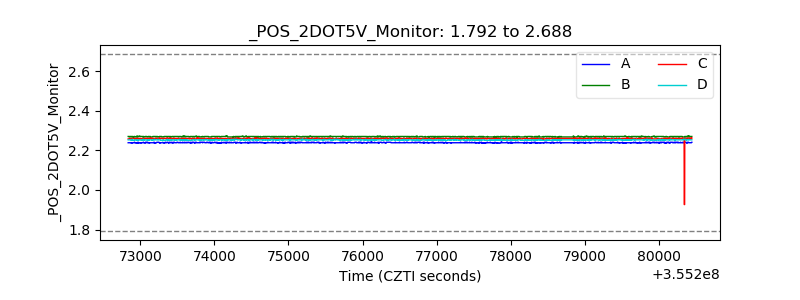 |
| +5 Volts monitor |  |
| _ROLL_ROT | 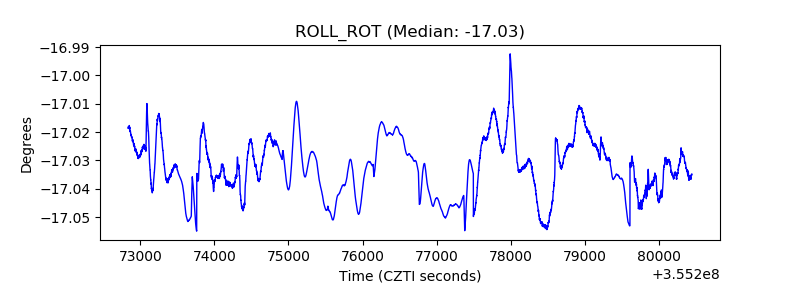 |
| _Roll_DEC | 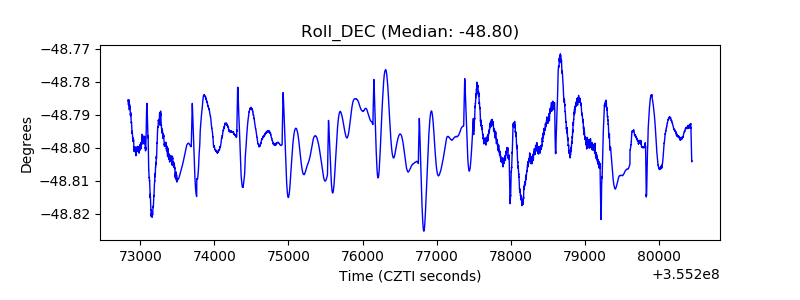 |
| _Roll_RA | 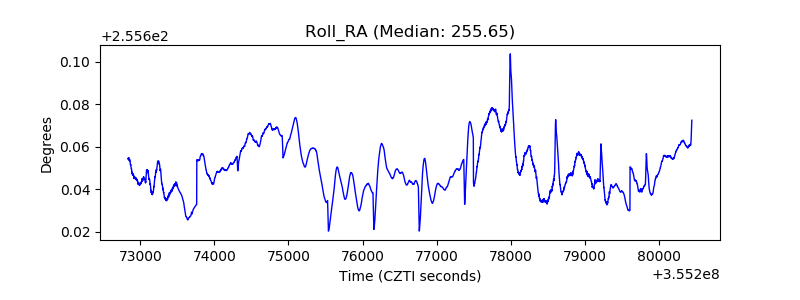 |
| Veto Counter |  |