| Param | Original file | Final file |
|---|---|---|
| Filename | modeM0/AS1T03_291T01_9000004278_29843cztM0_level2.evt | modeM0/AS1T03_291T01_9000004278_29843cztM0_level2_quad_clean.evt |
| Size (bytes) | 1,534,176,000 | 236,283,840 |
| Size | 1.4 GB | 225.3 MB |
| Events in quadrant A | 9,600,312 | 1,534,016 |
| Events in quadrant B | 13,614,696 | 1,540,175 |
| Events in quadrant C | 9,639,692 | 1,467,138 |
| Events in quadrant D | 12,415,390 | 1,394,515 |
| Mode SS | |||
|---|---|---|---|
| Quadrant | BADHDUFLAG | Total packets | Discarded packets |
| A | 0 | 360 | 0 |
| B | 0 | 360 | 0 |
| C | 0 | 360 | 0 |
| D | 0 | 360 | 0 |
| Mode M0 | |||
|---|---|---|---|
| Quadrant | BADHDUFLAG | Total packets | Discarded packets |
| A | 0 | 39991 | 4 |
| B | 0 | 53553 | 4 |
| C | 0 | 39341 | 4 |
| D | 0 | 48297 | 4 |
| Mode M9 | |||
|---|---|---|---|
| Quadrant | BADHDUFLAG | Total packets | Discarded packets |
| A | 0 | 17 | 0 |
| B | 0 | 17 | 0 |
| C | 0 | 17 | 0 |
| D | 0 | 17 | 0 |
| Quadrant | Total seconds | Saturated seconds | Saturation percentage |
|---|---|---|---|
| A | 17705 | 485 | 2.739339% |
| B | 17706 | 310 | 1.750819% |
| C | 17706 | 363 | 2.050152% |
| D | 17706 | 969 | 5.472721% |
Noise dominated data is calculated using 1-second bins in cleaned event files. If a bin has >2000 counts, and if more than 50% of those come from <1% of pixels, then it is considered to be noise-dominated and hence unusable.
| Quadrant | # 1 sec bins | Bins with >0 counts | Bins with >2000 counts | High rate bins dominated by noise | Noise dominated (total time) | Noise dominated (detector-on time) | Marked lightcurve |
|---|---|---|---|---|---|---|---|
| A | 19365 | 17709 | 248 | 248 | 1.28% | 1.40% | 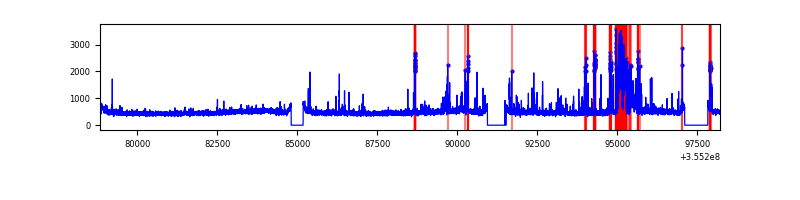 |
| B | 19366 | 17710 | 11 | 11 | 0.06% | 0.06% | 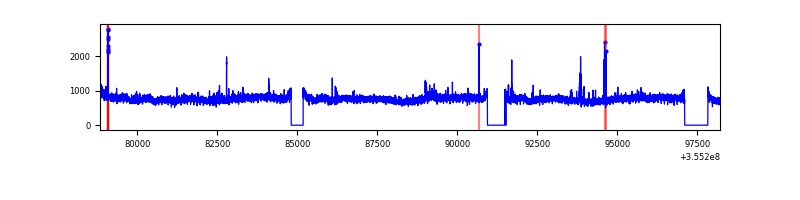 |
| C | 19366 | 17710 | 30 | 30 | 0.15% | 0.17% | 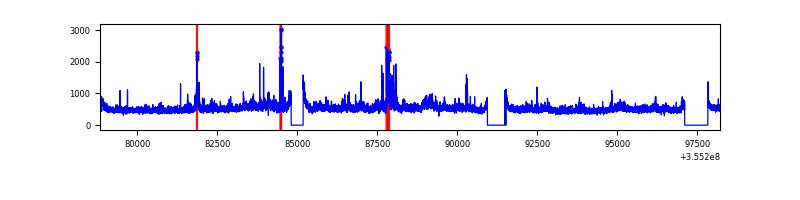 |
| D | 19366 | 17710 | 655 | 655 | 3.38% | 3.70% | 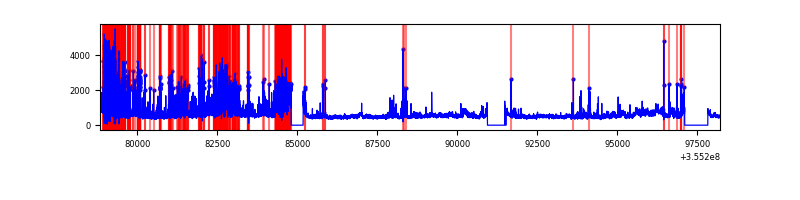 |
Top three noisy pixels from each quadrant. If the there are fewer than three noisy pixels in the level2.evt file, extra rows are filled as -1
| Pixel properties | Quadrant properties | ||||||
|---|---|---|---|---|---|---|---|
| Quadrant | DetID | PixID | Counts | Sigma | Mean | Median | Sigma |
| A | 14 | 238 | 1375474 | 3222.23 | 2128 | 2080 | 426.2 |
| A | 13 | 254 | 32328 | 70.97 | 2128 | 2080 | 426.2 |
| A | 3 | 137 | 21162 | 44.77 | 2128 | 2080 | 426.2 |
| B | 6 | 159 | 5072556 | 12548.74 | 2122 | 2068 | 404.1 |
| B | 12 | 111 | 50818 | 120.65 | 2122 | 2068 | 404.1 |
| B | 0 | 189 | 50039 | 118.72 | 2122 | 2068 | 404.1 |
| C | 3 | 233 | 974123 | 2017.23 | 2057 | 2068 | 481.9 |
| C | 14 | 238 | 331797 | 684.26 | 2057 | 2068 | 481.9 |
| C | 10 | 22 | 245205 | 504.56 | 2057 | 2068 | 481.9 |
| D | 7 | 80 | 2998959 | 6195.72 | 2032 | 1976 | 483.7 |
| D | 8 | 195 | 1246184 | 2572.18 | 2032 | 1976 | 483.7 |
| D | 2 | 250 | 279965 | 574.69 | 2032 | 1976 | 483.7 |
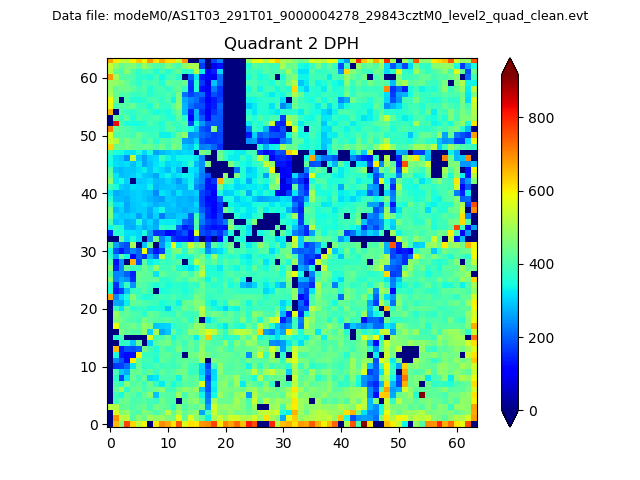
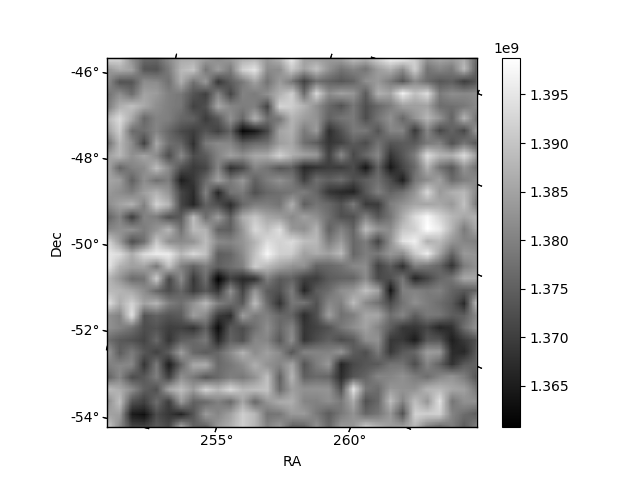
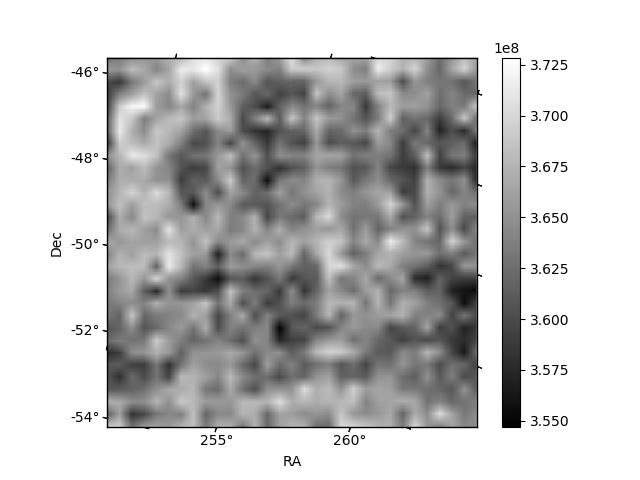
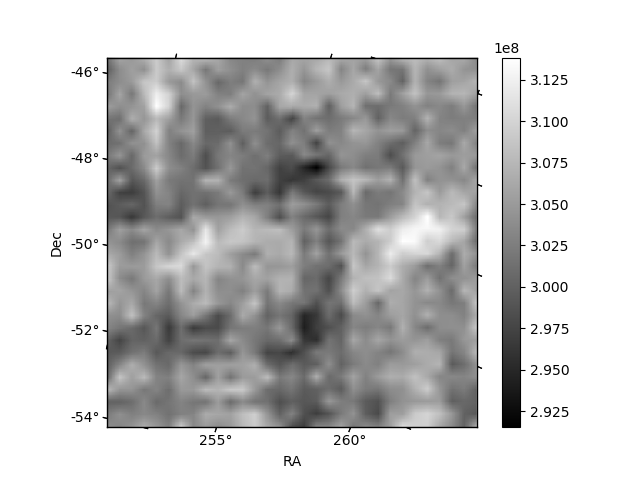
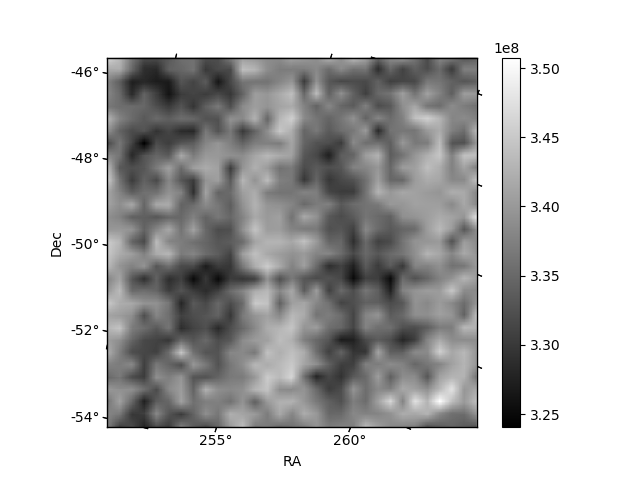
Histogram calculated using DETX and DETY for each event in the final _common_clean file
| Quadrant A | 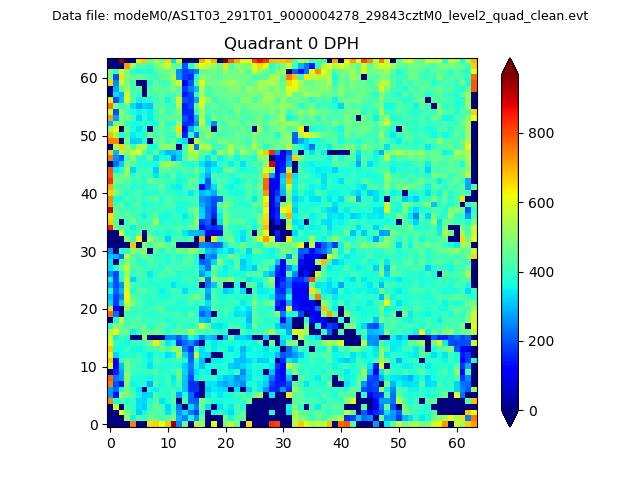 |
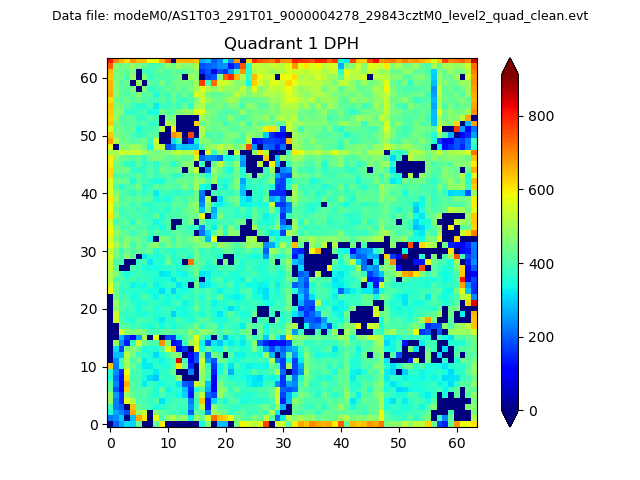 |
Quadrant B |
|---|---|---|---|
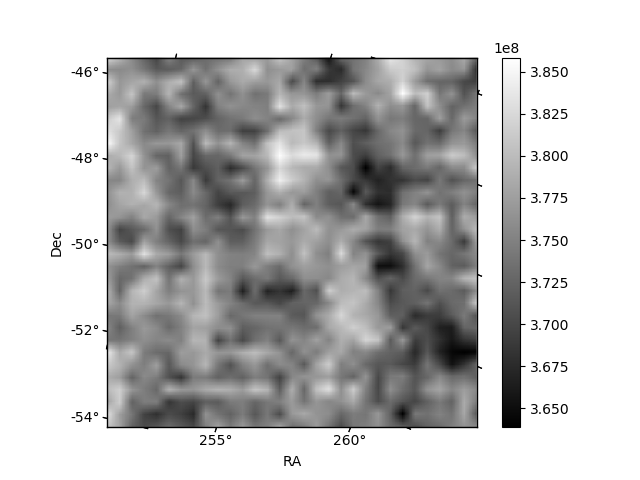
| Quadrant D | 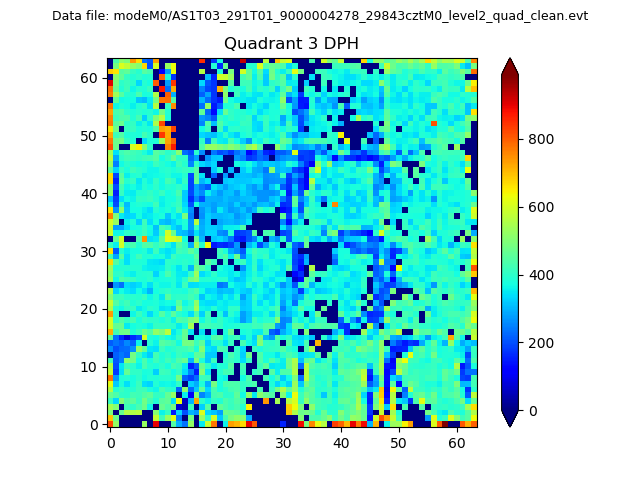 |
 |
Quadrant C |
| Plot type | Count rate plots | Images |
|---|---|---|
| Comparison with Poisson distribution Blue bars denote a histogram of data divided into 1 sec bins. Red curve is a Poisson curve with rate = median count rate of data. |
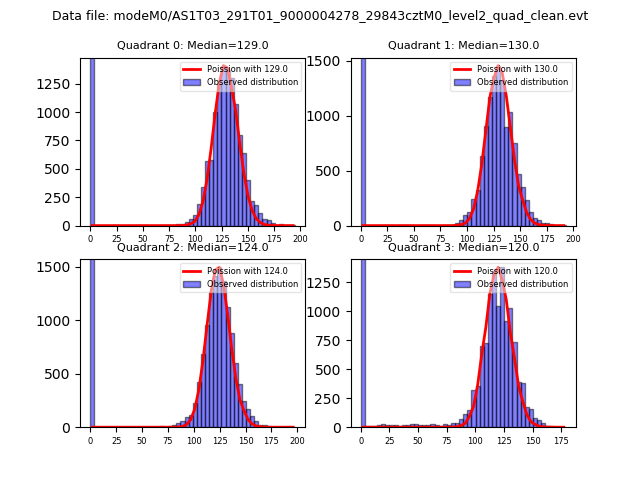 |
 |
| Quadrant-wise count rates Data is divided into 100 sec bins |
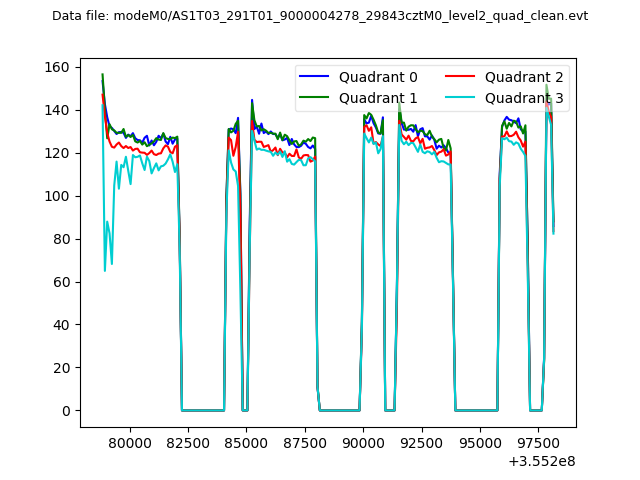 |
|
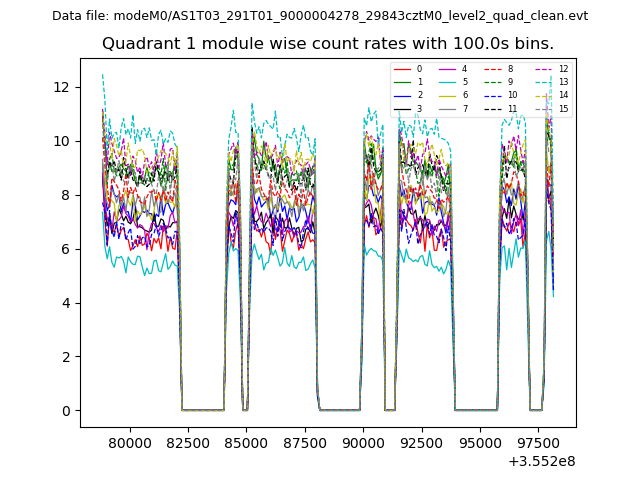
| Module-wise count rates for Quadrant A Data is divided into 100 sec bins |
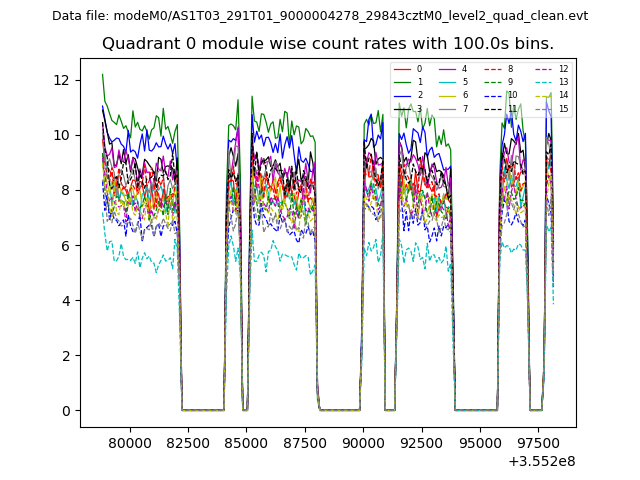 |
 |
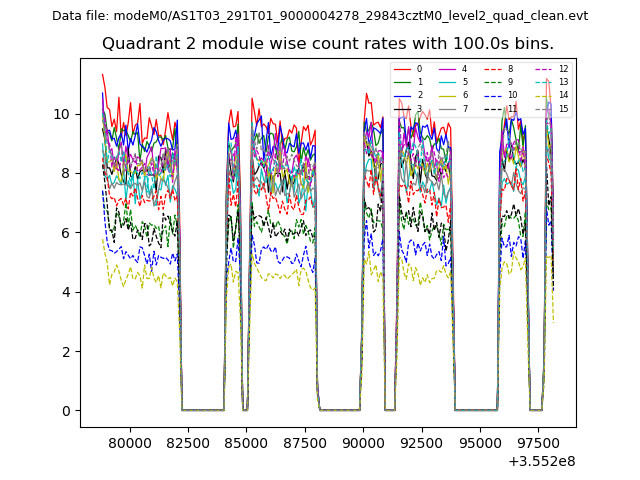
| Module-wise count rates for Quadrant B Data is divided into 100 sec bins |
 |
 |
| Module-wise count rates for Quadrant C Data is divided into 100 sec bins |
 |
 |
| Module-wise count rates for Quadrant D Data is divided into 100 sec bins |
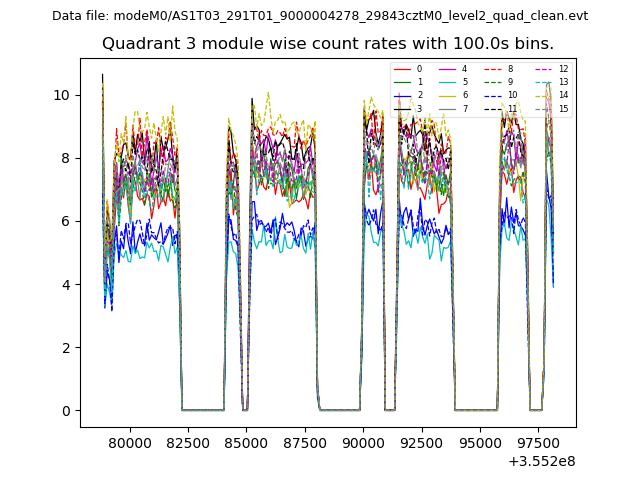 |
 |
| Parameter | Plot |
|---|---|
| CZT HV Monitor | 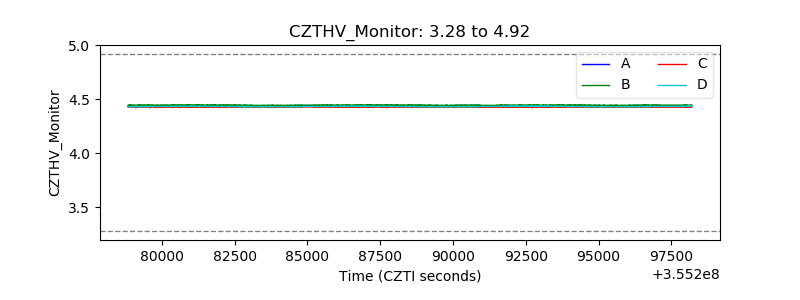 |
| D_VDD | 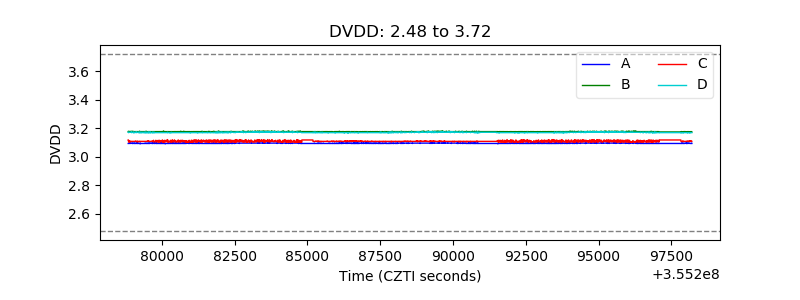 |
| Temperature 1 | 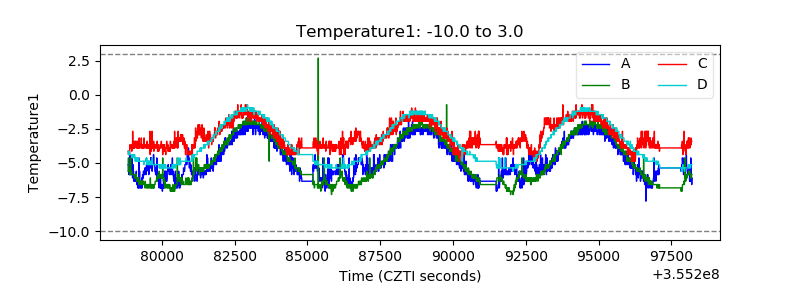 |
| Veto HV Monitor | 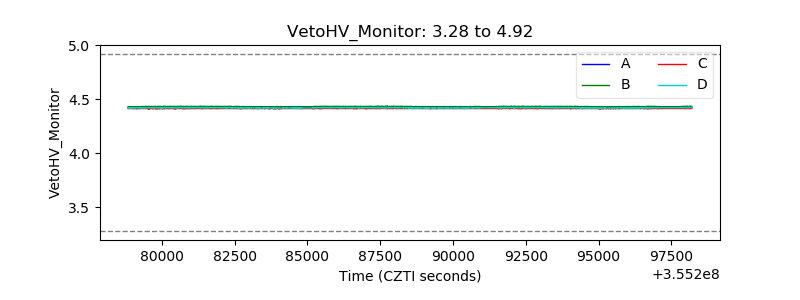 |
| Veto LLD | 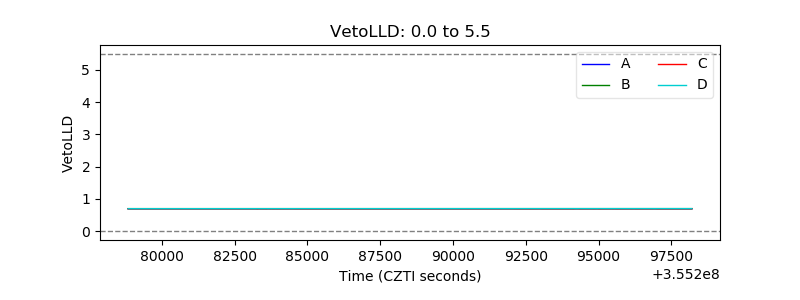 |
| Alpha Counter | 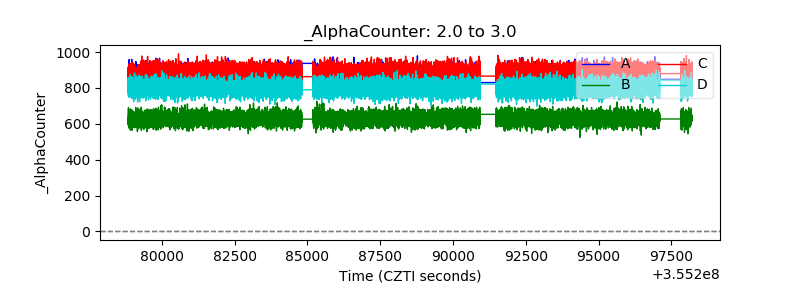 |
| _CPM_Rate | 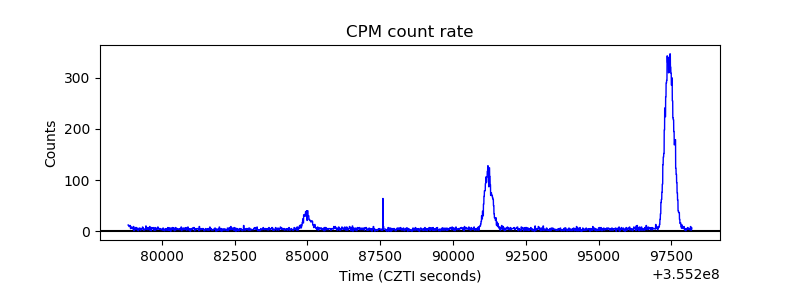 |
| CZT Counter | 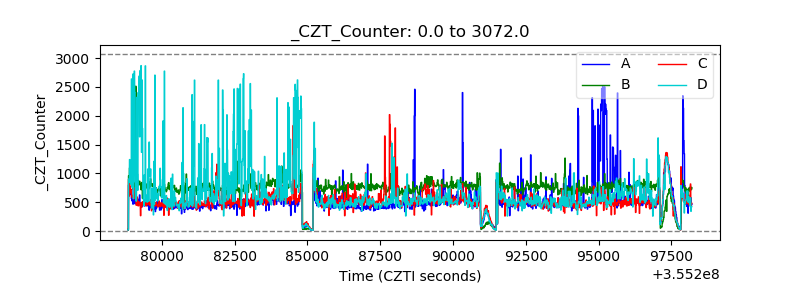 |
| +2.5 Volts monitor |  |
| +5 Volts monitor |  |
| _ROLL_ROT | 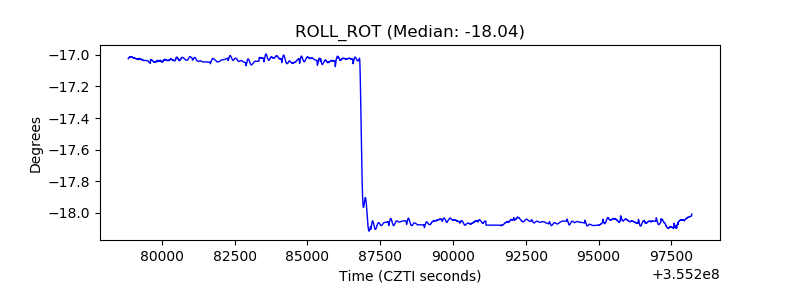 |
| _Roll_DEC | 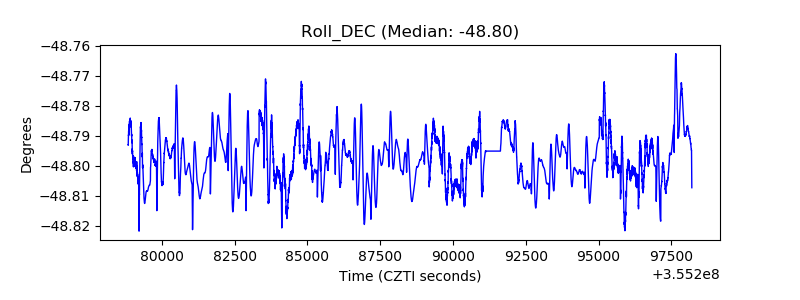 |
| _Roll_RA | 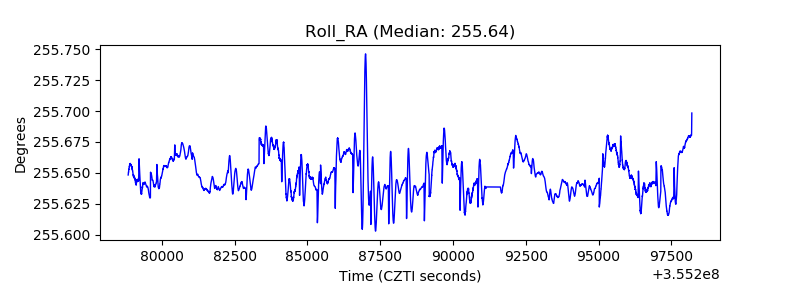 |
| Veto Counter | 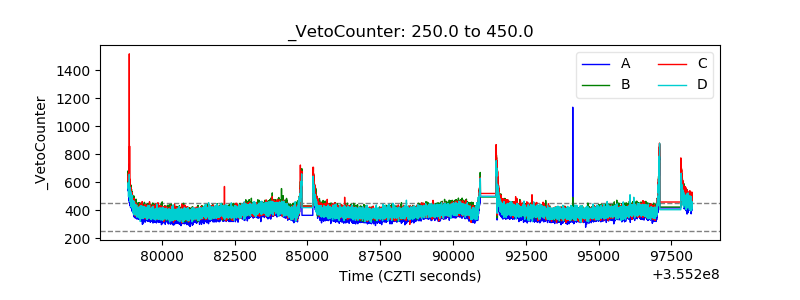 |