| Param | Original file | Final file |
|---|---|---|
| Filename | modeM0/AS1T03_291T01_9000004278_29847cztM0_level2.evt | modeM0/AS1T03_291T01_9000004278_29847cztM0_level2_quad_clean.evt |
| Size (bytes) | 590,270,400 | 74,568,960 |
| Size | 562.9 MB | 71.1 MB |
| Events in quadrant A | 3,731,900 | 475,294 |
| Events in quadrant B | 5,514,079 | 470,221 |
| Events in quadrant C | 4,065,065 | 436,080 |
| Events in quadrant D | 4,136,286 | 433,412 |
| Mode SS | |||
|---|---|---|---|
| Quadrant | BADHDUFLAG | Total packets | Discarded packets |
| A | 0 | 130 | 0 |
| B | 0 | 130 | 0 |
| C | 0 | 130 | 0 |
| D | 0 | 130 | 0 |
| Mode M0 | |||
|---|---|---|---|
| Quadrant | BADHDUFLAG | Total packets | Discarded packets |
| A | 0 | 15330 | 2 |
| B | 0 | 20305 | 2 |
| C | 0 | 16627 | 2 |
| D | 0 | 16643 | 2 |
| Mode M9 | |||
|---|---|---|---|
| Quadrant | BADHDUFLAG | Total packets | Discarded packets |
| A | 0 | 13 | 0 |
| B | 0 | 13 | 0 |
| C | 0 | 13 | 0 |
| D | 0 | 13 | 0 |
| Quadrant | Total seconds | Saturated seconds | Saturation percentage |
|---|---|---|---|
| A | 6341 | 124 | 1.955528% |
| B | 6342 | 204 | 3.216651% |
| C | 6342 | 220 | 3.468937% |
| D | 6342 | 182 | 2.869757% |
Noise dominated data is calculated using 1-second bins in cleaned event files. If a bin has >2000 counts, and if more than 50% of those come from <1% of pixels, then it is considered to be noise-dominated and hence unusable.
| Quadrant | # 1 sec bins | Bins with >0 counts | Bins with >2000 counts | High rate bins dominated by noise | Noise dominated (total time) | Noise dominated (detector-on time) | Marked lightcurve |
|---|---|---|---|---|---|---|---|
| A | 7661 | 6342 | 1 | 1 | 0.01% | 0.02% | 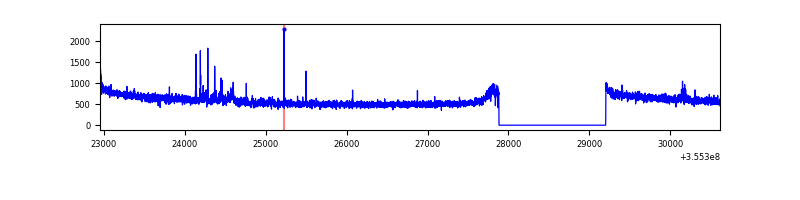 |
| B | 7662 | 6343 | 6 | 6 | 0.08% | 0.09% | 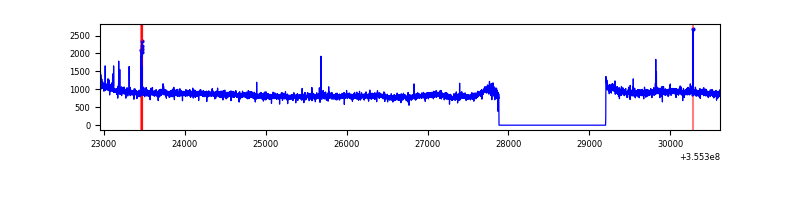 |
| C | 7662 | 6343 | 13 | 13 | 0.17% | 0.20% | 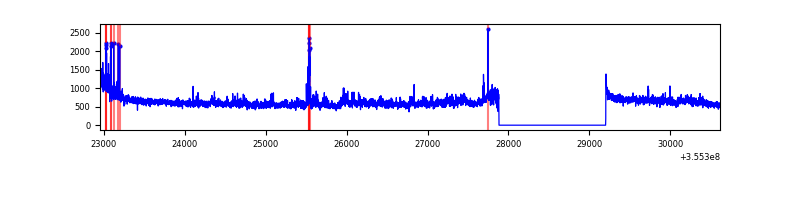 |
| D | 7662 | 6343 | 78 | 78 | 1.02% | 1.23% | 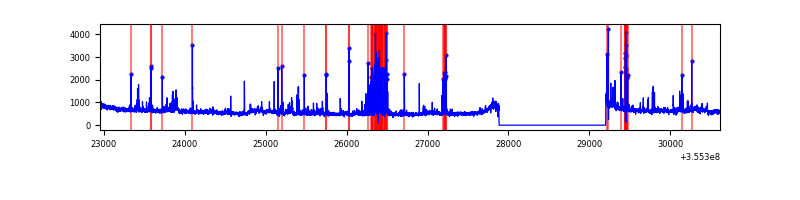 |
Top three noisy pixels from each quadrant. If the there are fewer than three noisy pixels in the level2.evt file, extra rows are filled as -1
| Pixel properties | Quadrant properties | ||||||
|---|---|---|---|---|---|---|---|
| Quadrant | DetID | PixID | Counts | Sigma | Mean | Median | Sigma |
| A | 12 | 96 | 32611 | 172.28 | 949 | 936 | 183.9 |
| A | 15 | 174 | 17334 | 89.19 | 949 | 936 | 183.9 |
| A | 14 | 238 | 15936 | 81.59 | 949 | 936 | 183.9 |
| B | 6 | 159 | 1804720 | 10578.39 | 931 | 914 | 170.5 |
| B | 0 | 190 | 47114 | 270.94 | 931 | 914 | 170.5 |
| B | 12 | 111 | 19155 | 106.97 | 931 | 914 | 170.5 |
| C | 3 | 233 | 380328 | 1910.24 | 875 | 883 | 198.6 |
| C | 14 | 238 | 146619 | 733.68 | 875 | 883 | 198.6 |
| C | 10 | 22 | 108232 | 540.43 | 875 | 883 | 198.6 |
| D | 8 | 195 | 225615 | 1093.1 | 892 | 871 | 205.6 |
| D | 2 | 250 | 223442 | 1082.53 | 892 | 871 | 205.6 |
| D | 7 | 80 | 121187 | 585.19 | 892 | 871 | 205.6 |
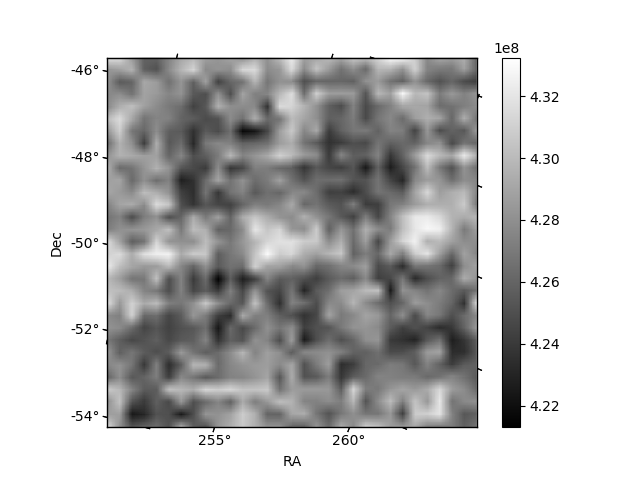
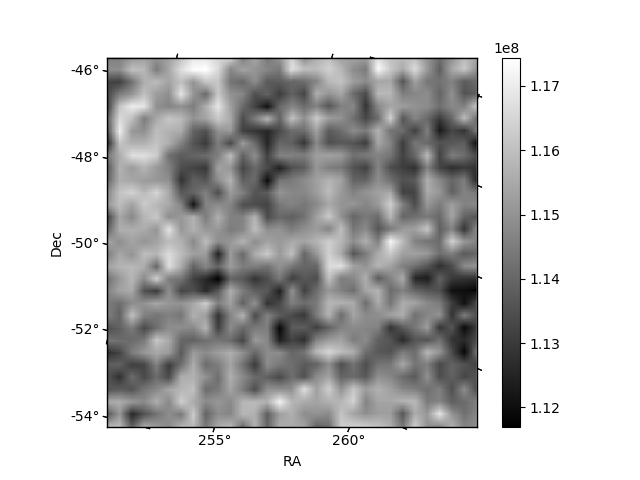
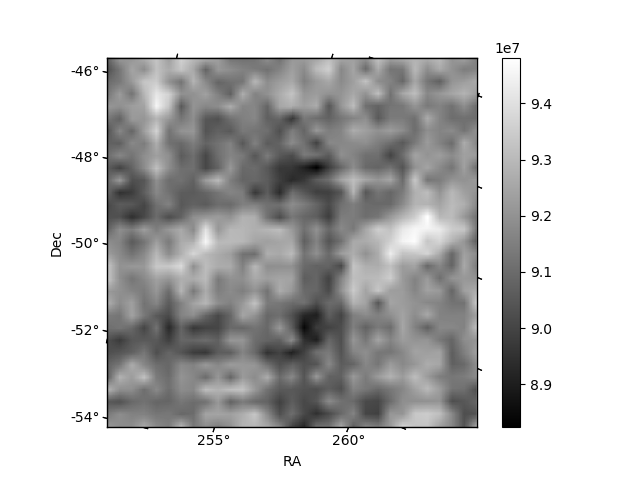
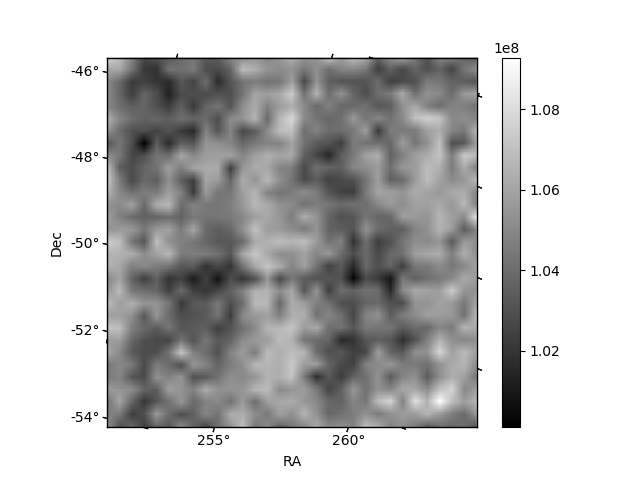
Histogram calculated using DETX and DETY for each event in the final _common_clean file
| Quadrant A | 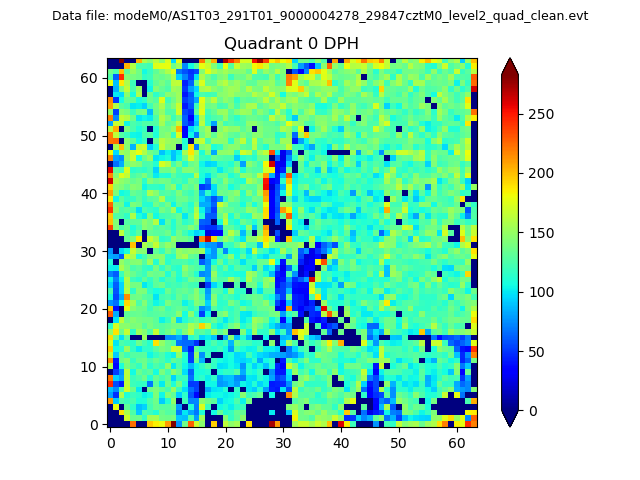 |
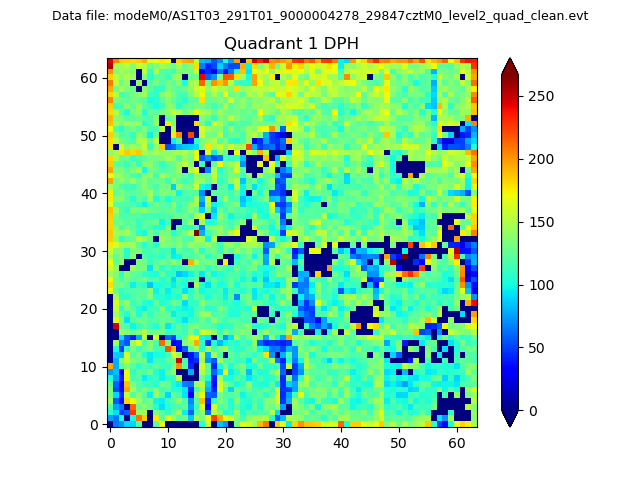 |
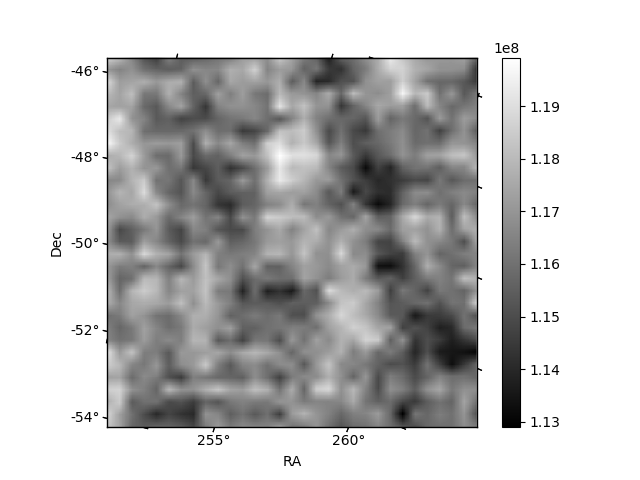
Quadrant B |
|---|---|---|---|
| Quadrant D | 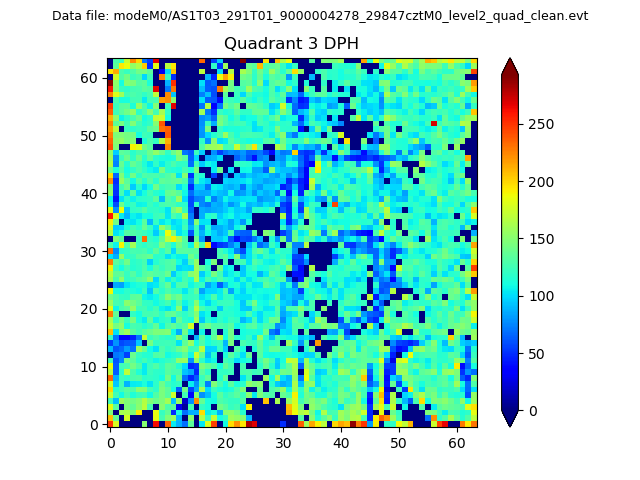 |
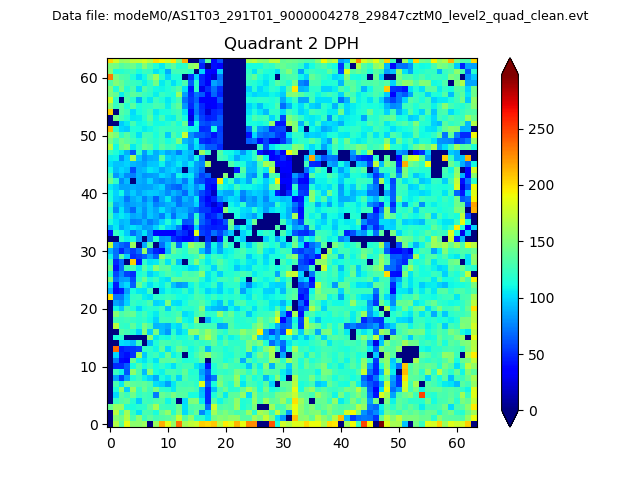 |
Quadrant C |
| Plot type | Count rate plots | Images |
|---|---|---|
| Comparison with Poisson distribution Blue bars denote a histogram of data divided into 1 sec bins. Red curve is a Poisson curve with rate = median count rate of data. |
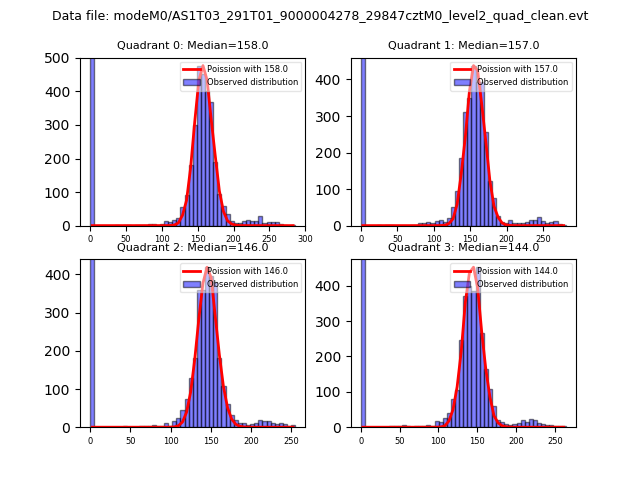 |
 |
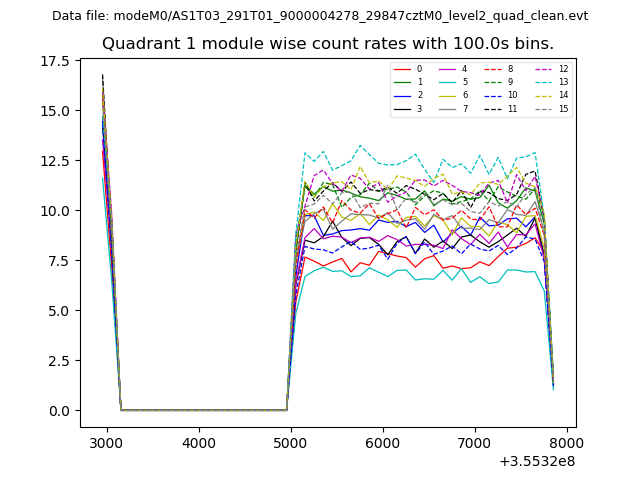
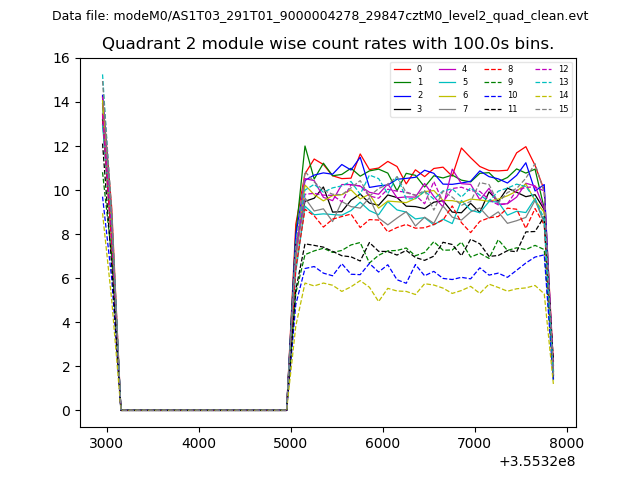
| Quadrant-wise count rates Data is divided into 100 sec bins |
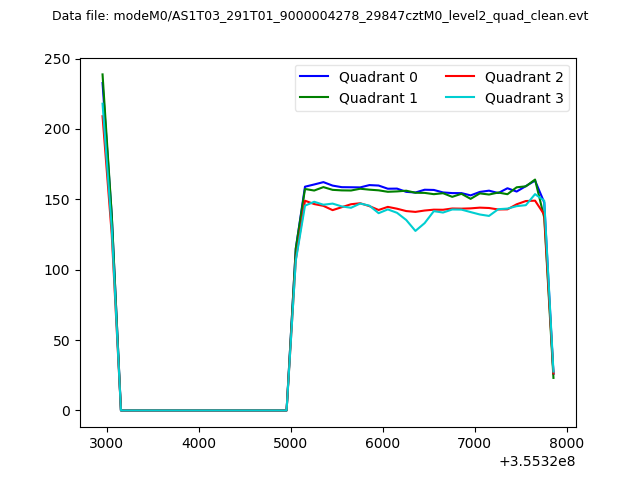 |
|
| Module-wise count rates for Quadrant A Data is divided into 100 sec bins |
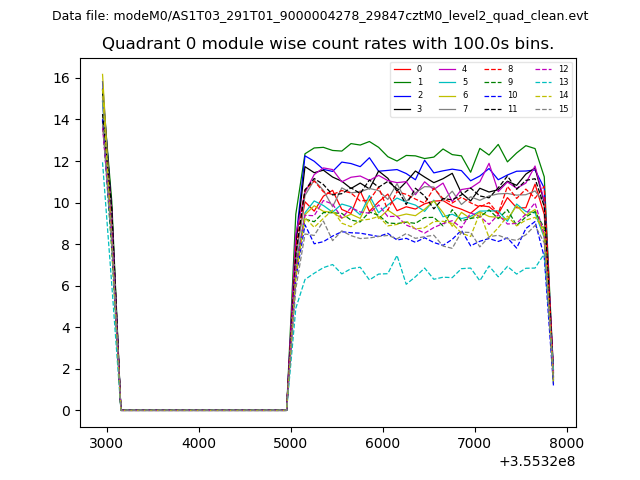 |
 |
| Module-wise count rates for Quadrant B Data is divided into 100 sec bins |
 |
 |
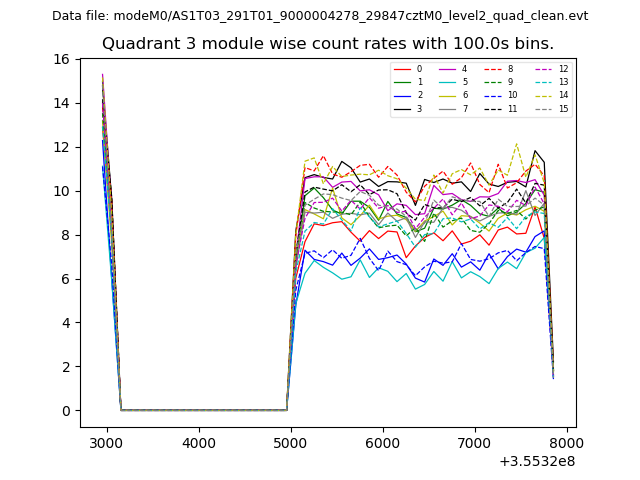
| Module-wise count rates for Quadrant C Data is divided into 100 sec bins |
 |
 |
| Module-wise count rates for Quadrant D Data is divided into 100 sec bins |
 |
 |
| Parameter | Plot |
|---|---|
| CZT HV Monitor | 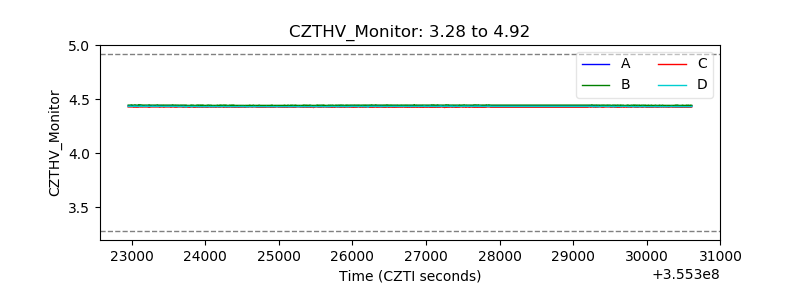 |
| D_VDD | 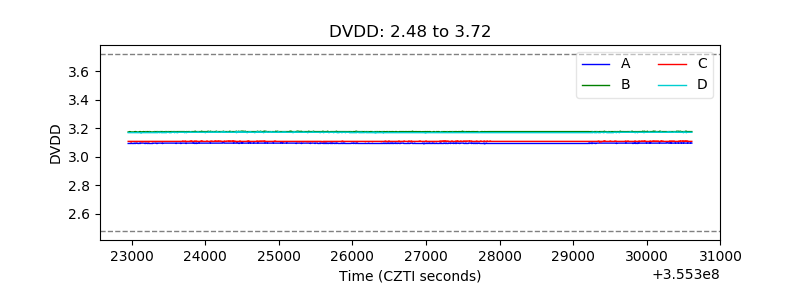 |
| Temperature 1 | 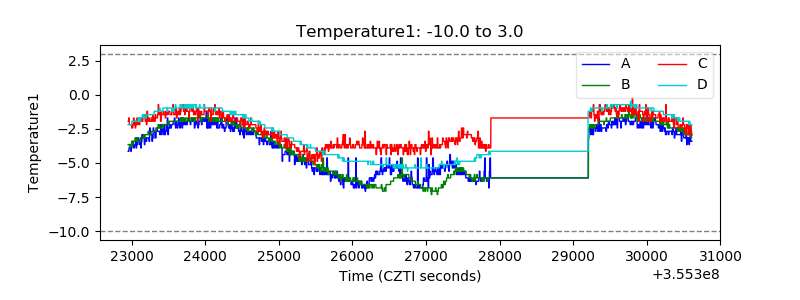 |
| Veto HV Monitor | 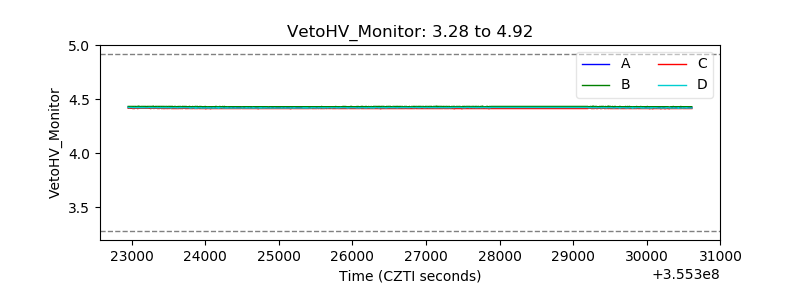 |
| Veto LLD | 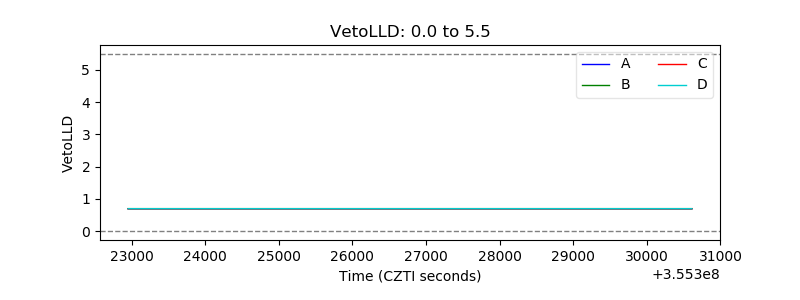 |
| Alpha Counter | 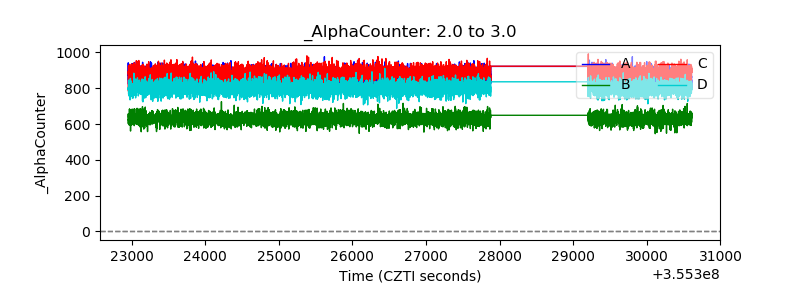 |
| _CPM_Rate | 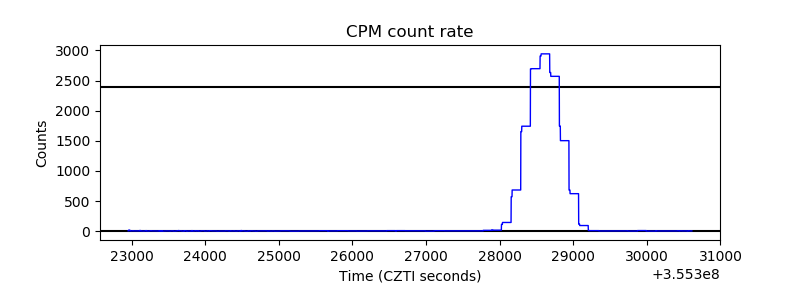 |
| CZT Counter | 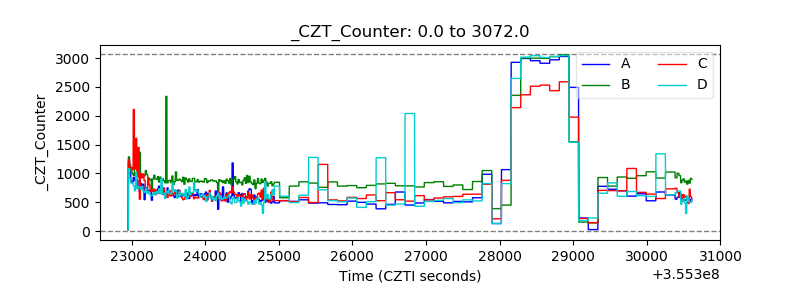 |
| +2.5 Volts monitor |  |
| +5 Volts monitor | 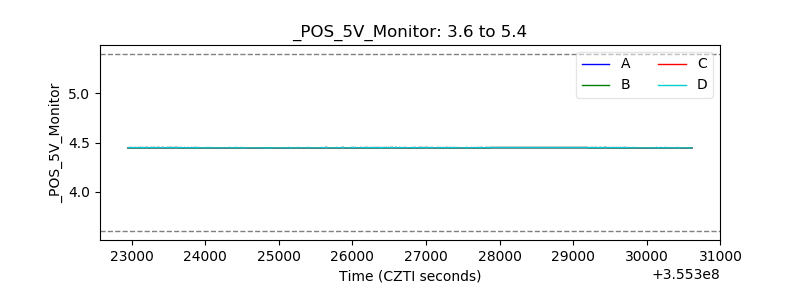 |
| _ROLL_ROT | 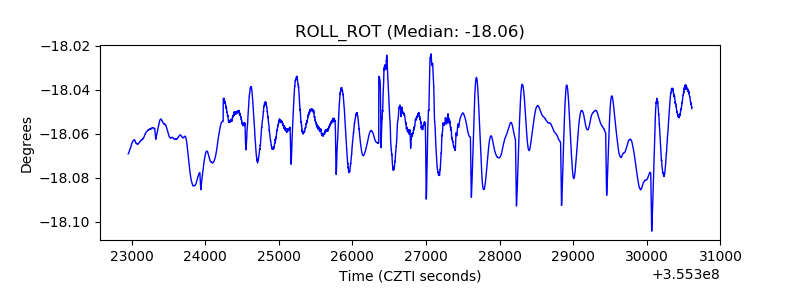 |
| _Roll_DEC | 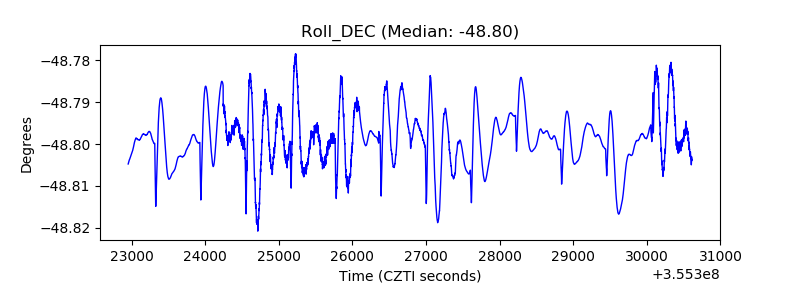 |
| _Roll_RA | 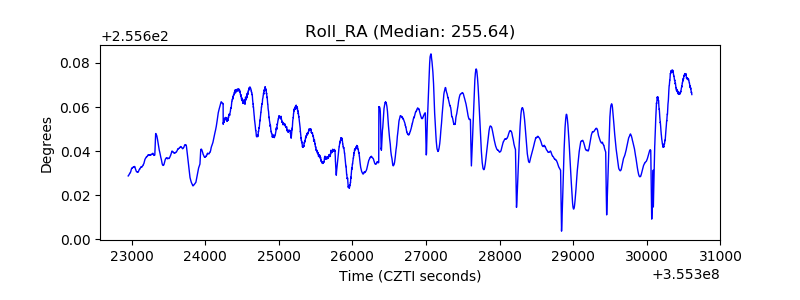 |
| Veto Counter | 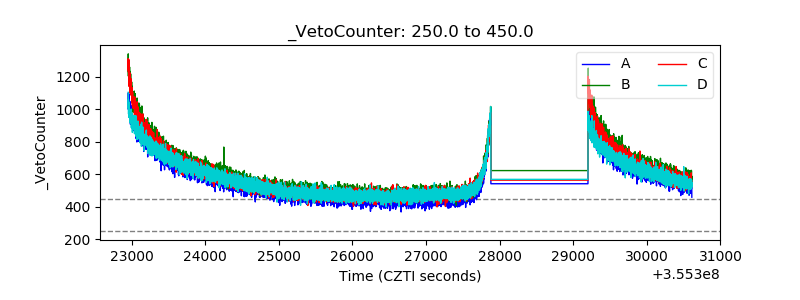 |