| Param | Original file | Final file |
|---|---|---|
| Filename | modeM0/AS1T03_291T01_9000004278_29848cztM0_level2.evt | modeM0/AS1T03_291T01_9000004278_29848cztM0_level2_quad_clean.evt |
| Size (bytes) | 567,046,080 | 80,686,080 |
| Size | 540.8 MB | 76.9 MB |
| Events in quadrant A | 3,602,495 | 521,070 |
| Events in quadrant B | 5,503,760 | 516,594 |
| Events in quadrant C | 3,803,737 | 482,612 |
| Events in quadrant D | 3,830,940 | 477,537 |
| Mode SS | |||
|---|---|---|---|
| Quadrant | BADHDUFLAG | Total packets | Discarded packets |
| A | 0 | 130 | 0 |
| B | 0 | 130 | 0 |
| C | 0 | 130 | 0 |
| D | 0 | 130 | 0 |
| Mode M0 | |||
|---|---|---|---|
| Quadrant | BADHDUFLAG | Total packets | Discarded packets |
| A | 0 | 14743 | 2 |
| B | 0 | 20342 | 4 |
| C | 0 | 15537 | 2 |
| D | 0 | 15584 | 2 |
| Mode M9 | |||
|---|---|---|---|
| Quadrant | BADHDUFLAG | Total packets | Discarded packets |
| A | 0 | 20 | 0 |
| B | 0 | 21 | 0 |
| C | 0 | 21 | 0 |
| D | 0 | 21 | 0 |
| Quadrant | Total seconds | Saturated seconds | Saturation percentage |
|---|---|---|---|
| A | 6383 | 128 | 2.005327% |
| B | 6382 | 228 | 3.572548% |
| C | 6382 | 189 | 2.961454% |
| D | 6382 | 140 | 2.193670% |
Noise dominated data is calculated using 1-second bins in cleaned event files. If a bin has >2000 counts, and if more than 50% of those come from <1% of pixels, then it is considered to be noise-dominated and hence unusable.
| Quadrant | # 1 sec bins | Bins with >0 counts | Bins with >2000 counts | High rate bins dominated by noise | Noise dominated (total time) | Noise dominated (detector-on time) | Marked lightcurve |
|---|---|---|---|---|---|---|---|
| A | 7678 | 6384 | 0 | 0 | 0.00% | 0.00% | 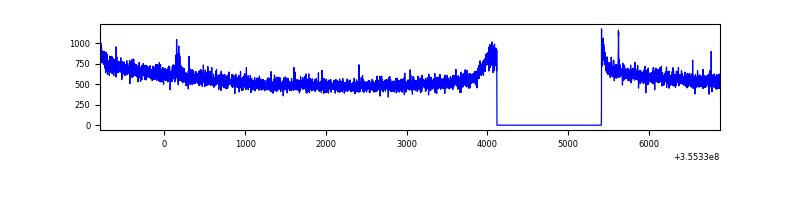 |
| B | 7677 | 6383 | 2 | 2 | 0.03% | 0.03% | 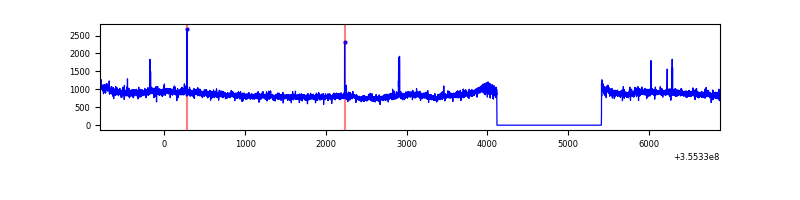 |
| C | 7677 | 6383 | 1 | 1 | 0.01% | 0.02% | 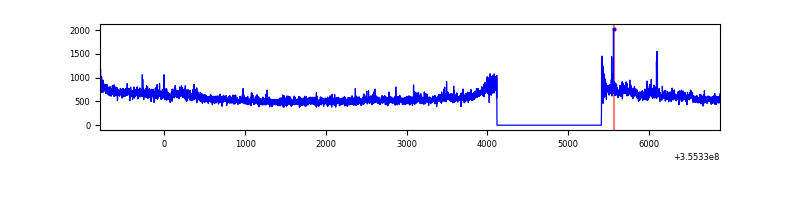 |
| D | 7677 | 6383 | 30 | 30 | 0.39% | 0.47% | 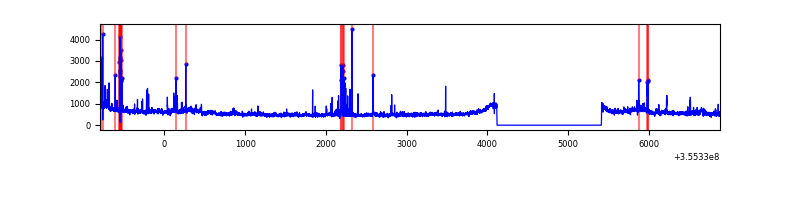 |
Top three noisy pixels from each quadrant. If the there are fewer than three noisy pixels in the level2.evt file, extra rows are filled as -1
| Pixel properties | Quadrant properties | ||||||
|---|---|---|---|---|---|---|---|
| Quadrant | DetID | PixID | Counts | Sigma | Mean | Median | Sigma |
| A | 13 | 254 | 12485 | 63.8 | 930 | 914 | 181.4 |
| A | 14 | 238 | 11312 | 57.33 | 930 | 914 | 181.4 |
| A | 3 | 137 | 7957 | 38.83 | 930 | 914 | 181.4 |
| B | 6 | 159 | 1874156 | 11220.9 | 914 | 897 | 166.9 |
| B | 0 | 190 | 29528 | 171.5 | 914 | 897 | 166.9 |
| B | 12 | 111 | 18961 | 108.2 | 914 | 897 | 166.9 |
| C | 3 | 233 | 277619 | 1397.33 | 861 | 866 | 198.1 |
| C | 14 | 238 | 145032 | 727.9 | 861 | 866 | 198.1 |
| C | 2 | 114 | 15828 | 75.54 | 861 | 866 | 198.1 |
| D | 8 | 195 | 224306 | 1111.6 | 874 | 854 | 201.0 |
| D | 13 | 153 | 98179 | 484.16 | 874 | 854 | 201.0 |
| D | 2 | 250 | 80215 | 394.8 | 874 | 854 | 201.0 |
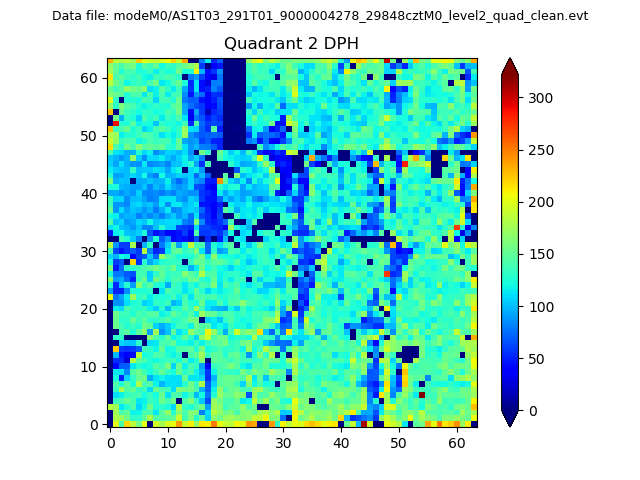
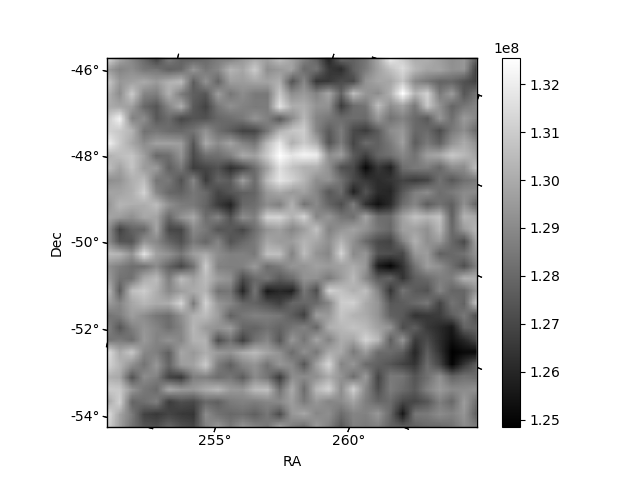
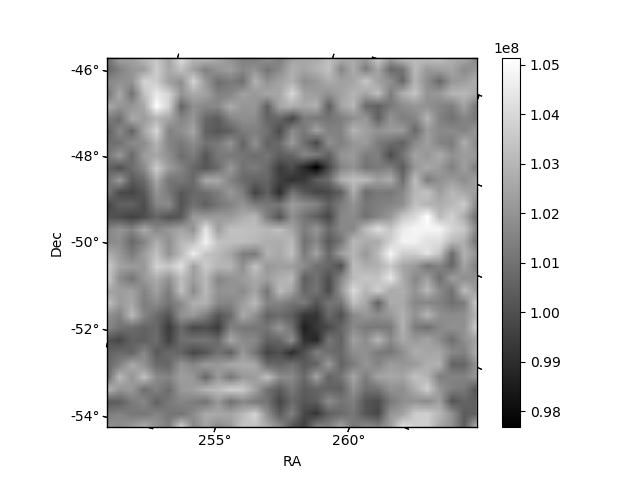
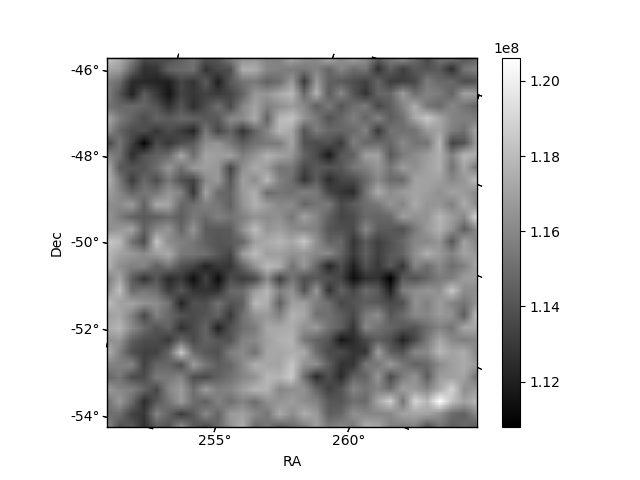
Histogram calculated using DETX and DETY for each event in the final _common_clean file
| Quadrant A | 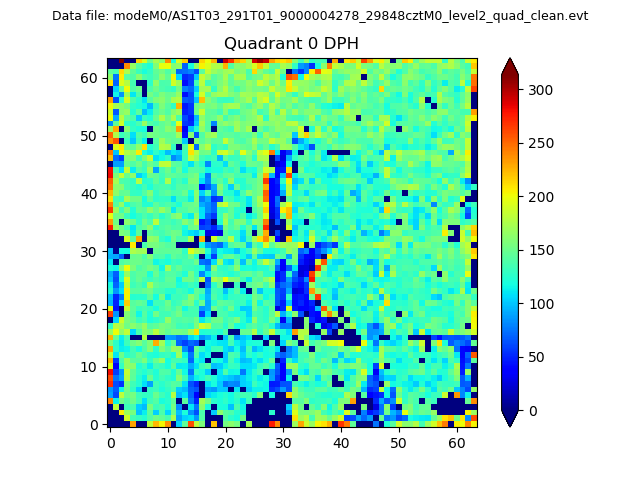 |
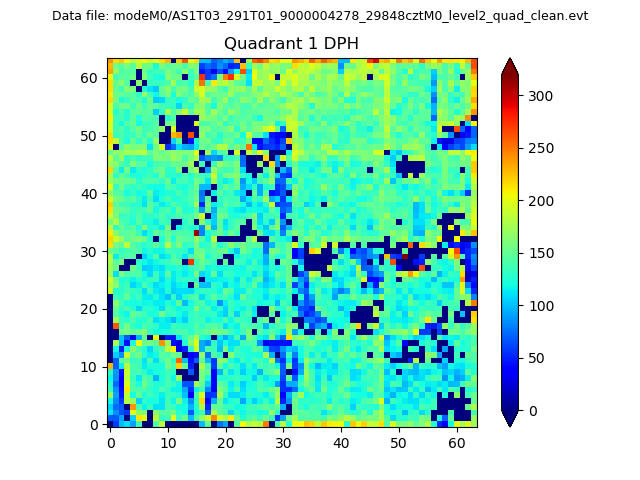 |
Quadrant B |
|---|---|---|---|
| Quadrant D | 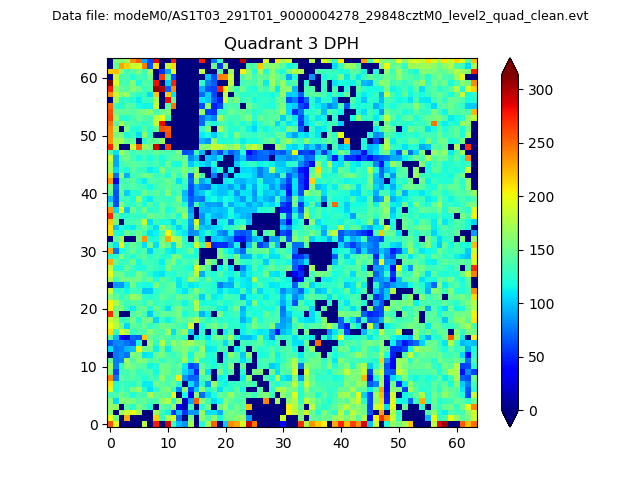 |
 |
Quadrant C |
| Plot type | Count rate plots | Images |
|---|---|---|
| Comparison with Poisson distribution Blue bars denote a histogram of data divided into 1 sec bins. Red curve is a Poisson curve with rate = median count rate of data. |
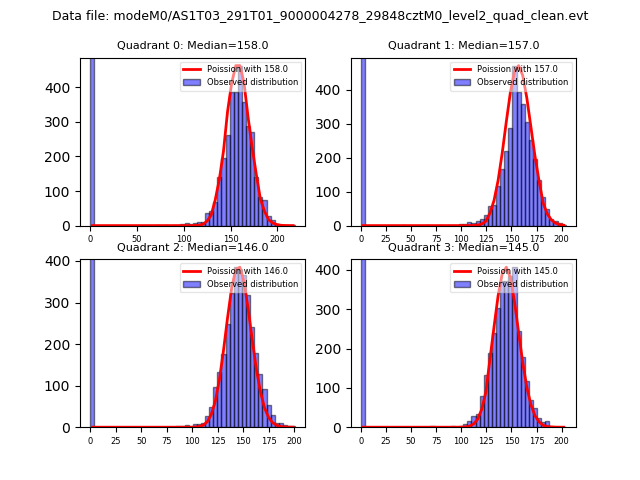 |
 |
| Quadrant-wise count rates Data is divided into 100 sec bins |
 |
|
| Module-wise count rates for Quadrant A Data is divided into 100 sec bins |
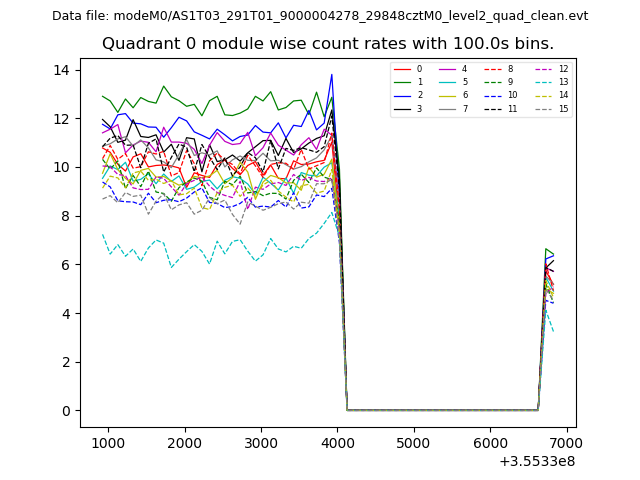 |
 |
| Module-wise count rates for Quadrant B Data is divided into 100 sec bins |
 |
 |
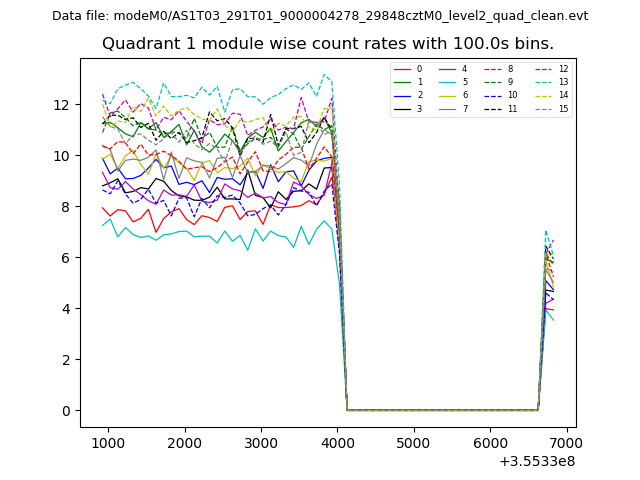
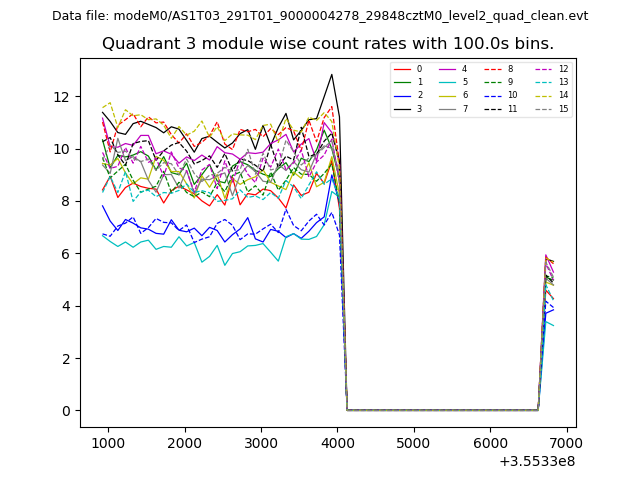
| Module-wise count rates for Quadrant C Data is divided into 100 sec bins |
 |
 |
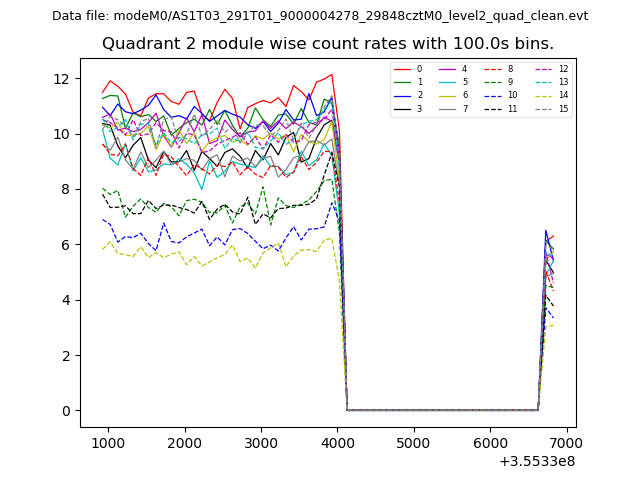
| Module-wise count rates for Quadrant D Data is divided into 100 sec bins |
 |
 |
| Parameter | Plot |
|---|---|
| CZT HV Monitor | 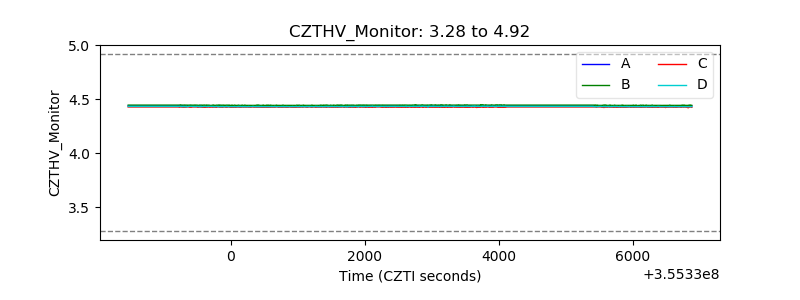 |
| D_VDD | 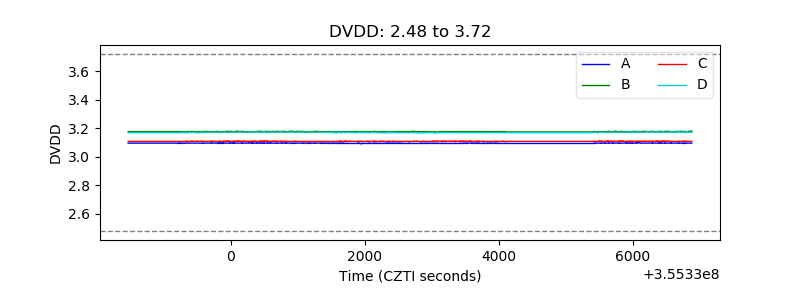 |
| Temperature 1 | 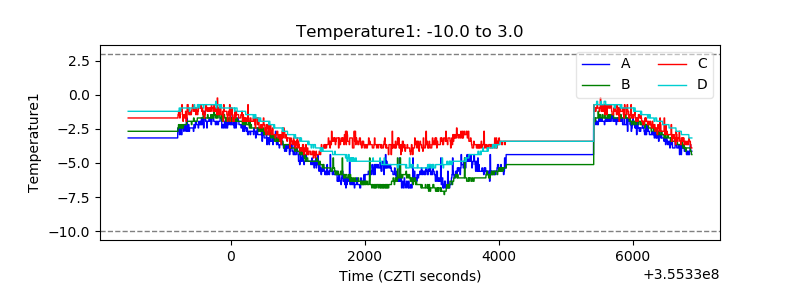 |
| Veto HV Monitor |  |
| Veto LLD | 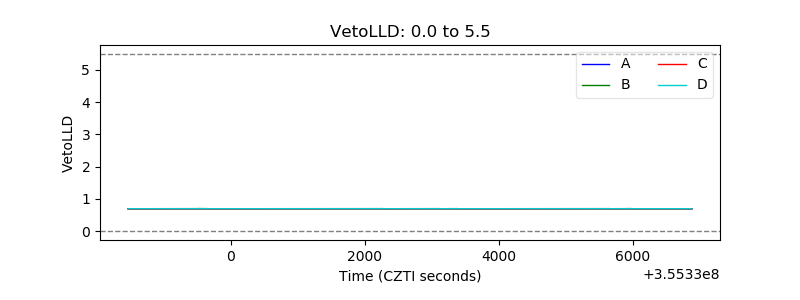 |
| Alpha Counter | 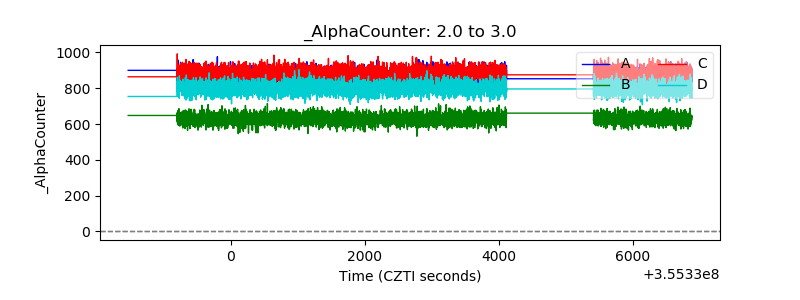 |
| _CPM_Rate | 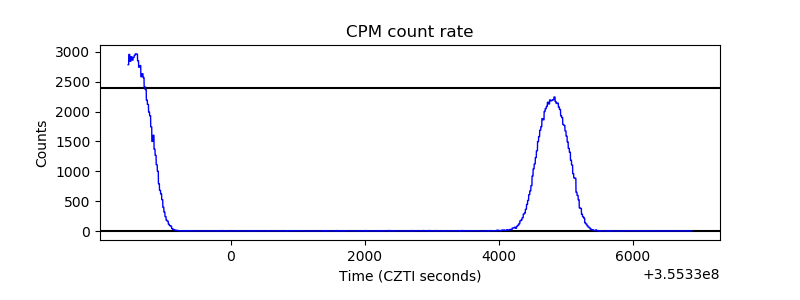 |
| CZT Counter | 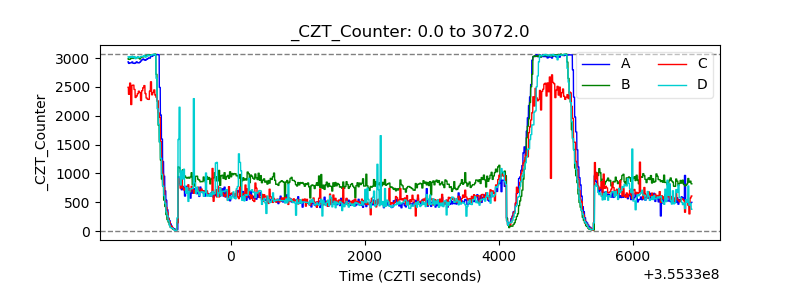 |
| +2.5 Volts monitor | 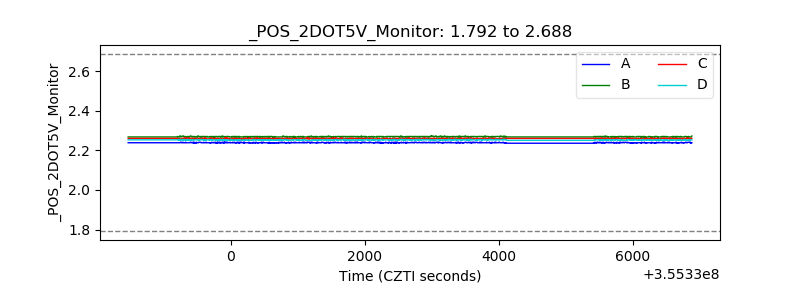 |
| +5 Volts monitor |  |
| _ROLL_ROT | 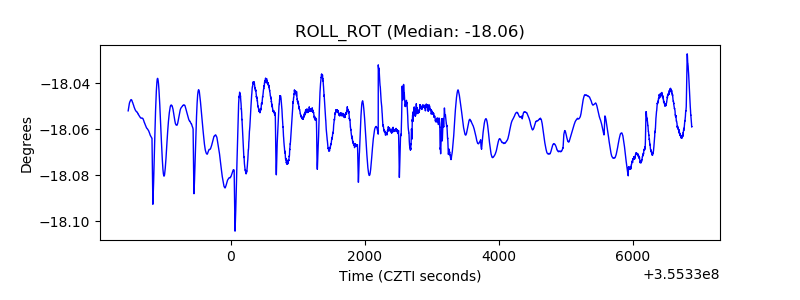 |
| _Roll_DEC | 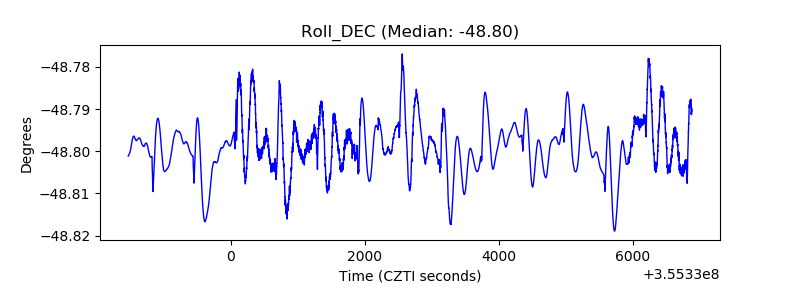 |
| _Roll_RA | 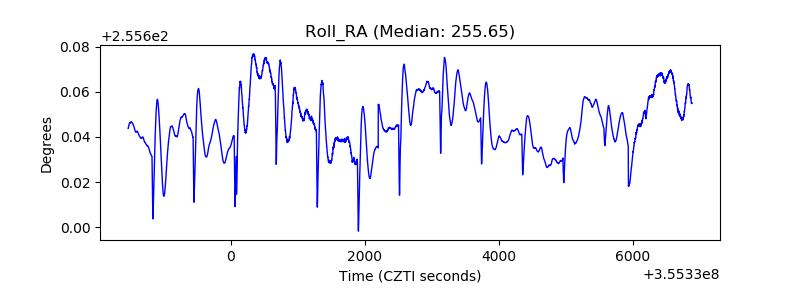 |
| Veto Counter | 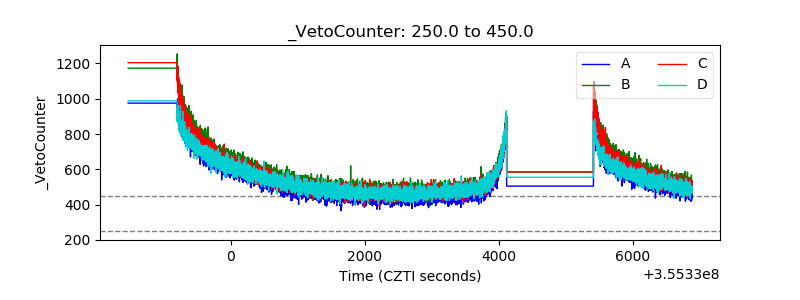 |