| Param | Original file | Final file |
|---|---|---|
| Filename | modeM0/AS1T03_291T01_9000004278_29849cztM0_level2.evt | modeM0/AS1T03_291T01_9000004278_29849cztM0_level2_quad_clean.evt |
| Size (bytes) | 536,495,040 | 92,096,640 |
| Size | 511.6 MB | 87.8 MB |
| Events in quadrant A | 3,400,779 | 610,157 |
| Events in quadrant B | 5,259,553 | 610,769 |
| Events in quadrant C | 3,635,130 | 569,119 |
| Events in quadrant D | 3,526,277 | 559,856 |
| Mode SS | |||
|---|---|---|---|
| Quadrant | BADHDUFLAG | Total packets | Discarded packets |
| A | 0 | 130 | 0 |
| B | 0 | 130 | 0 |
| C | 0 | 130 | 0 |
| D | 0 | 130 | 0 |
| Mode M0 | |||
|---|---|---|---|
| Quadrant | BADHDUFLAG | Total packets | Discarded packets |
| A | 0 | 13941 | 2 |
| B | 0 | 19536 | 3 |
| C | 0 | 14762 | 2 |
| D | 0 | 14468 | 2 |
| Mode M9 | |||
|---|---|---|---|
| Quadrant | BADHDUFLAG | Total packets | Discarded packets |
| A | 0 | 12 | 0 |
| B | 0 | 12 | 0 |
| C | 0 | 12 | 0 |
| D | 0 | 12 | 0 |
| Quadrant | Total seconds | Saturated seconds | Saturation percentage |
|---|---|---|---|
| A | 6283 | 94 | 1.496101% |
| B | 6282 | 141 | 2.244508% |
| C | 6283 | 140 | 2.228235% |
| D | 6283 | 37 | 0.588891% |
Noise dominated data is calculated using 1-second bins in cleaned event files. If a bin has >2000 counts, and if more than 50% of those come from <1% of pixels, then it is considered to be noise-dominated and hence unusable.
| Quadrant | # 1 sec bins | Bins with >0 counts | Bins with >2000 counts | High rate bins dominated by noise | Noise dominated (total time) | Noise dominated (detector-on time) | Marked lightcurve |
|---|---|---|---|---|---|---|---|
| A | 7503 | 6284 | 9 | 9 | 0.12% | 0.14% | 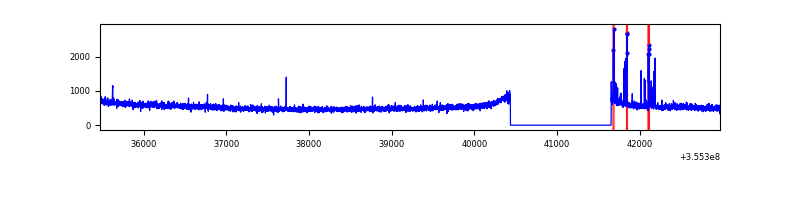 |
| B | 7502 | 6283 | 0 | 0 | 0.00% | 0.00% | 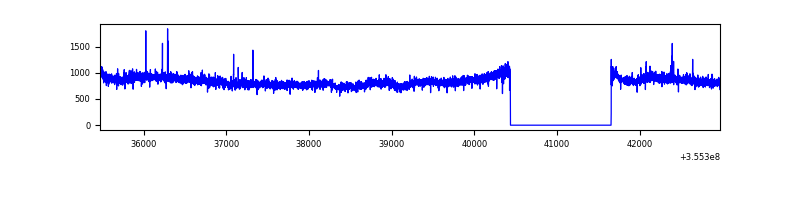 |
| C | 7503 | 6284 | 5 | 5 | 0.07% | 0.08% | 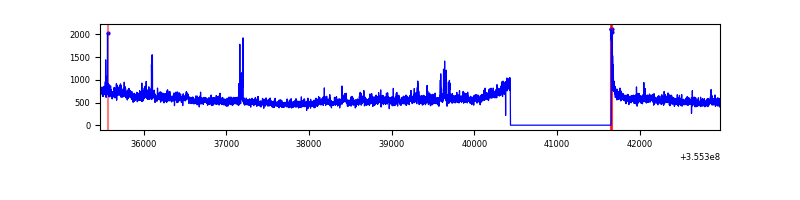 |
| D | 7503 | 6284 | 6 | 6 | 0.08% | 0.10% | 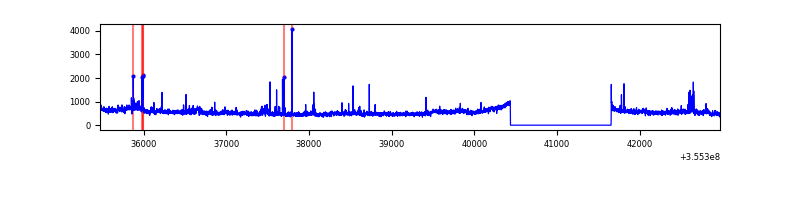 |
Top three noisy pixels from each quadrant. If the there are fewer than three noisy pixels in the level2.evt file, extra rows are filled as -1
| Pixel properties | Quadrant properties | ||||||
|---|---|---|---|---|---|---|---|
| Quadrant | DetID | PixID | Counts | Sigma | Mean | Median | Sigma |
| A | 0 | 13 | 97424 | 571.29 | 853 | 839 | 169.1 |
| A | 13 | 254 | 12883 | 71.24 | 853 | 839 | 169.1 |
| A | 3 | 137 | 7674 | 40.43 | 853 | 839 | 169.1 |
| B | 6 | 159 | 1898552 | 12151.38 | 847 | 830 | 156.2 |
| B | 0 | 190 | 29866 | 185.92 | 847 | 830 | 156.2 |
| B | 12 | 111 | 18205 | 111.25 | 847 | 830 | 156.2 |
| C | 3 | 233 | 345388 | 1875.77 | 800 | 807 | 183.7 |
| C | 14 | 238 | 132676 | 717.85 | 800 | 807 | 183.7 |
| C | 10 | 22 | 17617 | 91.51 | 800 | 807 | 183.7 |
| D | 8 | 195 | 296768 | 1571.34 | 810 | 792 | 188.4 |
| D | 13 | 153 | 82329 | 432.88 | 810 | 792 | 188.4 |
| D | 2 | 234 | 26485 | 136.4 | 810 | 792 | 188.4 |
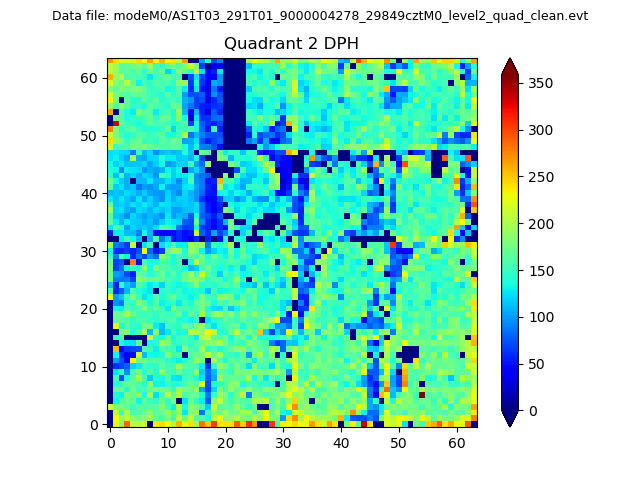
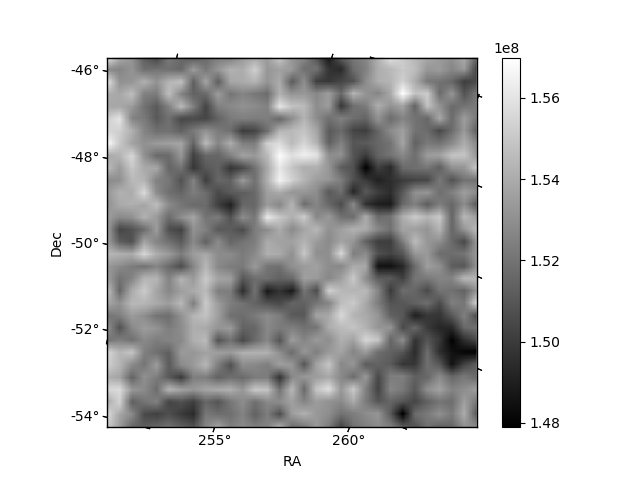
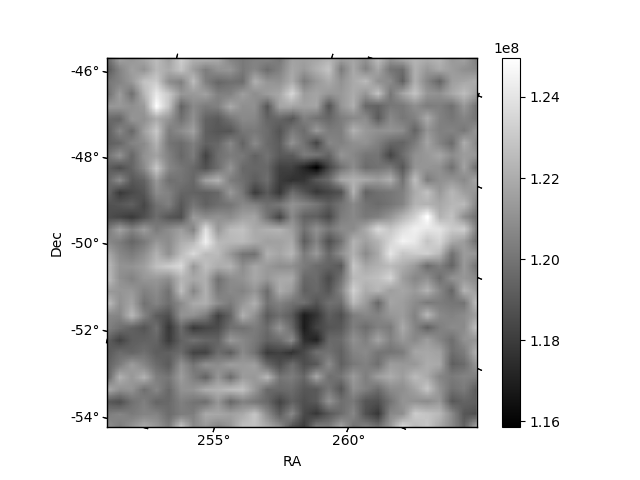
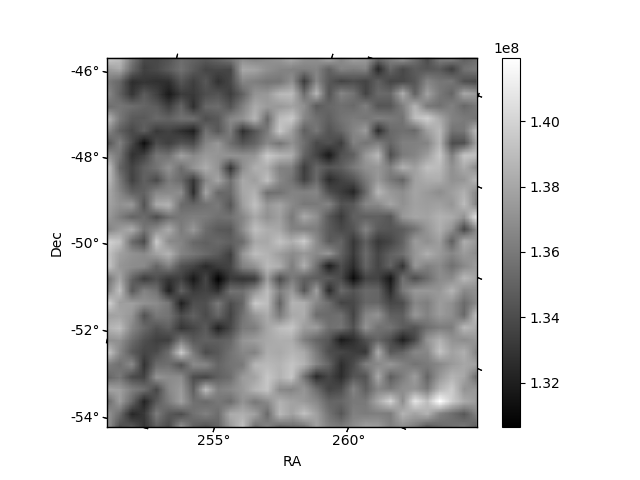
Histogram calculated using DETX and DETY for each event in the final _common_clean file
| Quadrant A | 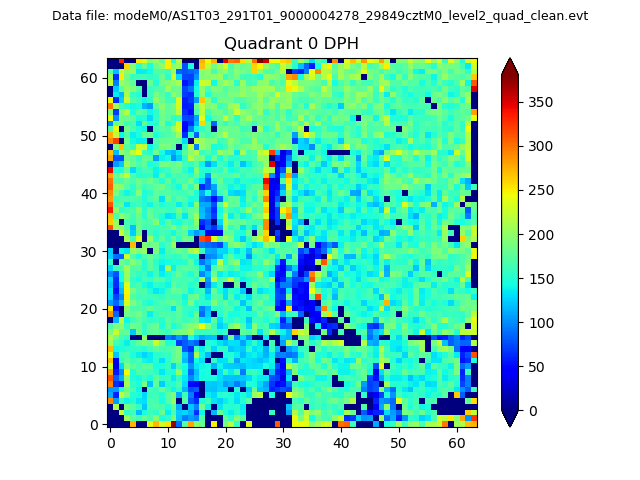 |
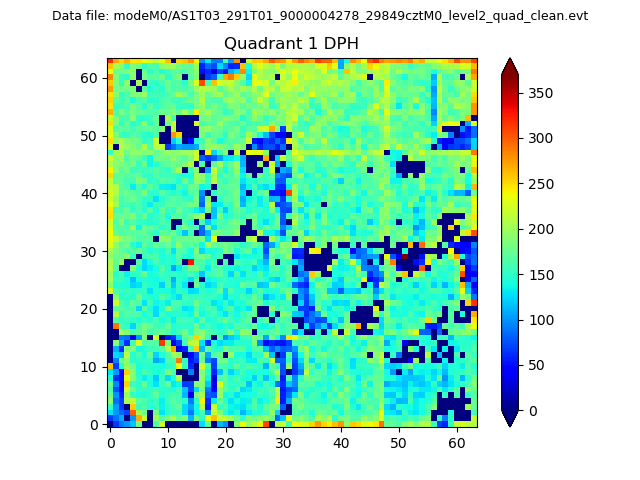 |
Quadrant B |
|---|---|---|---|
| Quadrant D | 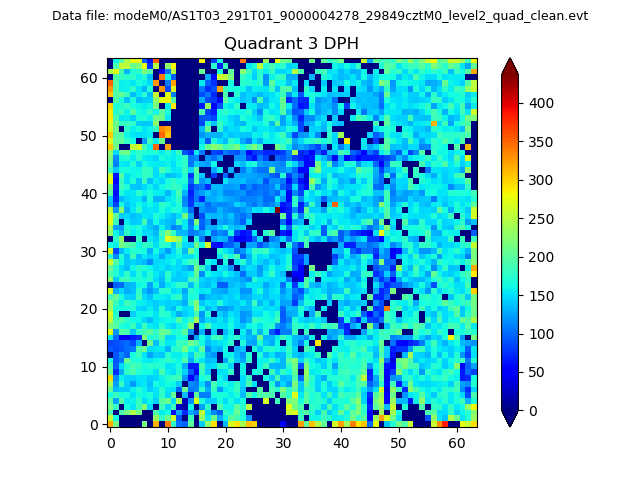 |
 |
Quadrant C |
| Plot type | Count rate plots | Images |
|---|---|---|
| Comparison with Poisson distribution Blue bars denote a histogram of data divided into 1 sec bins. Red curve is a Poisson curve with rate = median count rate of data. |
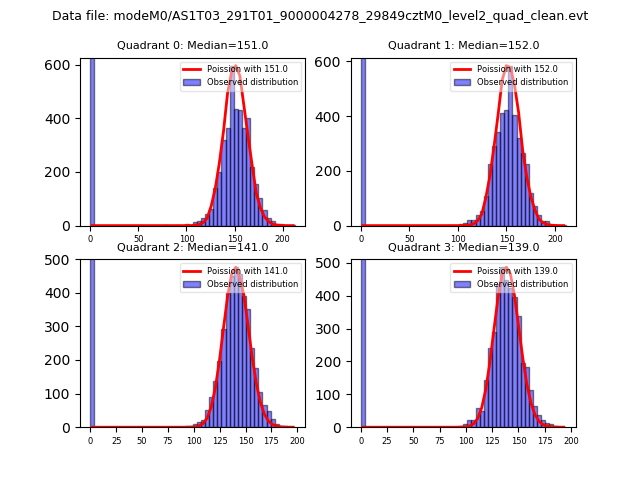 |
 |
| Quadrant-wise count rates Data is divided into 100 sec bins |
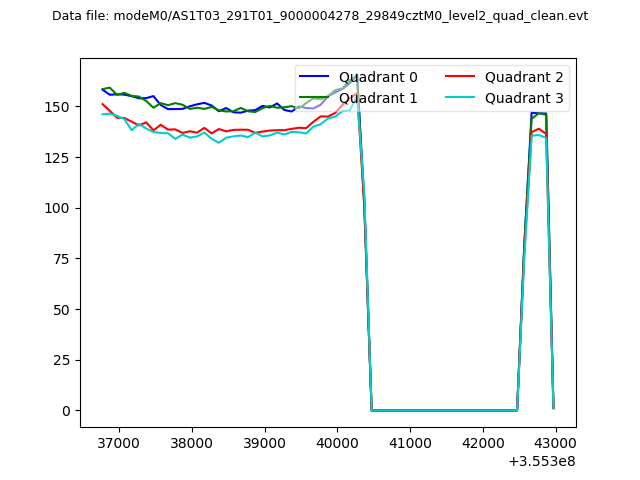 |
|
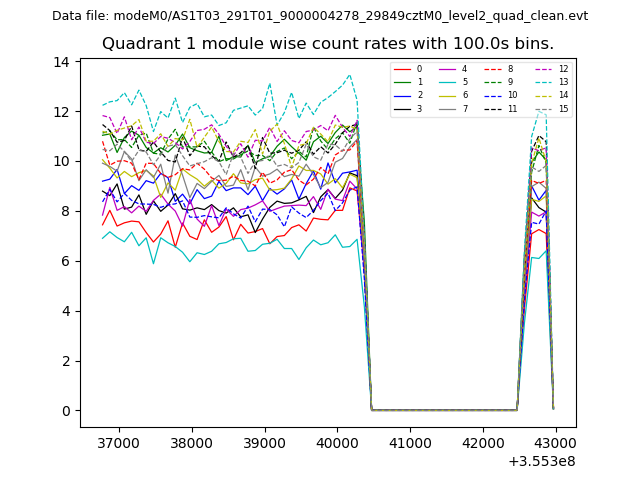
| Module-wise count rates for Quadrant A Data is divided into 100 sec bins |
 |
 |
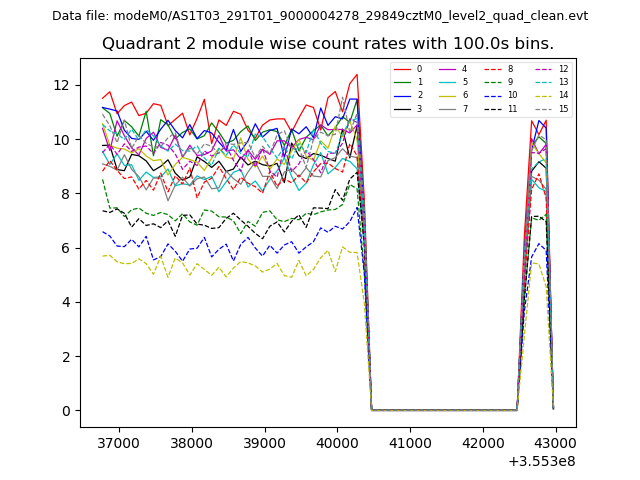
| Module-wise count rates for Quadrant B Data is divided into 100 sec bins |
 |
 |
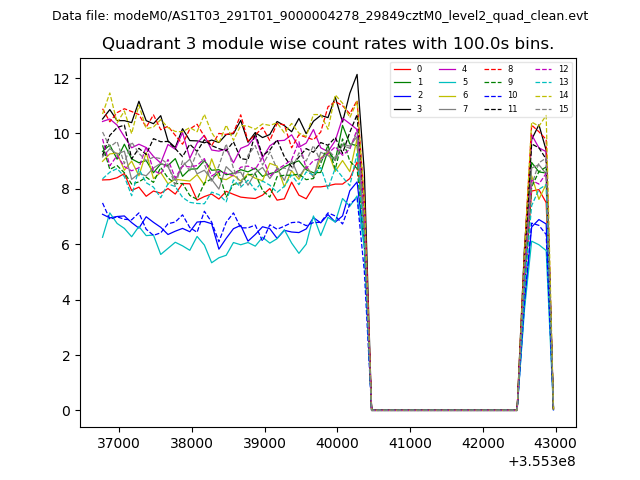
| Module-wise count rates for Quadrant C Data is divided into 100 sec bins |
 |
 |
| Module-wise count rates for Quadrant D Data is divided into 100 sec bins |
 |
 |
| Parameter | Plot |
|---|---|
| CZT HV Monitor | 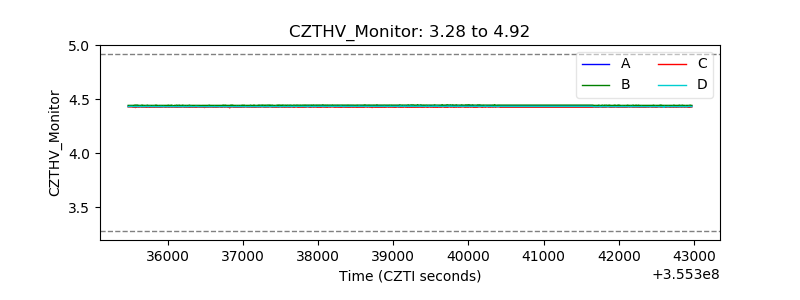 |
| D_VDD | 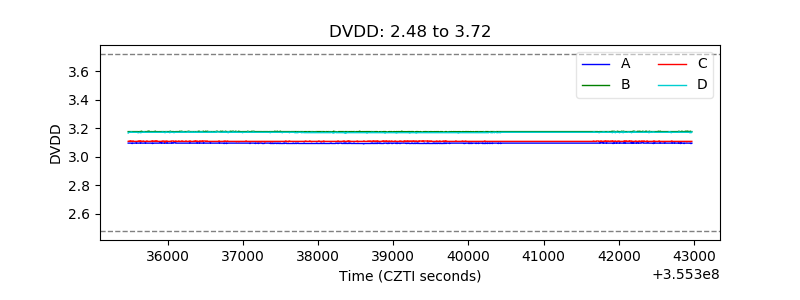 |
| Temperature 1 | 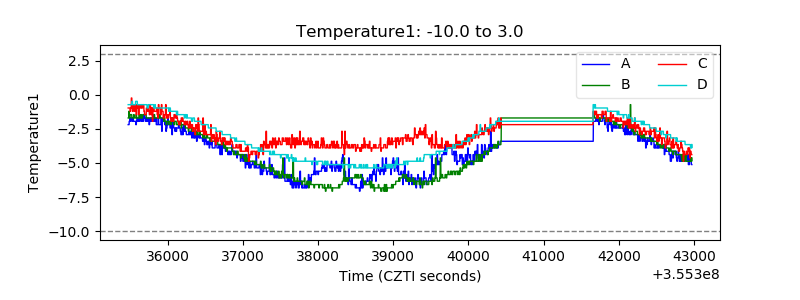 |
| Veto HV Monitor | 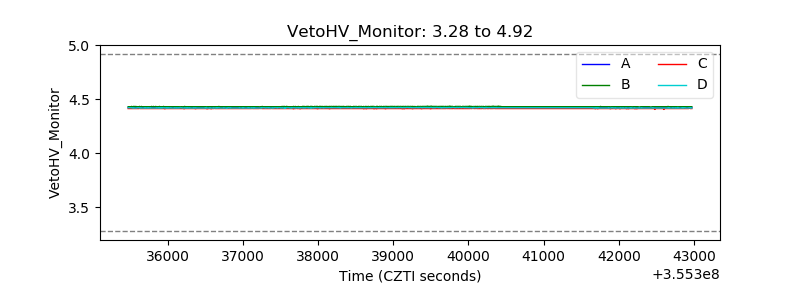 |
| Veto LLD | 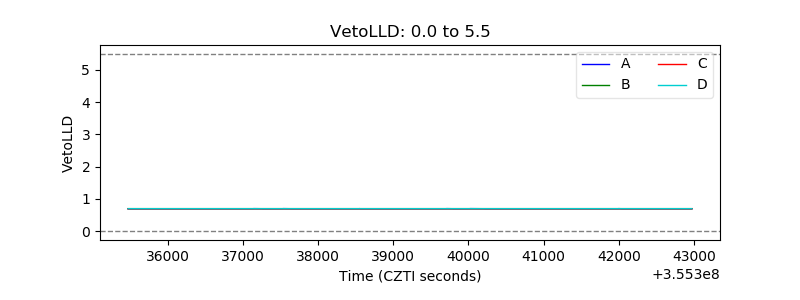 |
| Alpha Counter | 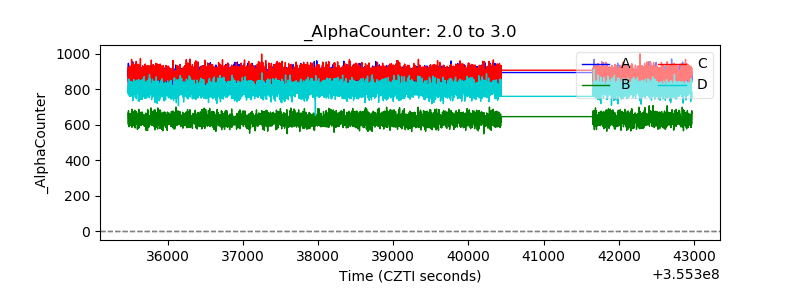 |
| _CPM_Rate |  |
| CZT Counter | 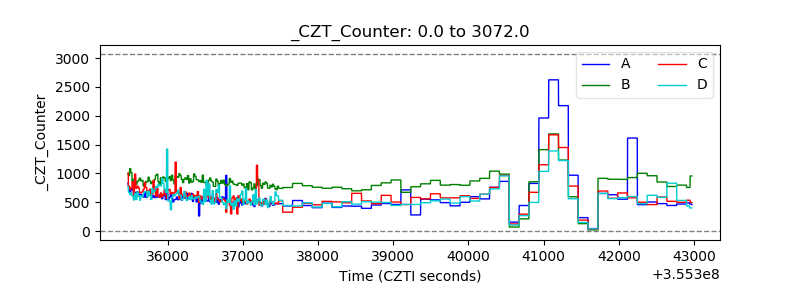 |
| +2.5 Volts monitor | 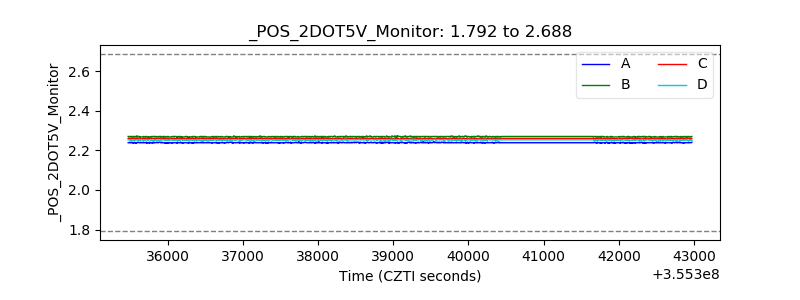 |
| +5 Volts monitor |  |
| _ROLL_ROT | 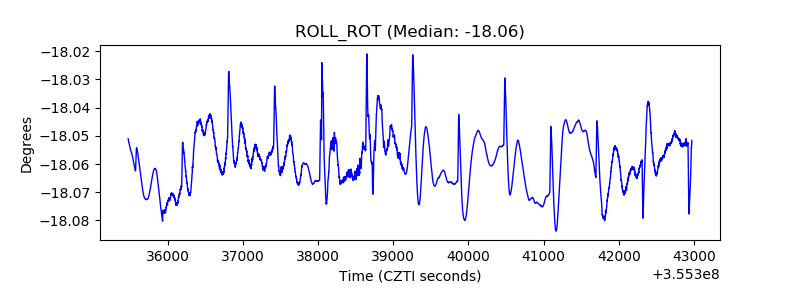 |
| _Roll_DEC | 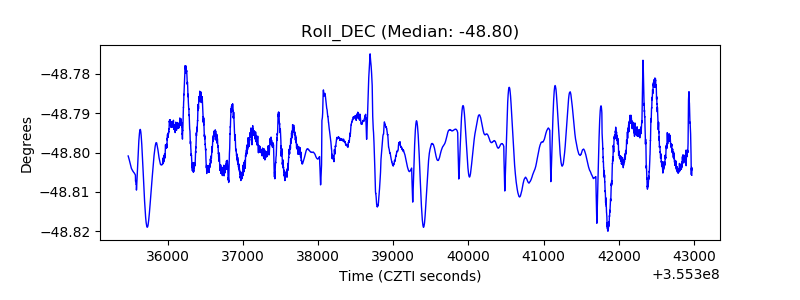 |
| _Roll_RA | 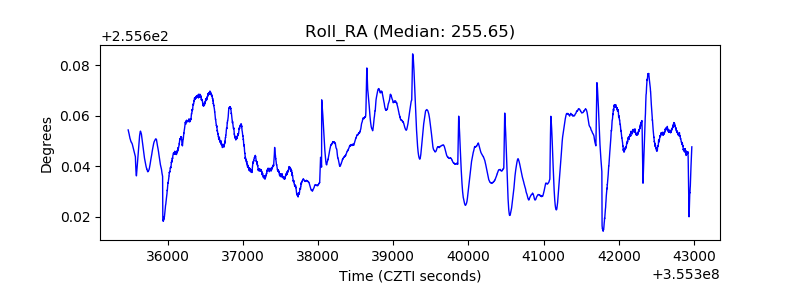 |
| Veto Counter | 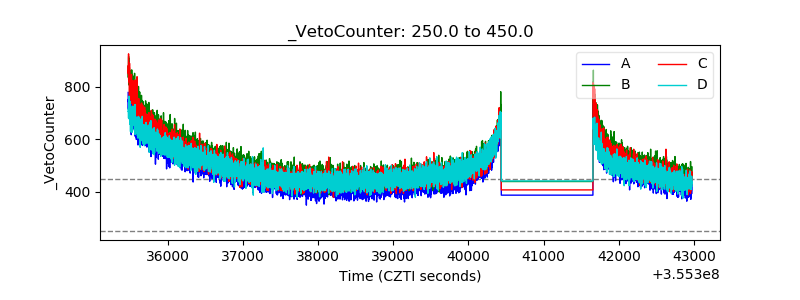 |