| Param | Original file | Final file |
|---|---|---|
| Filename | modeM0/AS1T03_291T01_9000004278_29850cztM0_level2.evt | modeM0/AS1T03_291T01_9000004278_29850cztM0_level2_quad_clean.evt |
| Size (bytes) | 557,781,120 | 100,146,240 |
| Size | 531.9 MB | 95.5 MB |
| Events in quadrant A | 3,597,928 | 660,342 |
| Events in quadrant B | 5,466,041 | 661,621 |
| Events in quadrant C | 3,760,631 | 624,898 |
| Events in quadrant D | 3,610,297 | 615,260 |
| Mode SS | |||
|---|---|---|---|
| Quadrant | BADHDUFLAG | Total packets | Discarded packets |
| A | 0 | 138 | 0 |
| B | 0 | 138 | 0 |
| C | 0 | 138 | 0 |
| D | 0 | 138 | 0 |
| Mode M0 | |||
|---|---|---|---|
| Quadrant | BADHDUFLAG | Total packets | Discarded packets |
| A | 0 | 14854 | 2 |
| B | 0 | 20649 | 2 |
| C | 0 | 15467 | 2 |
| D | 0 | 14949 | 2 |
| Mode M9 | |||
|---|---|---|---|
| Quadrant | BADHDUFLAG | Total packets | Discarded packets |
| A | 0 | 18 | 0 |
| B | 0 | 19 | 0 |
| C | 0 | 19 | 0 |
| D | 0 | 19 | 0 |
| Quadrant | Total seconds | Saturated seconds | Saturation percentage |
|---|---|---|---|
| A | 6752 | 126 | 1.866114% |
| B | 6752 | 144 | 2.132701% |
| C | 6752 | 132 | 1.954976% |
| D | 6752 | 32 | 0.473934% |
Noise dominated data is calculated using 1-second bins in cleaned event files. If a bin has >2000 counts, and if more than 50% of those come from <1% of pixels, then it is considered to be noise-dominated and hence unusable.
| Quadrant | # 1 sec bins | Bins with >0 counts | Bins with >2000 counts | High rate bins dominated by noise | Noise dominated (total time) | Noise dominated (detector-on time) | Marked lightcurve |
|---|---|---|---|---|---|---|---|
| A | 7632 | 6753 | 53 | 53 | 0.69% | 0.78% | 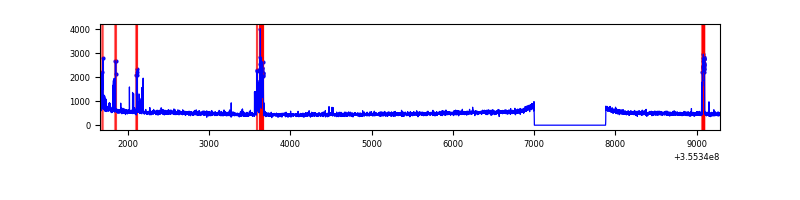 |
| B | 7632 | 6753 | 0 | 0 | 0.00% | 0.00% | 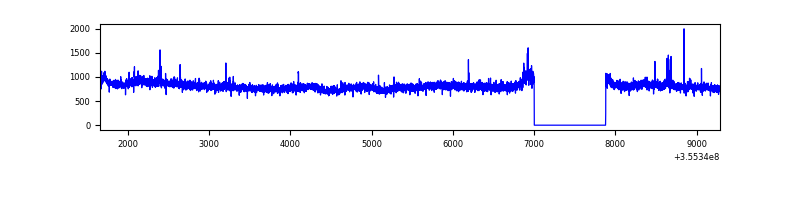 |
| C | 7632 | 6753 | 5 | 5 | 0.07% | 0.07% | 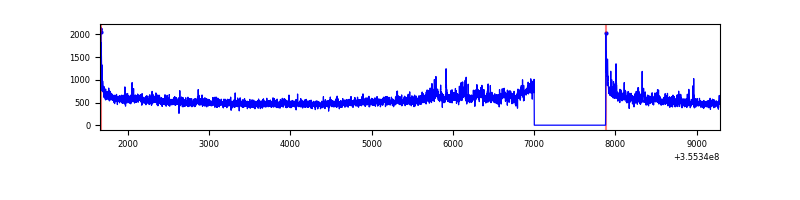 |
| D | 7632 | 6753 | 10 | 10 | 0.13% | 0.15% | 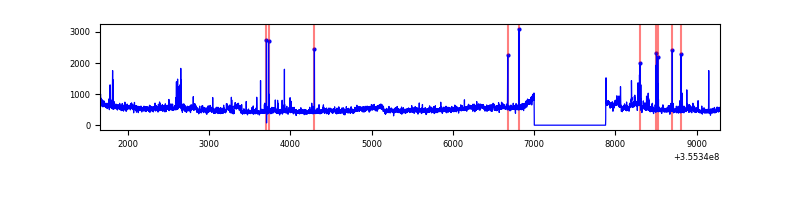 |
Top three noisy pixels from each quadrant. If the there are fewer than three noisy pixels in the level2.evt file, extra rows are filled as -1
| Pixel properties | Quadrant properties | ||||||
|---|---|---|---|---|---|---|---|
| Quadrant | DetID | PixID | Counts | Sigma | Mean | Median | Sigma |
| A | 0 | 13 | 204384 | 1192.36 | 860 | 844 | 170.7 |
| A | 15 | 174 | 68924 | 398.82 | 860 | 844 | 170.7 |
| A | 13 | 254 | 12946 | 70.9 | 860 | 844 | 170.7 |
| B | 6 | 159 | 2041618 | 12658.55 | 856 | 837 | 161.2 |
| B | 0 | 190 | 29559 | 178.15 | 856 | 837 | 161.2 |
| B | 12 | 111 | 19205 | 113.93 | 856 | 837 | 161.2 |
| C | 3 | 233 | 426059 | 2242.18 | 816 | 820 | 189.7 |
| C | 14 | 238 | 133653 | 700.4 | 816 | 820 | 189.7 |
| C | 2 | 114 | 16360 | 81.94 | 816 | 820 | 189.7 |
| D | 8 | 195 | 319045 | 1631.15 | 824 | 802 | 195.1 |
| D | 13 | 138 | 43466 | 218.67 | 824 | 802 | 195.1 |
| D | 2 | 250 | 34706 | 173.77 | 824 | 802 | 195.1 |
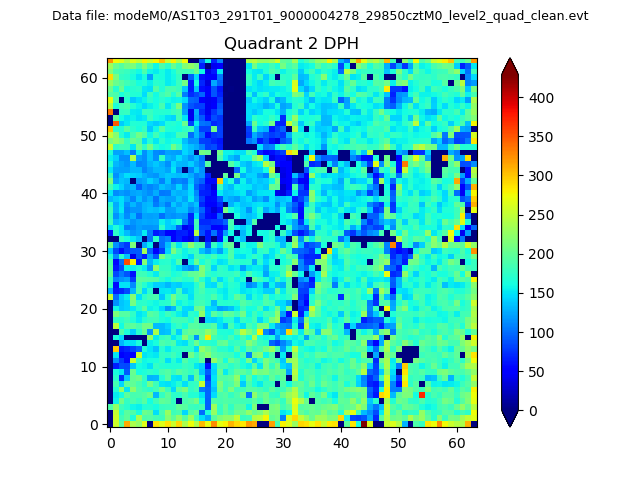
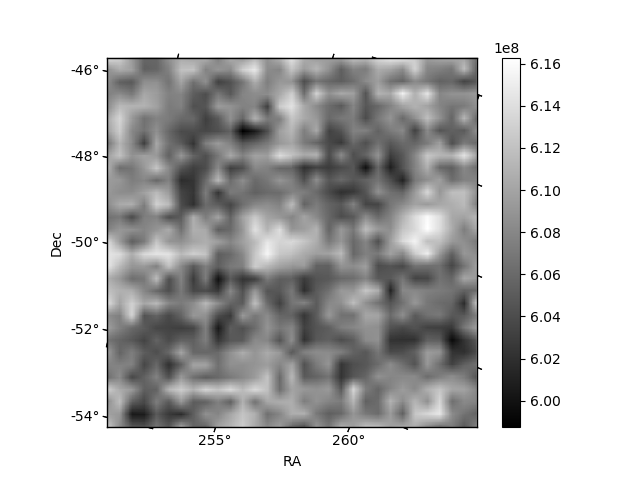
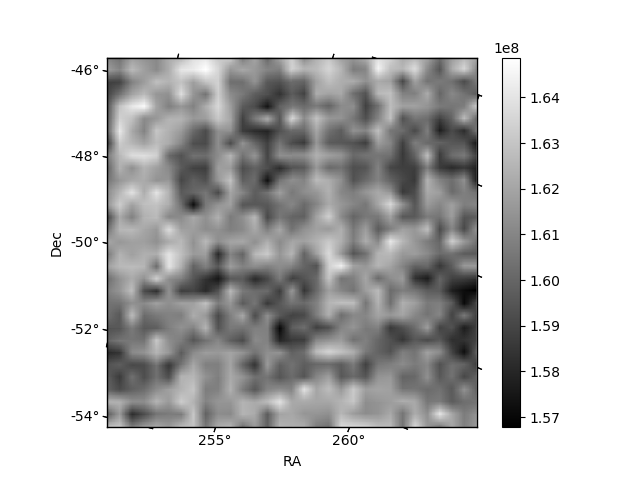
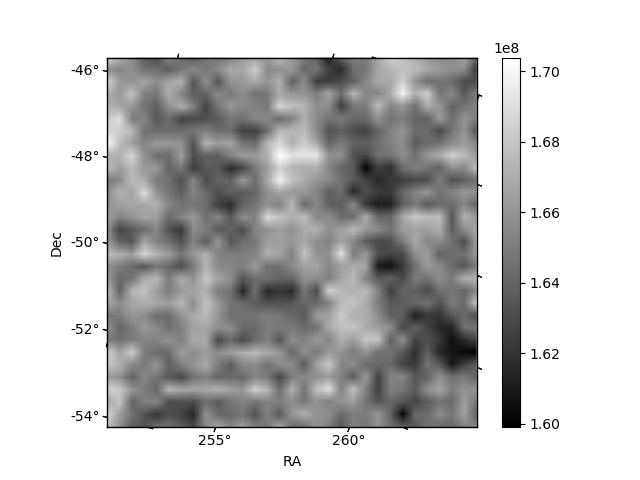
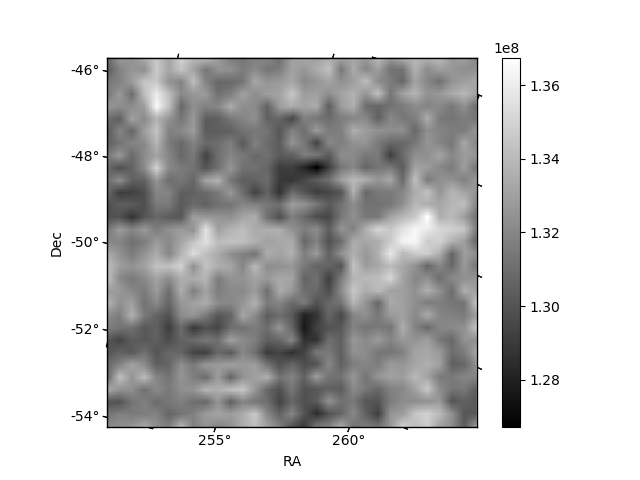
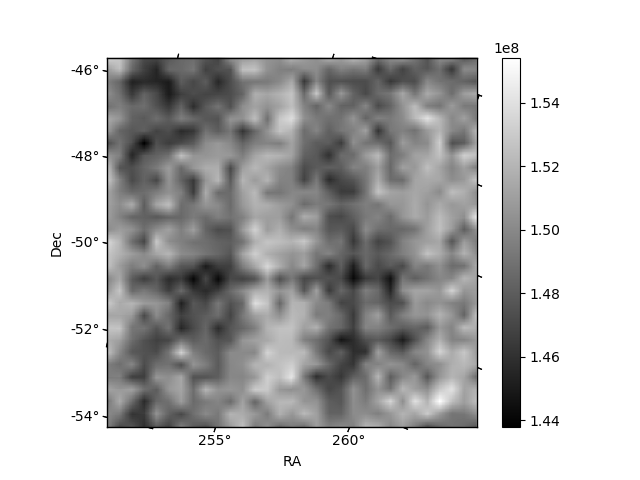
Histogram calculated using DETX and DETY for each event in the final _common_clean file
| Quadrant A | 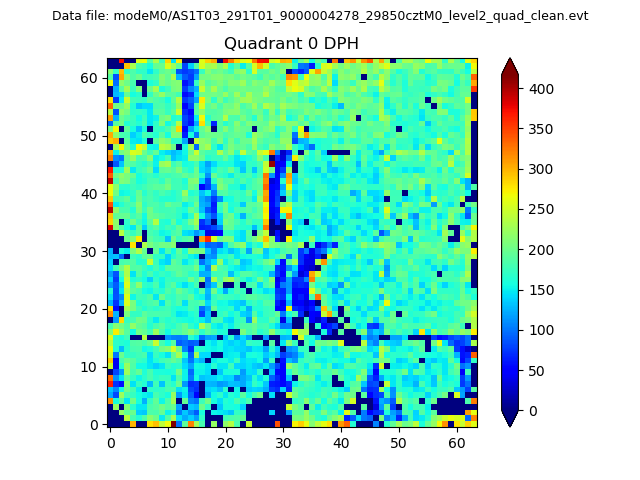 |
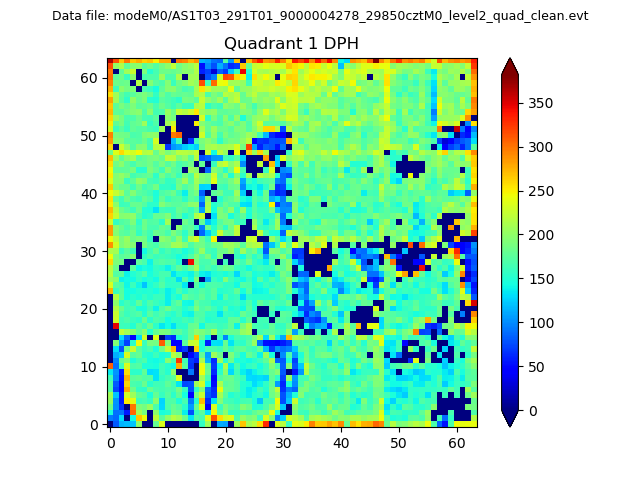 |
Quadrant B |
|---|---|---|---|
| Quadrant D | 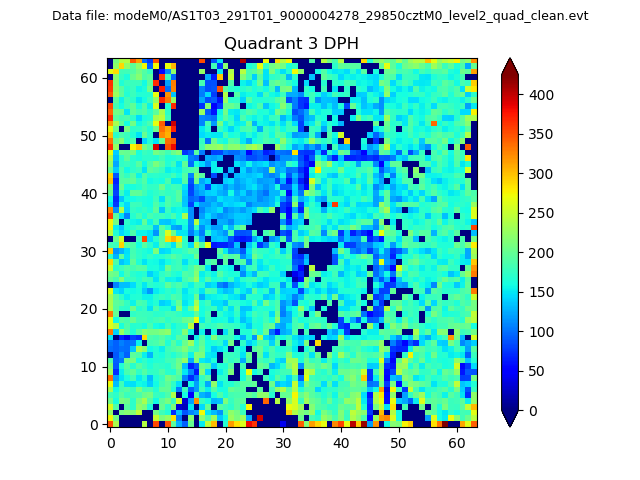 |
 |
Quadrant C |
| Plot type | Count rate plots | Images |
|---|---|---|
| Comparison with Poisson distribution Blue bars denote a histogram of data divided into 1 sec bins. Red curve is a Poisson curve with rate = median count rate of data. |
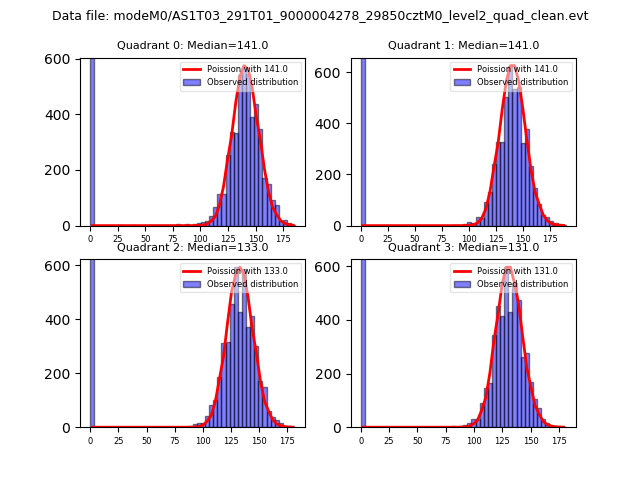 |
 |
| Quadrant-wise count rates Data is divided into 100 sec bins |
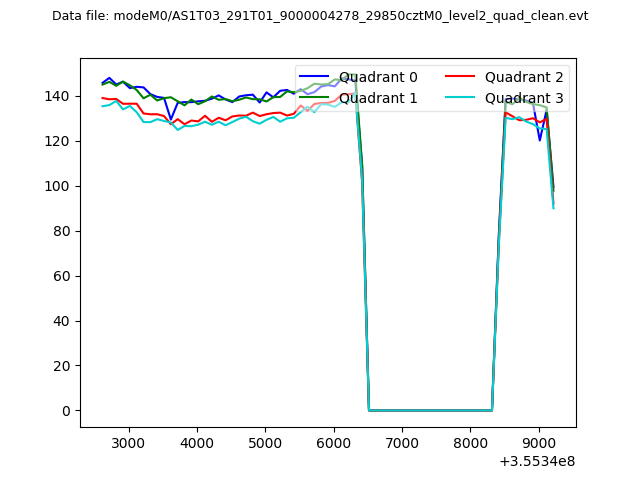 |
|
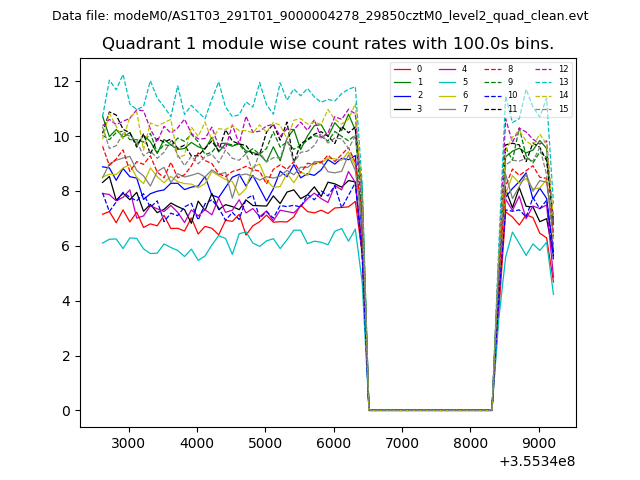
| Module-wise count rates for Quadrant A Data is divided into 100 sec bins |
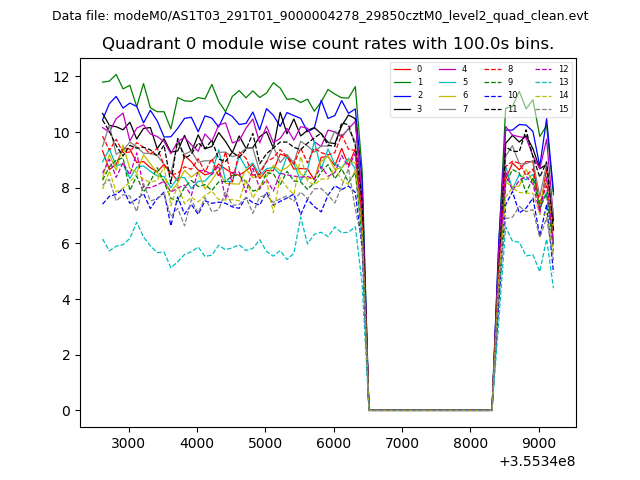 |
 |
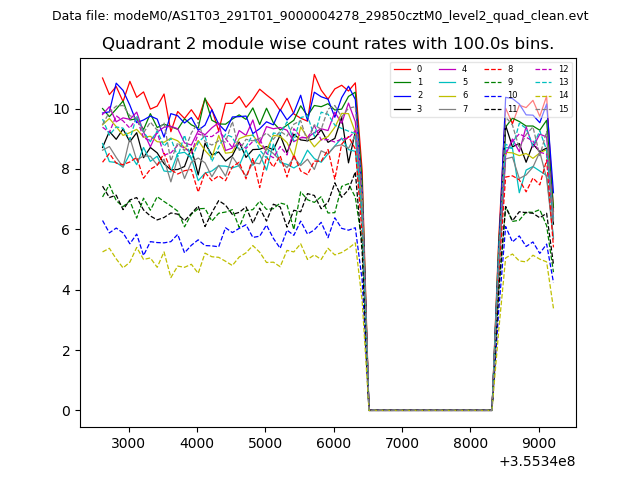
| Module-wise count rates for Quadrant B Data is divided into 100 sec bins |
 |
 |
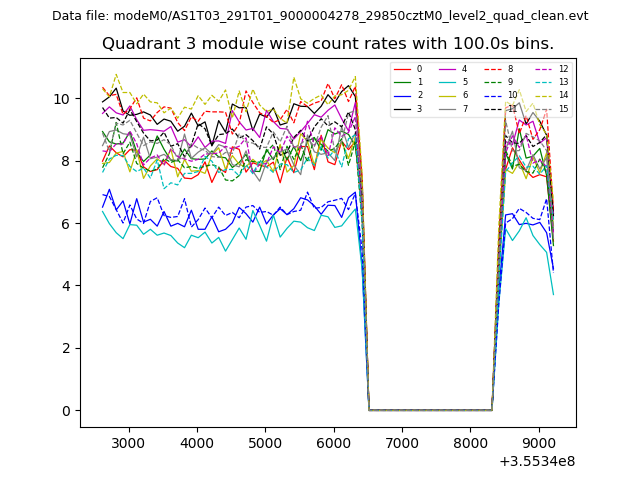
| Module-wise count rates for Quadrant C Data is divided into 100 sec bins |
 |
 |
| Module-wise count rates for Quadrant D Data is divided into 100 sec bins |
 |
 |
| Parameter | Plot |
|---|---|
| CZT HV Monitor | 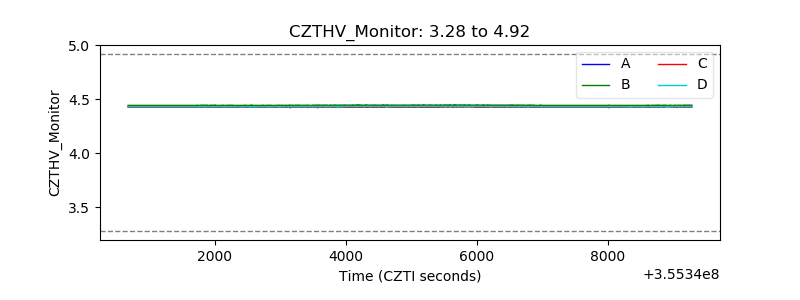 |
| D_VDD | 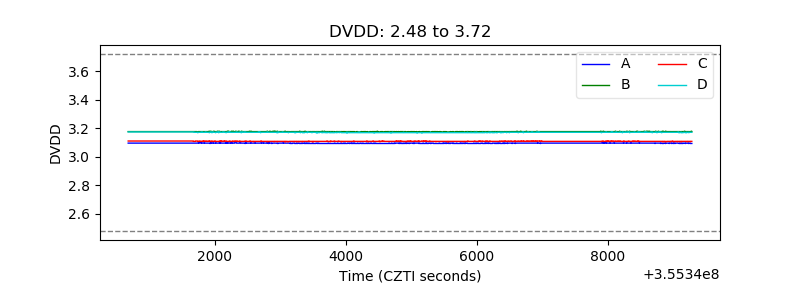 |
| Temperature 1 | 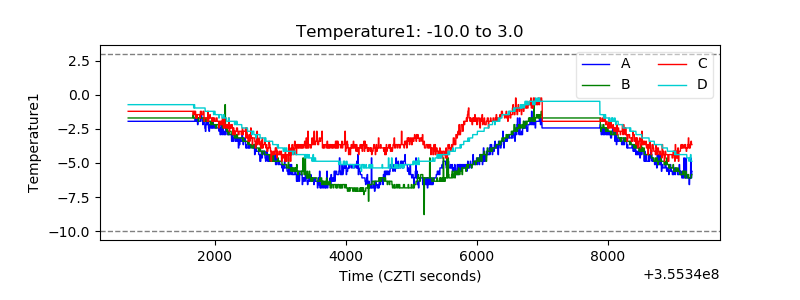 |
| Veto HV Monitor | 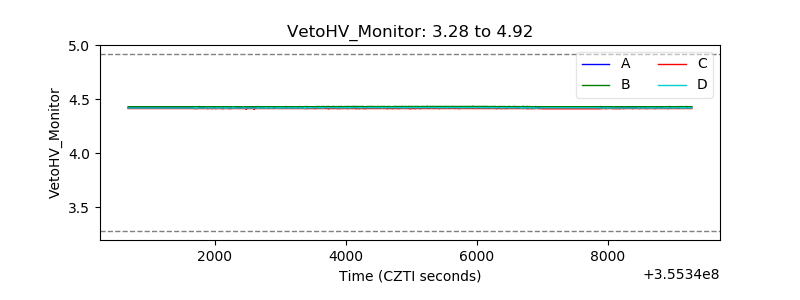 |
| Veto LLD | 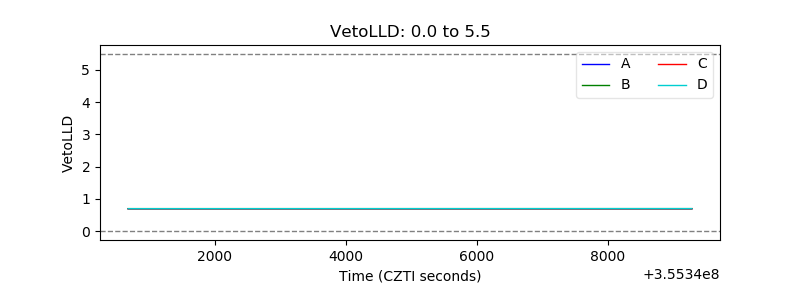 |
| Alpha Counter | 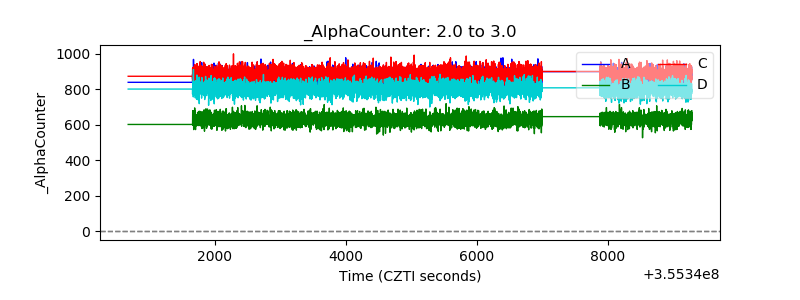 |
| _CPM_Rate | 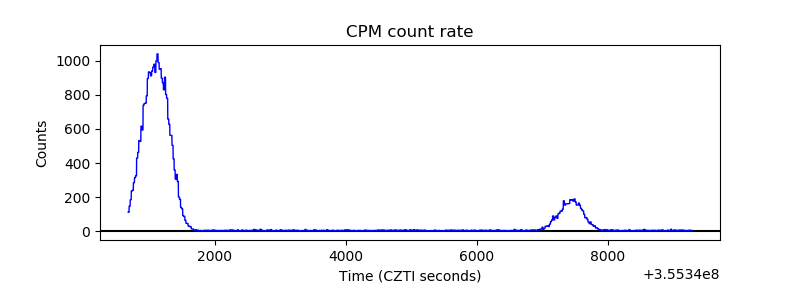 |
| CZT Counter | 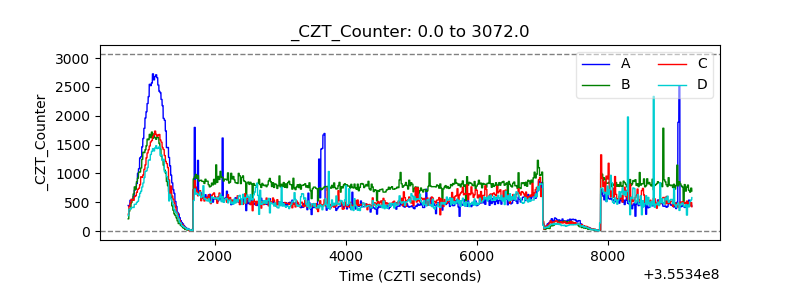 |
| +2.5 Volts monitor | 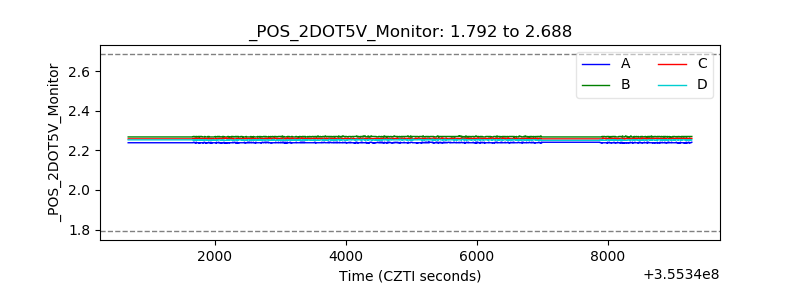 |
| +5 Volts monitor |  |
| _ROLL_ROT | 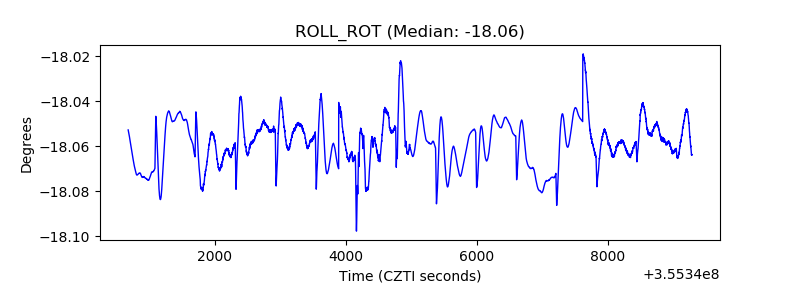 |
| _Roll_DEC | 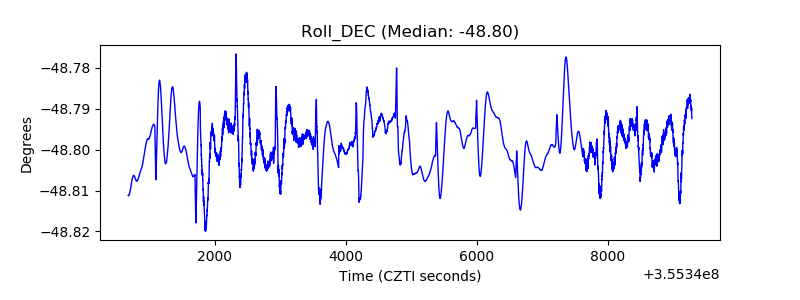 |
| _Roll_RA | 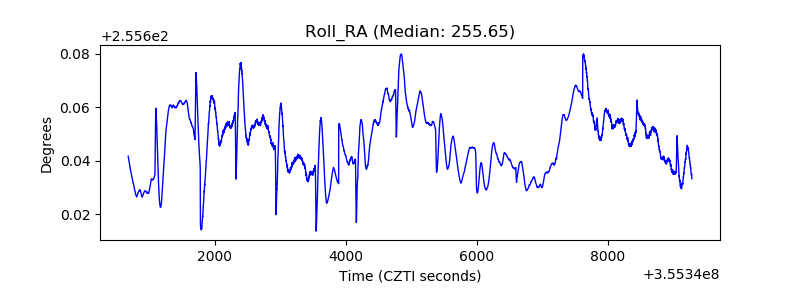 |
| Veto Counter | 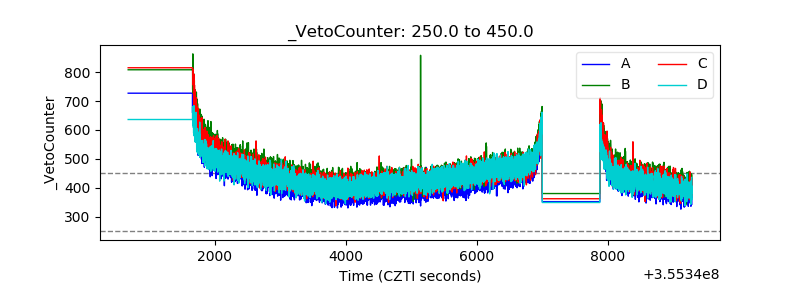 |