| Param | Original file | Final file |
|---|---|---|
| Filename | modeM0/AS1T03_291T01_9000004278_29852cztM0_level2.evt | modeM0/AS1T03_291T01_9000004278_29852cztM0_level2_quad_clean.evt |
| Size (bytes) | 716,218,560 | 112,204,800 |
| Size | 683.0 MB | 107.0 MB |
| Events in quadrant A | 4,099,268 | 732,145 |
| Events in quadrant B | 6,448,900 | 732,464 |
| Events in quadrant C | 5,365,624 | 691,367 |
| Events in quadrant D | 5,227,657 | 677,275 |
| Mode SS | |||
|---|---|---|---|
| Quadrant | BADHDUFLAG | Total packets | Discarded packets |
| A | 0 | 166 | 0 |
| B | 0 | 166 | 0 |
| C | 0 | 166 | 0 |
| D | 0 | 166 | 0 |
| Mode M0 | |||
|---|---|---|---|
| Quadrant | BADHDUFLAG | Total packets | Discarded packets |
| A | 0 | 17451 | 3 |
| B | 0 | 25015 | 3 |
| C | 0 | 21563 | 3 |
| D | 0 | 20886 | 3 |
| Mode M9 | |||
|---|---|---|---|
| Quadrant | BADHDUFLAG | Total packets | Discarded packets |
| A | 0 | 4 | 0 |
| B | 0 | 4 | 0 |
| C | 0 | 4 | 0 |
| D | 0 | 4 | 0 |
| Quadrant | Total seconds | Saturated seconds | Saturation percentage |
|---|---|---|---|
| A | 8122 | 106 | 1.305097% |
| B | 8123 | 283 | 3.483935% |
| C | 8123 | 291 | 3.582420% |
| D | 8123 | 131 | 1.612705% |
Noise dominated data is calculated using 1-second bins in cleaned event files. If a bin has >2000 counts, and if more than 50% of those come from <1% of pixels, then it is considered to be noise-dominated and hence unusable.
| Quadrant | # 1 sec bins | Bins with >0 counts | Bins with >2000 counts | High rate bins dominated by noise | Noise dominated (total time) | Noise dominated (detector-on time) | Marked lightcurve |
|---|---|---|---|---|---|---|---|
| A | 8592 | 8123 | 15 | 15 | 0.17% | 0.18% | 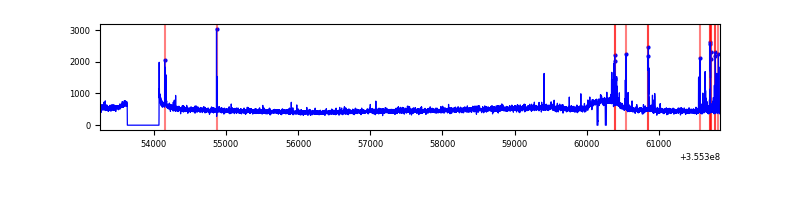 |
| B | 8593 | 8124 | 0 | 0 | 0.00% | 0.00% | 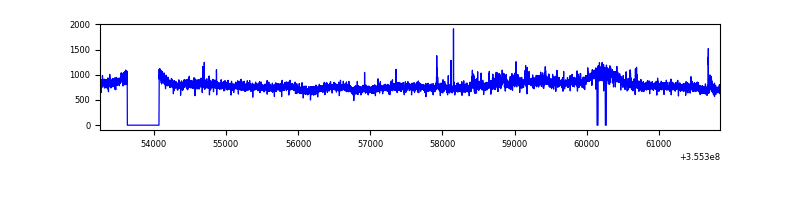 |
| C | 8593 | 8124 | 4 | 4 | 0.05% | 0.05% | 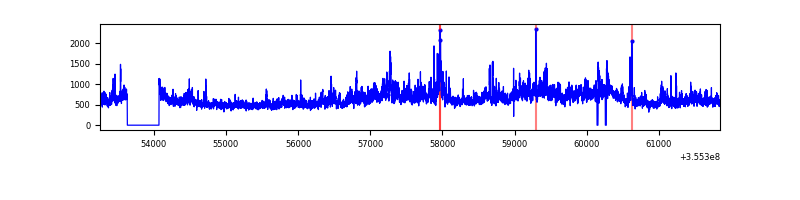 |
| D | 8593 | 8124 | 55 | 55 | 0.64% | 0.68% | 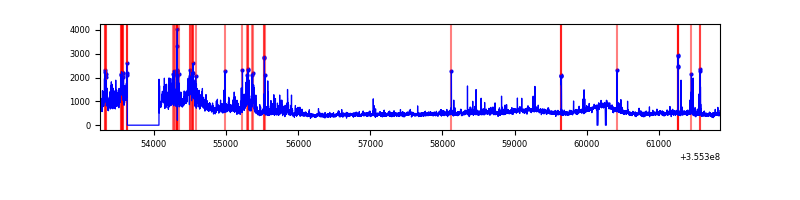 |
Top three noisy pixels from each quadrant. If the there are fewer than three noisy pixels in the level2.evt file, extra rows are filled as -1
| Pixel properties | Quadrant properties | ||||||
|---|---|---|---|---|---|---|---|
| Quadrant | DetID | PixID | Counts | Sigma | Mean | Median | Sigma |
| A | 0 | 13 | 145306 | 702.19 | 1018 | 997 | 205.5 |
| A | 15 | 174 | 23809 | 111.0 | 1018 | 997 | 205.5 |
| A | 13 | 254 | 16296 | 74.44 | 1018 | 997 | 205.5 |
| B | 6 | 159 | 2382679 | 12331.65 | 1010 | 985 | 193.1 |
| B | 0 | 190 | 74197 | 379.07 | 1010 | 985 | 193.1 |
| B | 12 | 111 | 24321 | 120.83 | 1010 | 985 | 193.1 |
| C | 3 | 233 | 1354908 | 6004.89 | 969 | 973 | 225.5 |
| C | 14 | 238 | 173622 | 765.72 | 969 | 973 | 225.5 |
| C | 14 | 254 | 25140 | 107.18 | 969 | 973 | 225.5 |
| D | 8 | 195 | 1258638 | 5386.93 | 977 | 951 | 233.5 |
| D | 2 | 250 | 78362 | 331.57 | 977 | 951 | 233.5 |
| D | 7 | 80 | 74910 | 316.78 | 977 | 951 | 233.5 |
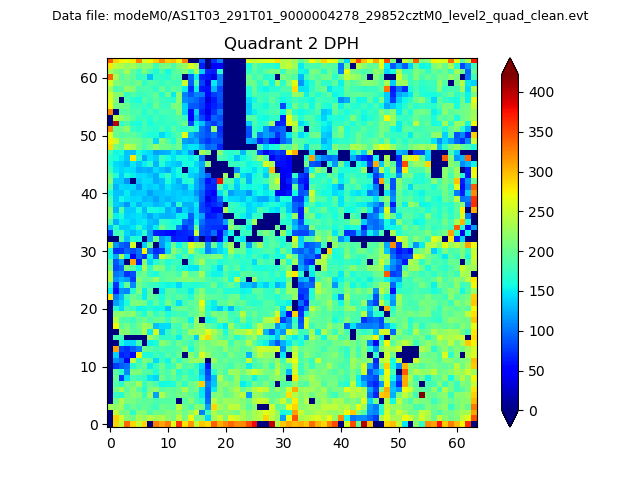
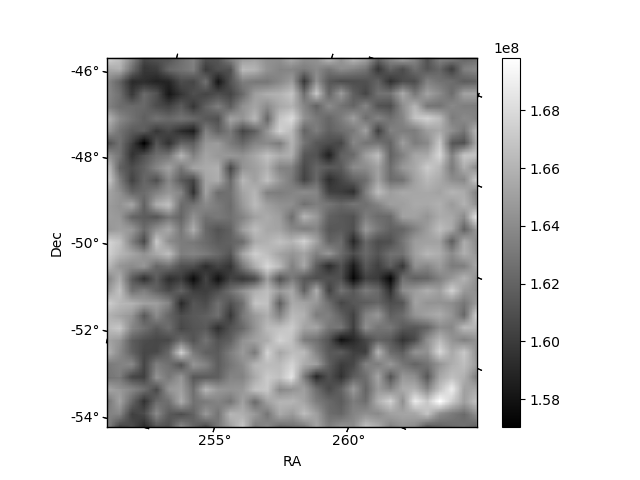
Histogram calculated using DETX and DETY for each event in the final _common_clean file
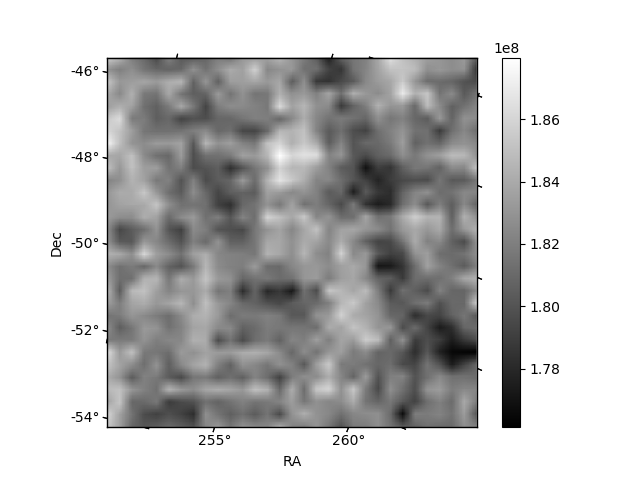
| Quadrant A | 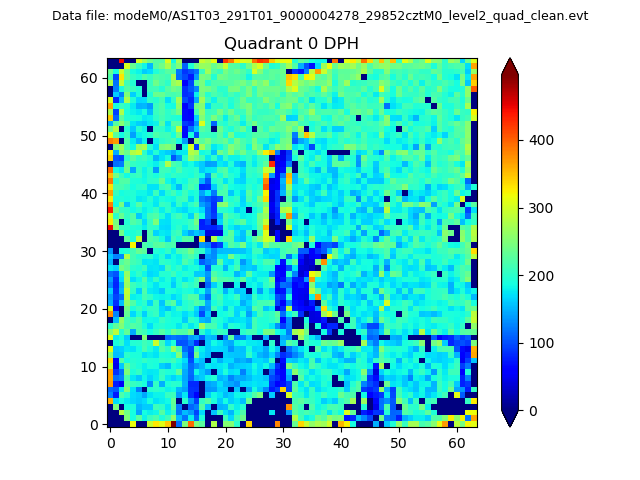 |
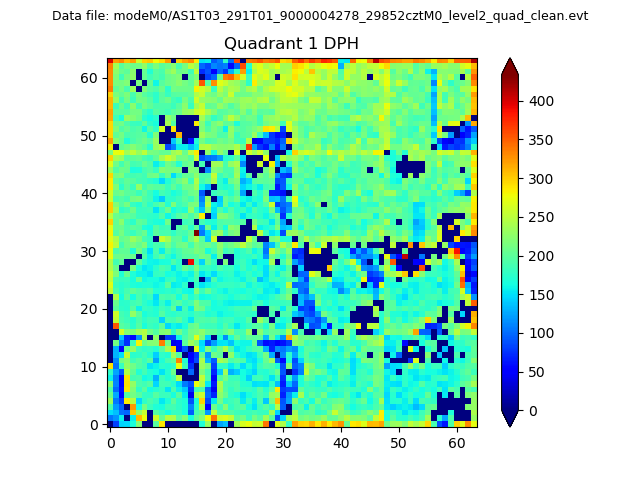 |
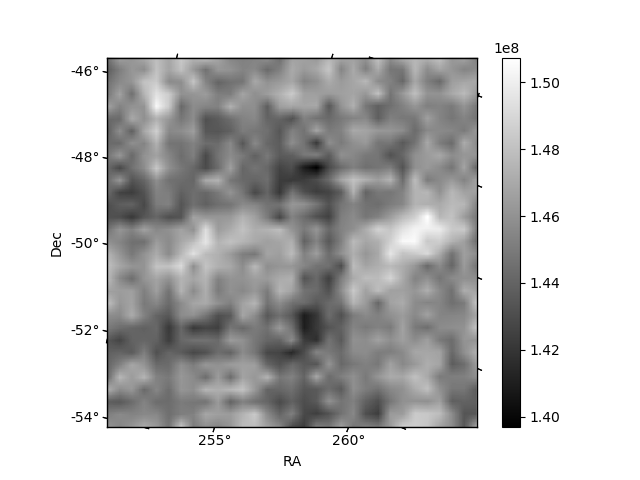
Quadrant B |
|---|---|---|---|
| Quadrant D | 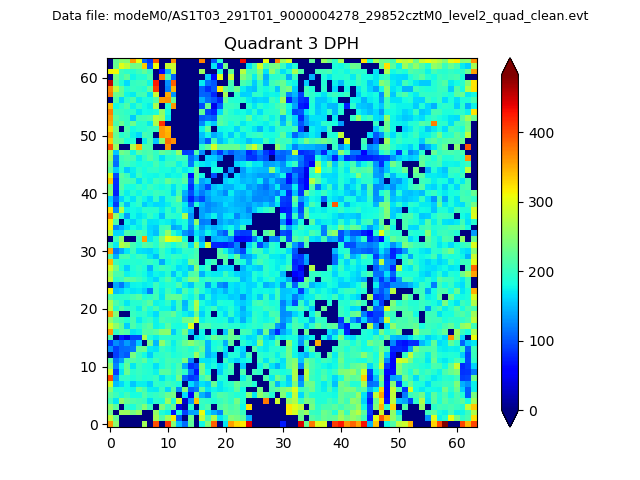 |
 |
Quadrant C |
| Plot type | Count rate plots | Images |
|---|---|---|
| Comparison with Poisson distribution Blue bars denote a histogram of data divided into 1 sec bins. Red curve is a Poisson curve with rate = median count rate of data. |
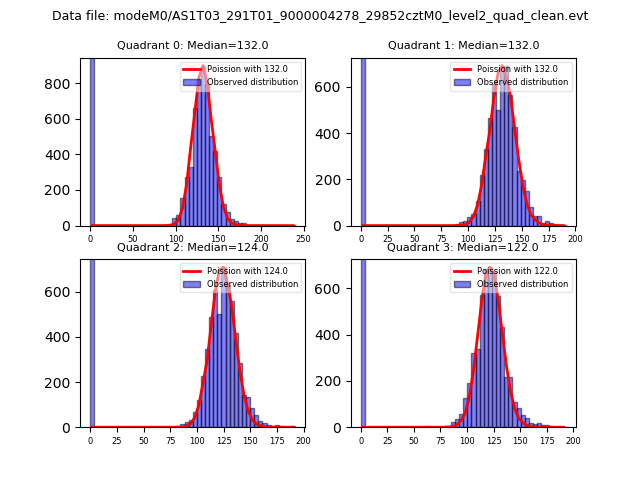 |
 |
| Quadrant-wise count rates Data is divided into 100 sec bins |
 |
|
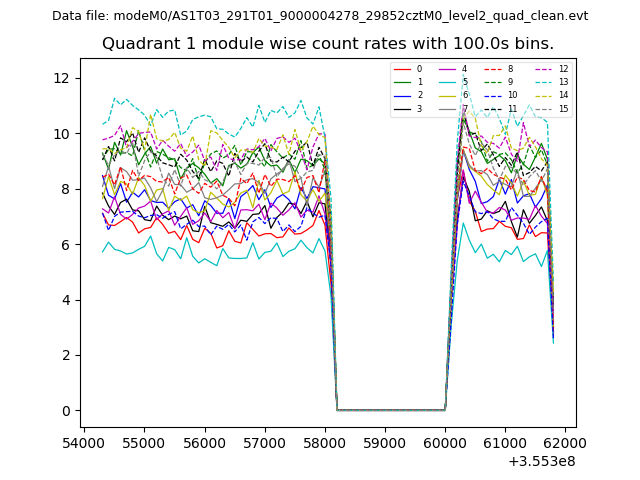
| Module-wise count rates for Quadrant A Data is divided into 100 sec bins |
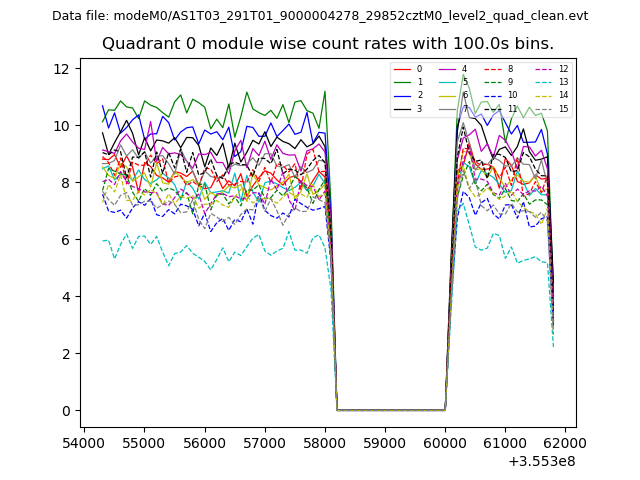 |
 |
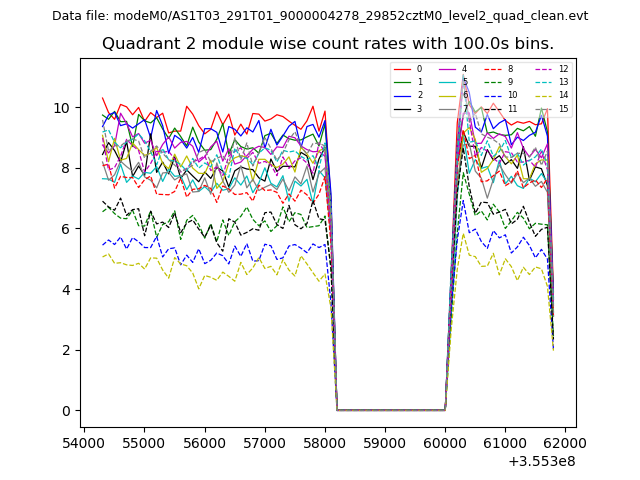
| Module-wise count rates for Quadrant B Data is divided into 100 sec bins |
 |
 |
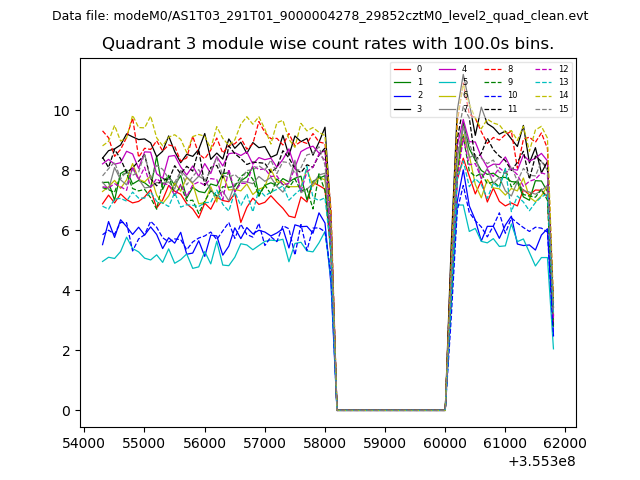
| Module-wise count rates for Quadrant C Data is divided into 100 sec bins |
 |
 |
| Module-wise count rates for Quadrant D Data is divided into 100 sec bins |
 |
 |
| Parameter | Plot |
|---|---|
| CZT HV Monitor | 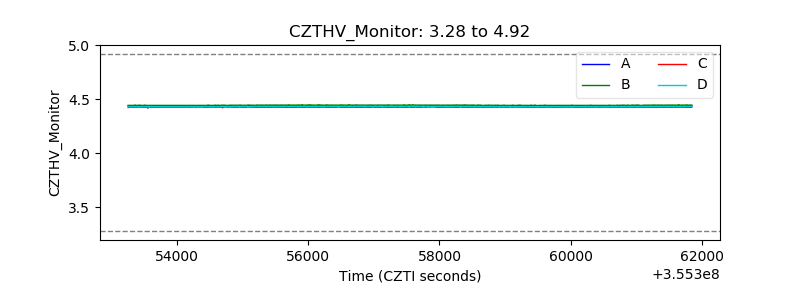 |
| D_VDD | 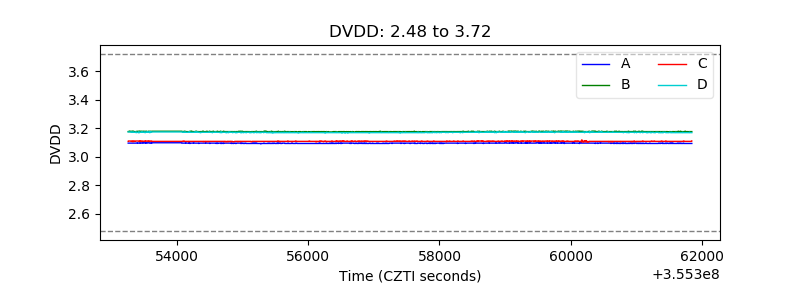 |
| Temperature 1 | 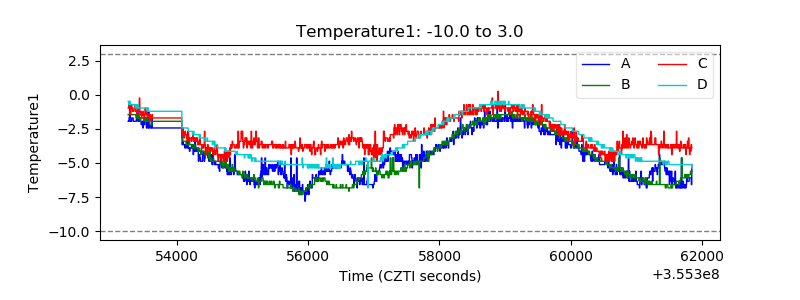 |
| Veto HV Monitor | 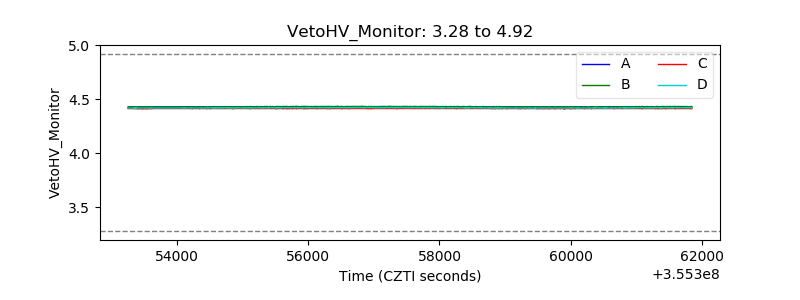 |
| Veto LLD | 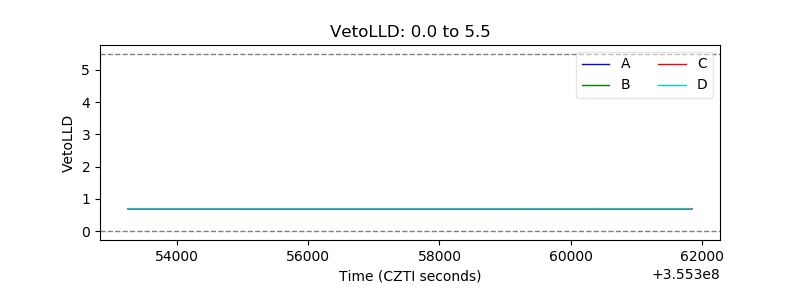 |
| Alpha Counter | 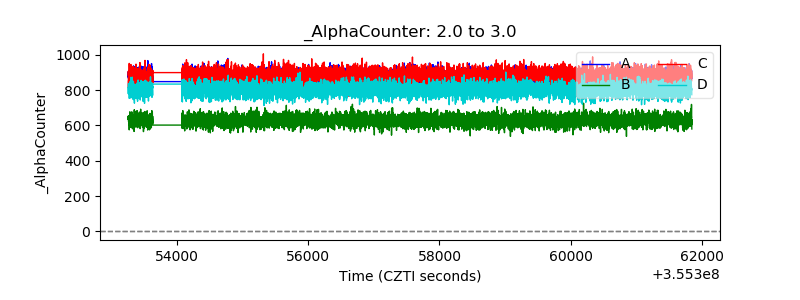 |
| _CPM_Rate | 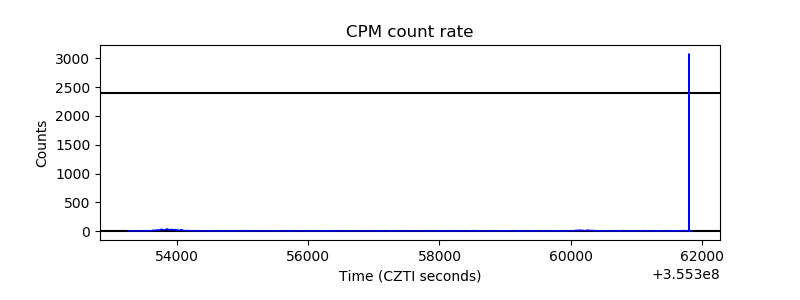 |
| CZT Counter | 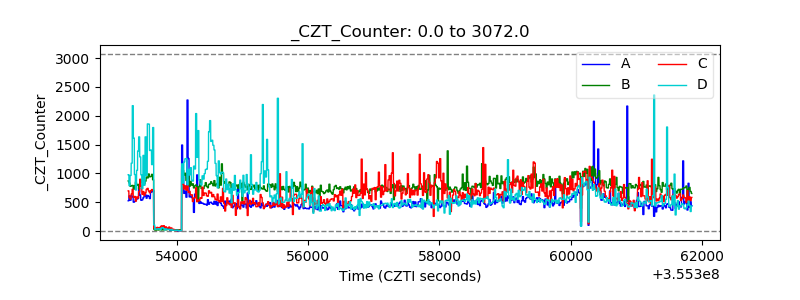 |
| +2.5 Volts monitor |  |
| +5 Volts monitor |  |
| _ROLL_ROT | 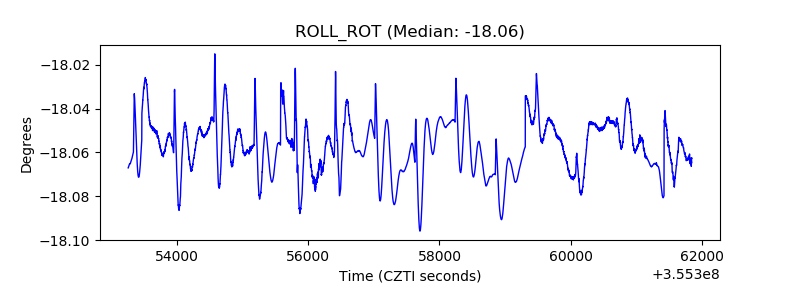 |
| _Roll_DEC | 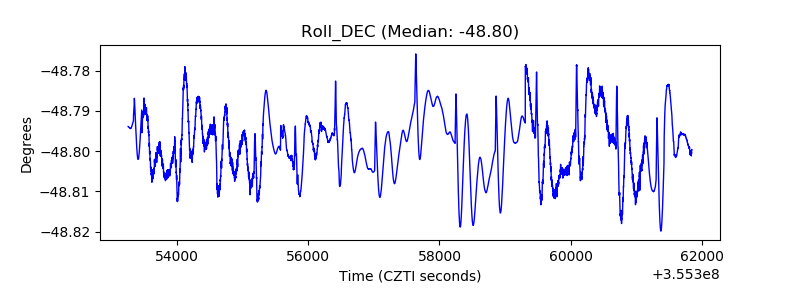 |
| _Roll_RA | 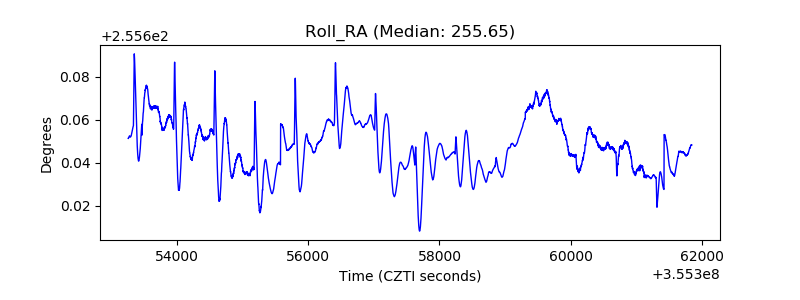 |
| Veto Counter | 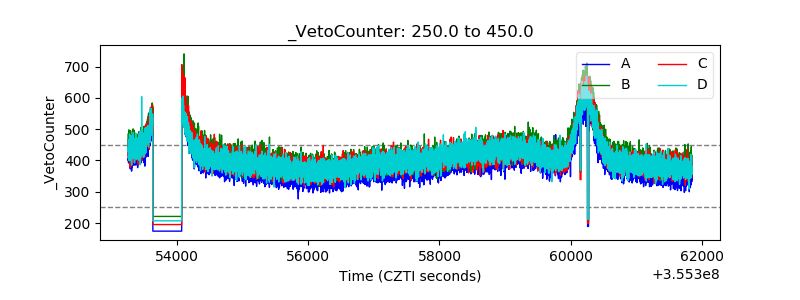 |