| Param | Original file | Final file |
|---|---|---|
| Filename | modeM0/AS1T03_291T01_9000004278_29857cztM0_level2.evt | modeM0/AS1T03_291T01_9000004278_29857cztM0_level2_quad_clean.evt |
| Size (bytes) | 88,511,040 | 10,581,120 |
| Size | 84.4 MB | 10.1 MB |
| Events in quadrant A | 570,788 | 64,216 |
| Events in quadrant B | 794,358 | 64,239 |
| Events in quadrant C | 687,224 | 60,888 |
| Events in quadrant D | 566,012 | 62,359 |
| Mode SS | |||
|---|---|---|---|
| Quadrant | BADHDUFLAG | Total packets | Discarded packets |
| A | 0 | 18 | 0 |
| B | 0 | 18 | 0 |
| C | 0 | 18 | 0 |
| D | 0 | 18 | 0 |
| Mode M0 | |||
|---|---|---|---|
| Quadrant | BADHDUFLAG | Total packets | Discarded packets |
| A | 0 | 2270 | 2 |
| B | 0 | 2947 | 2 |
| C | 0 | 2687 | 2 |
| D | 0 | 2273 | 2 |
| Quadrant | Total seconds | Saturated seconds | Saturation percentage |
|---|---|---|---|
| A | 865 | 63 | 7.283237% |
| B | 866 | 198 | 22.863741% |
| C | 866 | 161 | 18.591224% |
| D | 866 | 23 | 2.655889% |
Noise dominated data is calculated using 1-second bins in cleaned event files. If a bin has >2000 counts, and if more than 50% of those come from <1% of pixels, then it is considered to be noise-dominated and hence unusable.
| Quadrant | # 1 sec bins | Bins with >0 counts | Bins with >2000 counts | High rate bins dominated by noise | Noise dominated (total time) | Noise dominated (detector-on time) | Marked lightcurve |
|---|---|---|---|---|---|---|---|
| A | 895 | 866 | 3 | 3 | 0.34% | 0.35% | 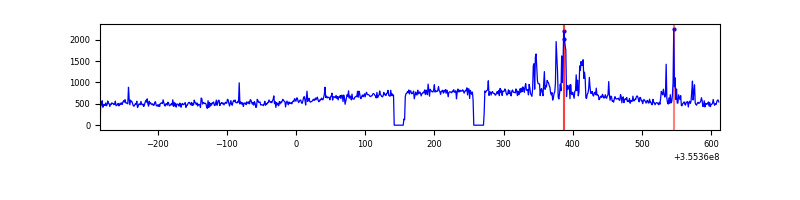 |
| B | 896 | 867 | 0 | 0 | 0.00% | 0.00% | 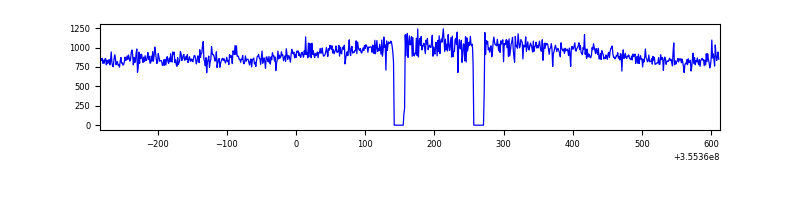 |
| C | 896 | 867 | 0 | 0 | 0.00% | 0.00% | 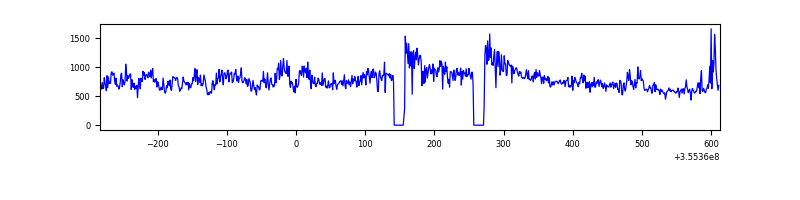 |
| D | 896 | 867 | 1 | 1 | 0.11% | 0.12% | 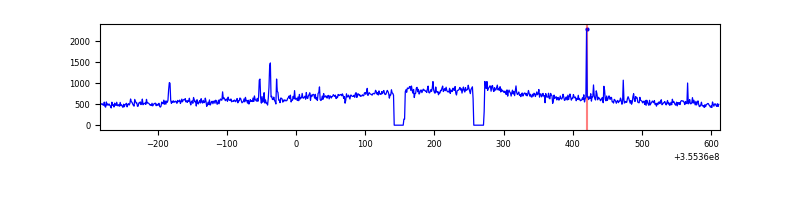 |
Top three noisy pixels from each quadrant. If the there are fewer than three noisy pixels in the level2.evt file, extra rows are filled as -1
| Pixel properties | Quadrant properties | ||||||
|---|---|---|---|---|---|---|---|
| Quadrant | DetID | PixID | Counts | Sigma | Mean | Median | Sigma |
| A | 0 | 13 | 53402 | 1799.83 | 134 | 130 | 29.6 |
| A | 13 | 254 | 1760 | 55.07 | 134 | 130 | 29.6 |
| A | 3 | 137 | 1545 | 47.81 | 134 | 130 | 29.6 |
| B | 6 | 159 | 258761 | 9149.15 | 132 | 128 | 28.3 |
| B | 0 | 190 | 13417 | 470.1 | 132 | 128 | 28.3 |
| B | 12 | 111 | 3533 | 120.45 | 132 | 128 | 28.3 |
| C | 3 | 233 | 142946 | 4472.53 | 127 | 126 | 31.9 |
| C | 14 | 238 | 27609 | 860.65 | 127 | 126 | 31.9 |
| C | 14 | 254 | 11761 | 364.36 | 127 | 126 | 31.9 |
| D | 8 | 195 | 49729 | 1457.43 | 132 | 127 | 34.0 |
| D | 1 | 52 | 5270 | 151.11 | 132 | 127 | 34.0 |
| D | 2 | 234 | 4047 | 115.18 | 132 | 127 | 34.0 |
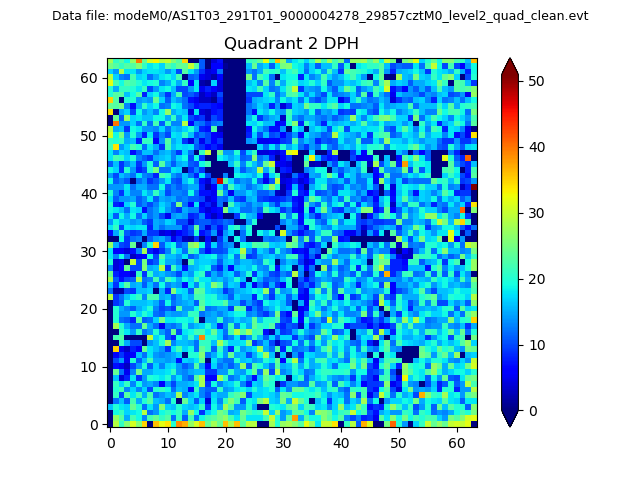
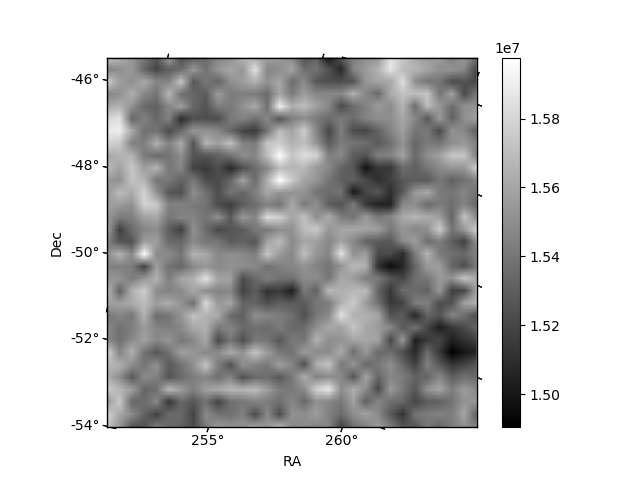
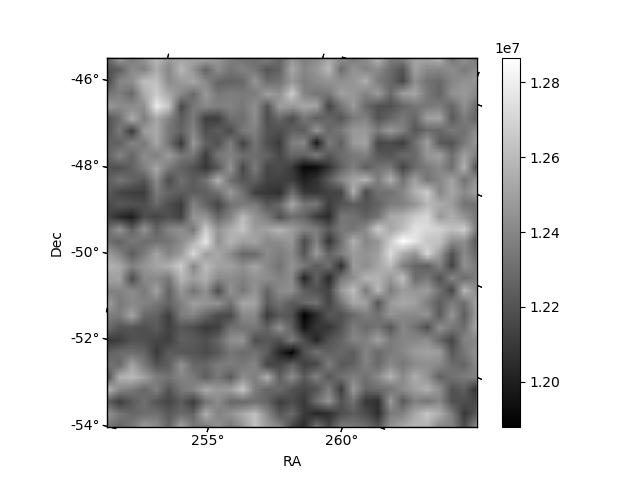
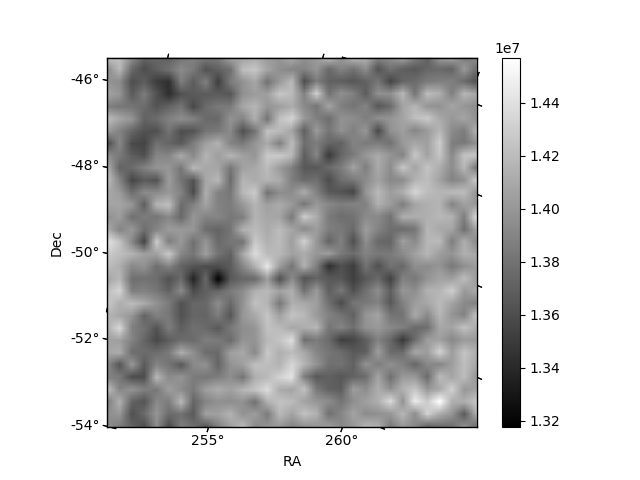
Histogram calculated using DETX and DETY for each event in the final _common_clean file
| Quadrant A | 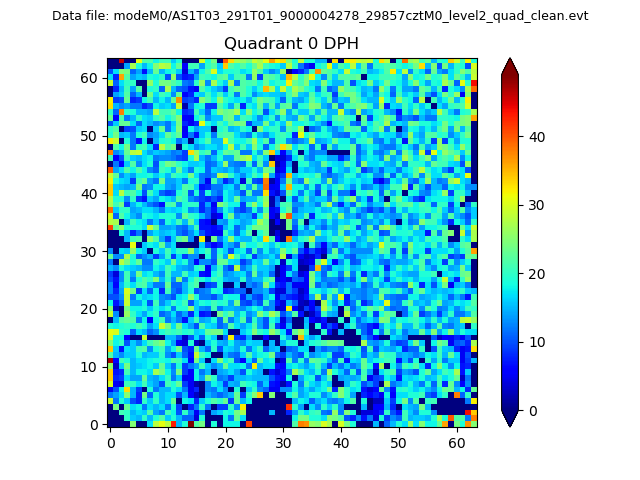 |
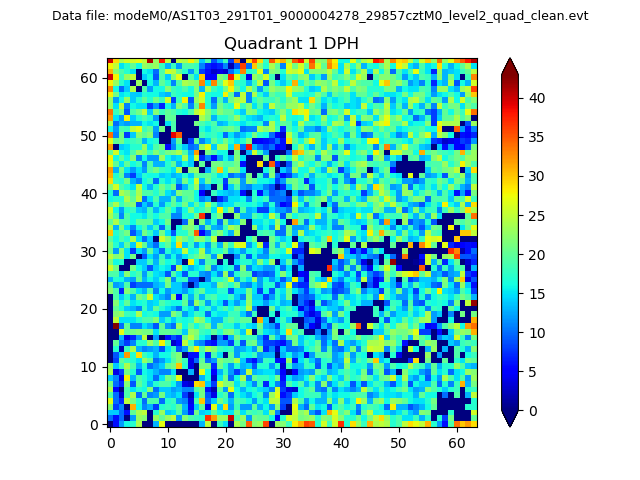 |
Quadrant B |
|---|---|---|---|
| Quadrant D | 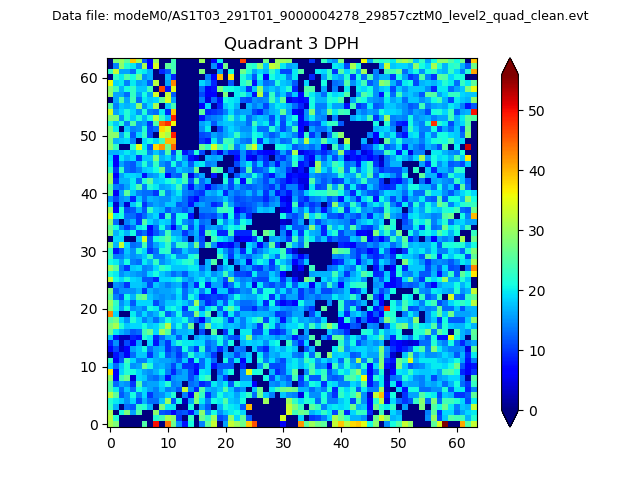 |
 |
Quadrant C |
| Plot type | Count rate plots | Images |
|---|---|---|
| Comparison with Poisson distribution Blue bars denote a histogram of data divided into 1 sec bins. Red curve is a Poisson curve with rate = median count rate of data. |
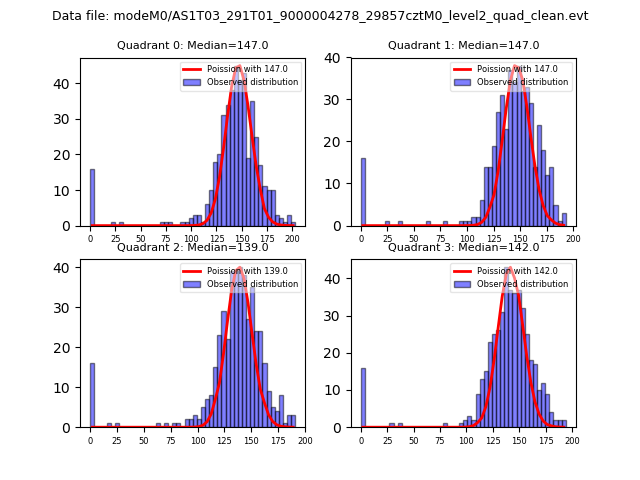 |
 |
| Quadrant-wise count rates Data is divided into 100 sec bins |
 |
|
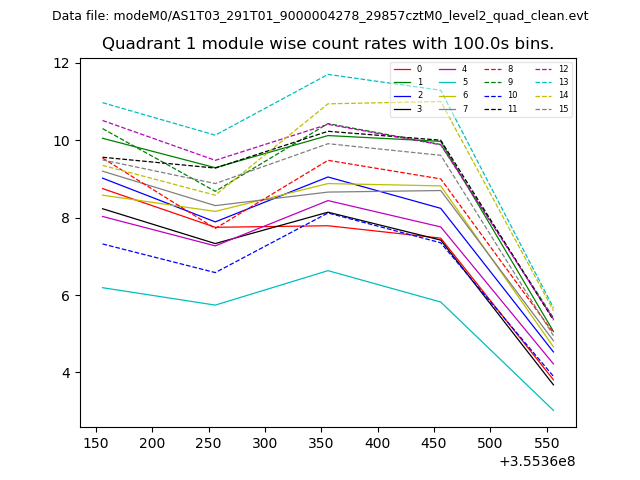
| Module-wise count rates for Quadrant A Data is divided into 100 sec bins |
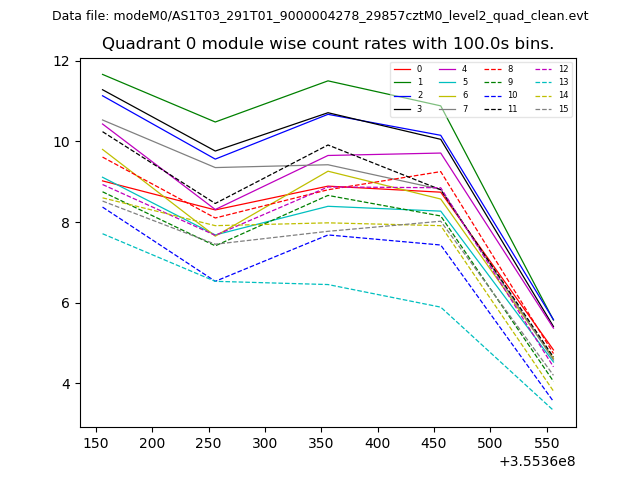 |
 |
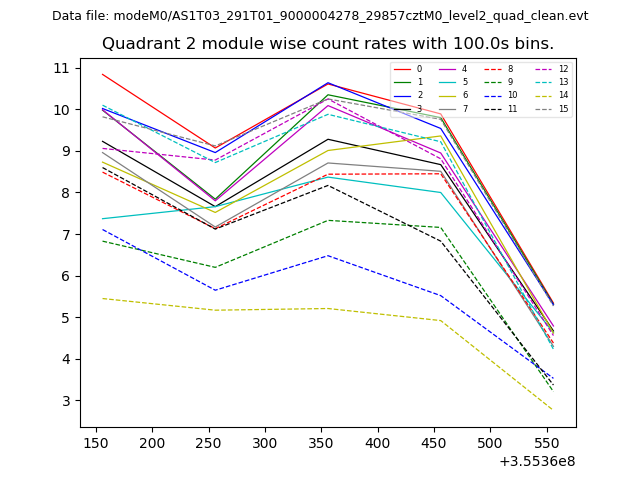
| Module-wise count rates for Quadrant B Data is divided into 100 sec bins |
 |
 |
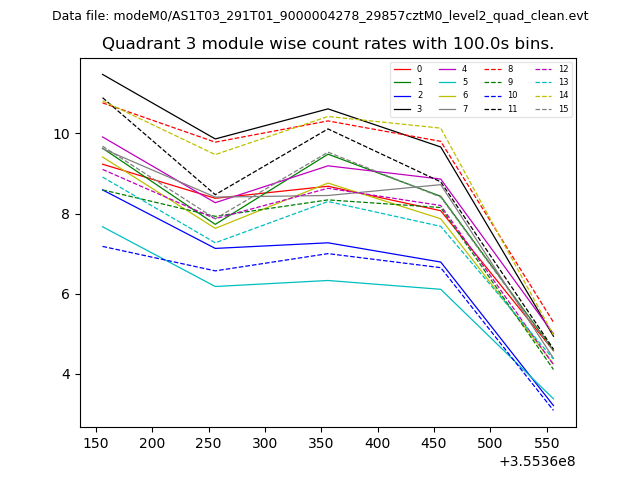
| Module-wise count rates for Quadrant C Data is divided into 100 sec bins |
 |
 |
| Module-wise count rates for Quadrant D Data is divided into 100 sec bins |
 |
 |
| Parameter | Plot |
|---|---|
| CZT HV Monitor |  |
| D_VDD | 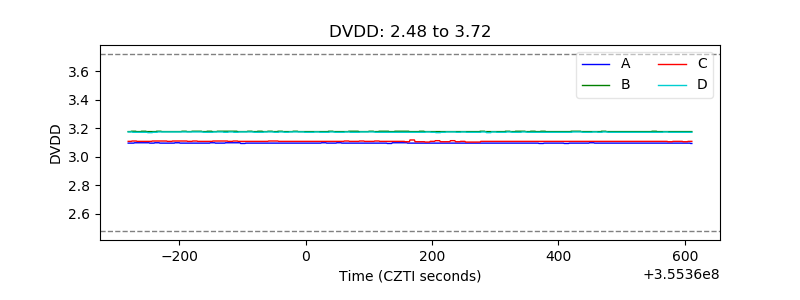 |
| Temperature 1 | 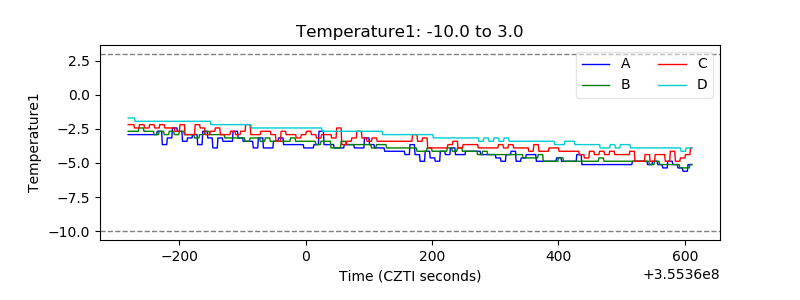 |
| Veto HV Monitor | 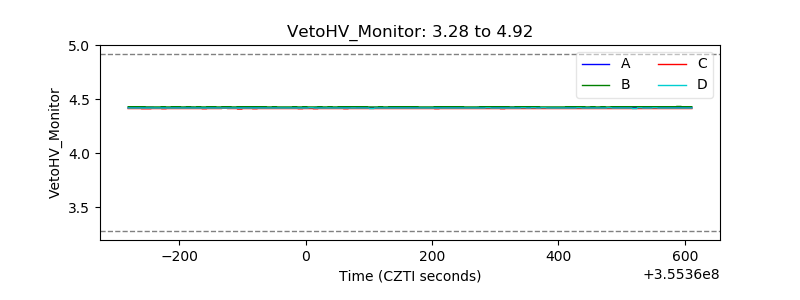 |
| Veto LLD | 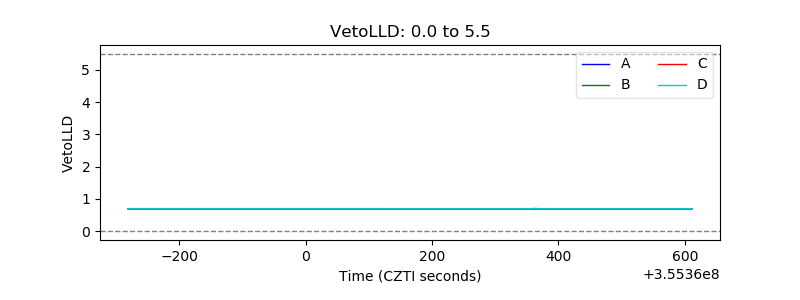 |
| Alpha Counter |  |
| _CPM_Rate |  |
| CZT Counter | 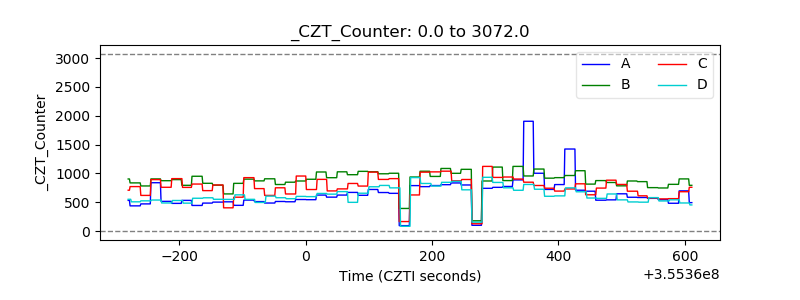 |
| +2.5 Volts monitor |  |
| +5 Volts monitor |  |
| _ROLL_ROT | 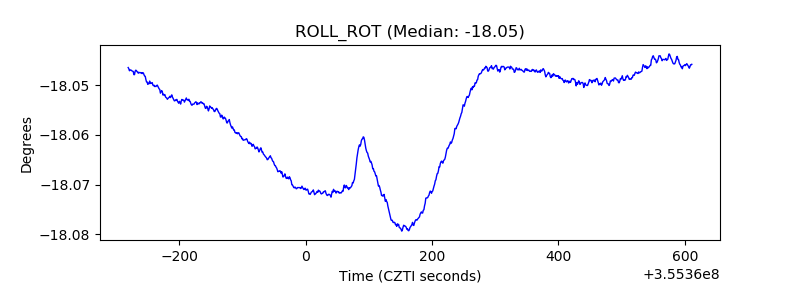 |
| _Roll_DEC | 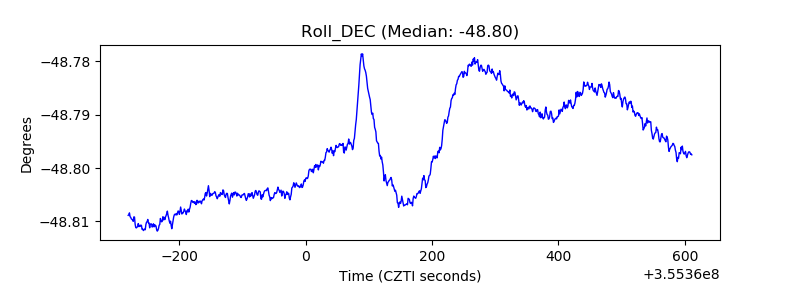 |
| _Roll_RA | 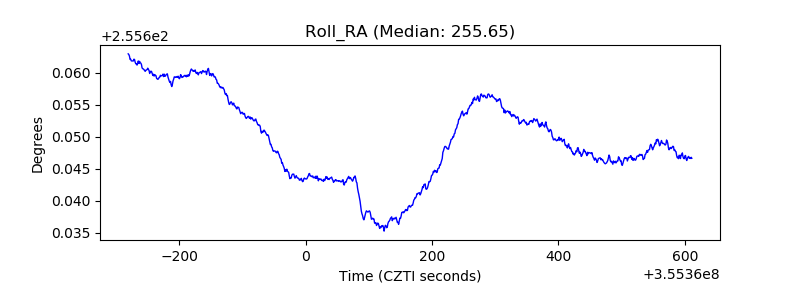 |
| Veto Counter | 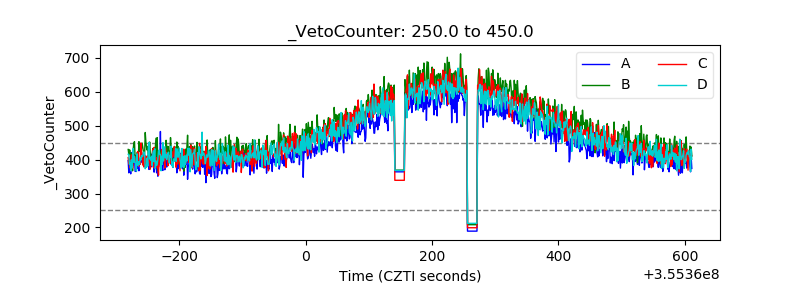 |