| Param | Original file | Final file |
|---|---|---|
| Filename | modeM0/AS1T03_291T01_9000004278_29860cztM0_level2.evt | modeM0/AS1T03_291T01_9000004278_29860cztM0_level2_quad_clean.evt |
| Size (bytes) | 1,057,213,440 | 159,301,440 |
| Size | 1008.2 MB | 151.9 MB |
| Events in quadrant A | 6,212,460 | 1,041,780 |
| Events in quadrant B | 9,597,278 | 1,038,771 |
| Events in quadrant C | 7,614,737 | 978,399 |
| Events in quadrant D | 7,807,987 | 959,266 |
| Mode SS | |||
|---|---|---|---|
| Quadrant | BADHDUFLAG | Total packets | Discarded packets |
| A | 0 | 238 | 0 |
| B | 0 | 238 | 0 |
| C | 0 | 238 | 0 |
| D | 0 | 238 | 0 |
| Mode M0 | |||
|---|---|---|---|
| Quadrant | BADHDUFLAG | Total packets | Discarded packets |
| A | 0 | 25839 | 2 |
| B | 0 | 36183 | 4 |
| C | 0 | 30360 | 2 |
| D | 0 | 30923 | 2 |
| Mode M9 | |||
|---|---|---|---|
| Quadrant | BADHDUFLAG | Total packets | Discarded packets |
| A | 0 | 24 | 0 |
| B | 0 | 24 | 0 |
| C | 0 | 24 | 0 |
| D | 0 | 24 | 0 |
| Quadrant | Total seconds | Saturated seconds | Saturation percentage |
|---|---|---|---|
| A | 11653 | 191 | 1.639063% |
| B | 11653 | 253 | 2.171115% |
| C | 11653 | 319 | 2.737492% |
| D | 11653 | 362 | 3.106496% |
Noise dominated data is calculated using 1-second bins in cleaned event files. If a bin has >2000 counts, and if more than 50% of those come from <1% of pixels, then it is considered to be noise-dominated and hence unusable.
| Quadrant | # 1 sec bins | Bins with >0 counts | Bins with >2000 counts | High rate bins dominated by noise | Noise dominated (total time) | Noise dominated (detector-on time) | Marked lightcurve |
|---|---|---|---|---|---|---|---|
| A | 14008 | 11655 | 21 | 21 | 0.15% | 0.18% | 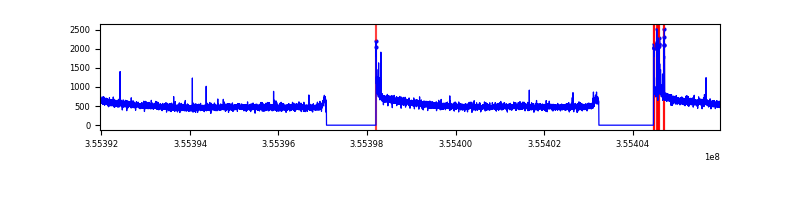 |
| B | 14008 | 11655 | 9 | 9 | 0.06% | 0.08% | 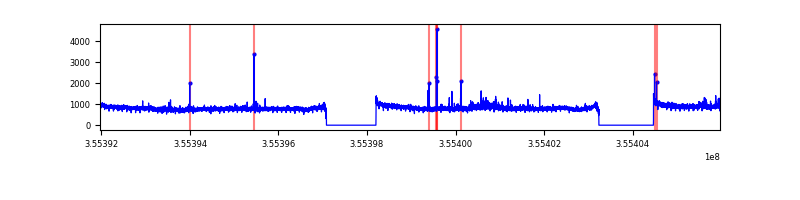 |
| C | 14008 | 11655 | 9 | 9 | 0.06% | 0.08% | 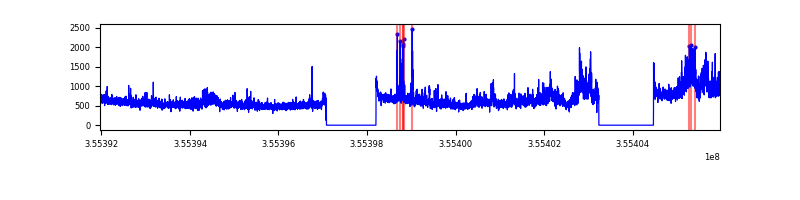 |
| D | 14008 | 11655 | 170 | 170 | 1.21% | 1.46% | 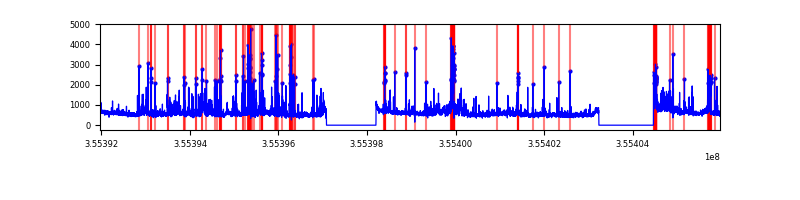 |
Top three noisy pixels from each quadrant. If the there are fewer than three noisy pixels in the level2.evt file, extra rows are filled as -1
| Pixel properties | Quadrant properties | ||||||
|---|---|---|---|---|---|---|---|
| Quadrant | DetID | PixID | Counts | Sigma | Mean | Median | Sigma |
| A | 8 | 255 | 81252 | 259.5 | 1577 | 1552 | 307.1 |
| A | 8 | 192 | 28534 | 87.85 | 1577 | 1552 | 307.1 |
| A | 13 | 254 | 21848 | 66.08 | 1577 | 1552 | 307.1 |
| B | 6 | 159 | 3332118 | 11681.54 | 1544 | 1513 | 285.1 |
| B | 0 | 190 | 165710 | 575.89 | 1544 | 1513 | 285.1 |
| B | 12 | 111 | 34054 | 114.13 | 1544 | 1513 | 285.1 |
| C | 3 | 233 | 1500101 | 4398.42 | 1486 | 1499 | 340.7 |
| C | 14 | 238 | 242681 | 707.87 | 1486 | 1499 | 340.7 |
| C | 10 | 22 | 35396 | 99.49 | 1486 | 1499 | 340.7 |
| D | 7 | 80 | 922566 | 2630.41 | 1508 | 1471 | 350.2 |
| D | 8 | 195 | 428172 | 1218.55 | 1508 | 1471 | 350.2 |
| D | 2 | 250 | 191001 | 541.25 | 1508 | 1471 | 350.2 |
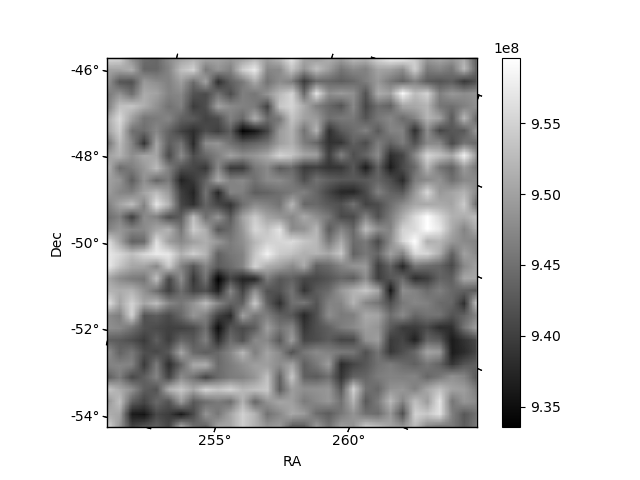
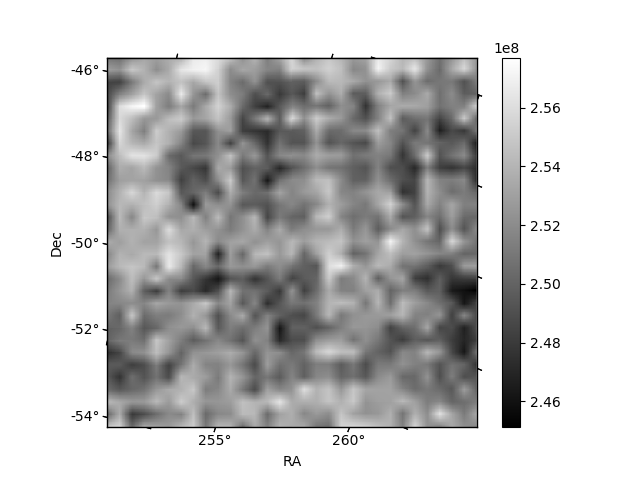
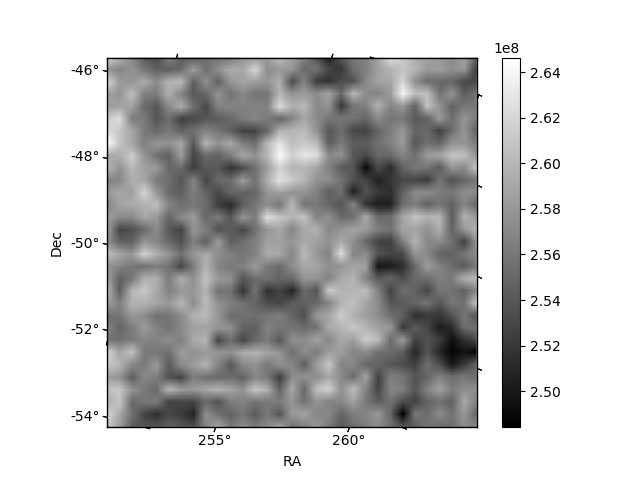
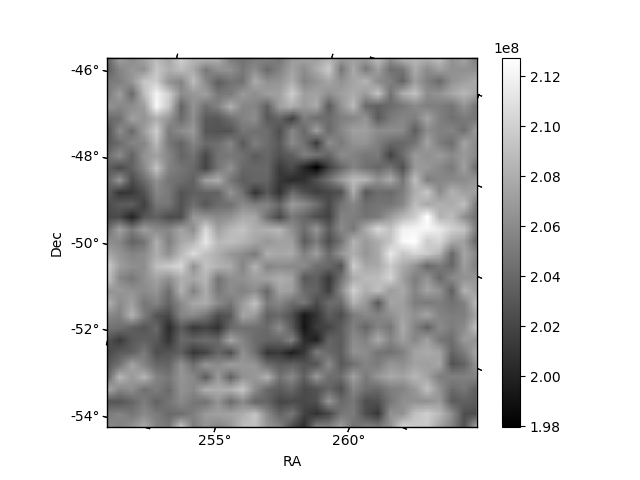
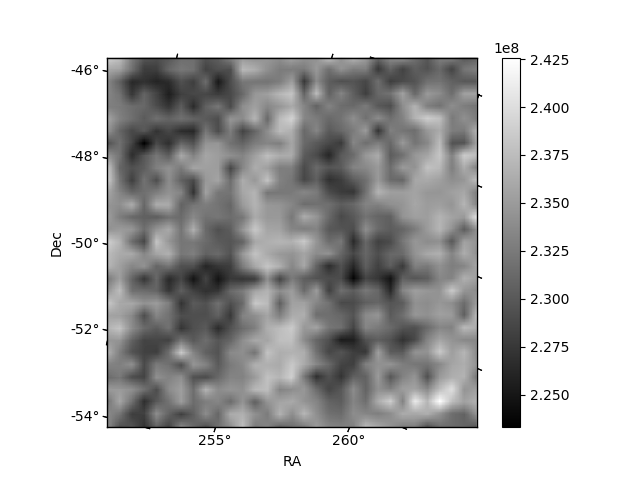
Histogram calculated using DETX and DETY for each event in the final _common_clean file
| Quadrant A | 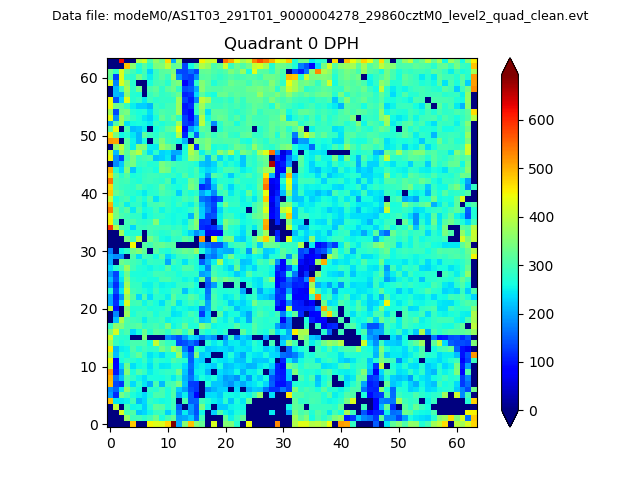 |
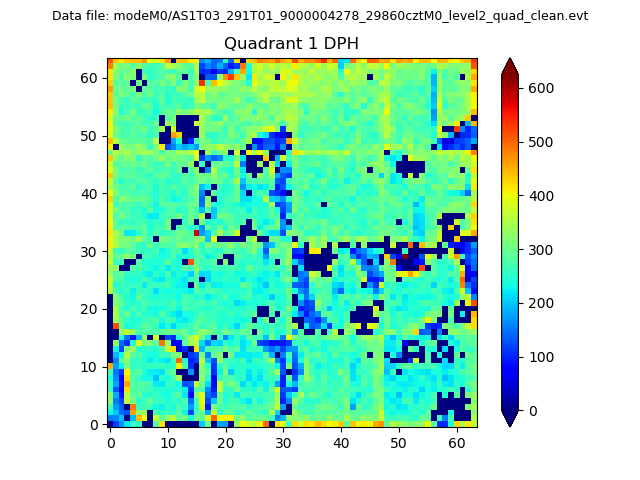 |
Quadrant B |
|---|---|---|---|
| Quadrant D | 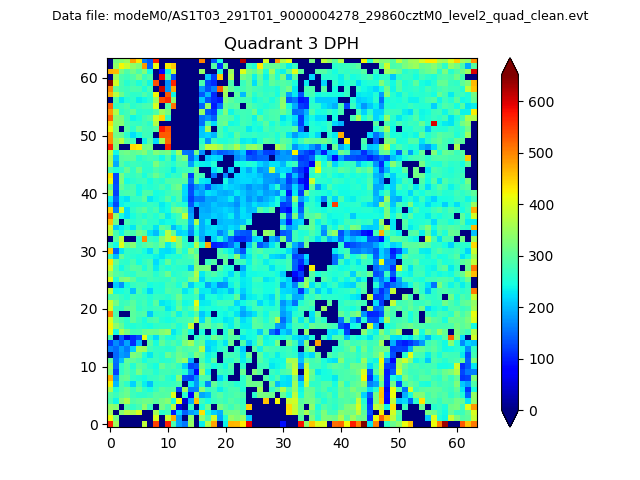 |
 |
Quadrant C |
| Plot type | Count rate plots | Images |
|---|---|---|
| Comparison with Poisson distribution Blue bars denote a histogram of data divided into 1 sec bins. Red curve is a Poisson curve with rate = median count rate of data. |
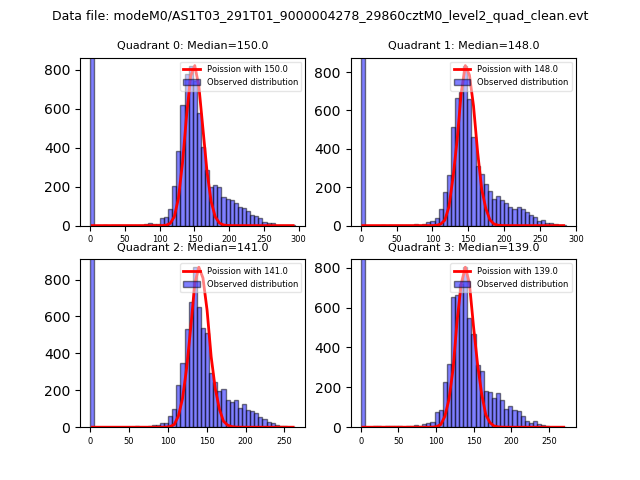 |
 |
| Quadrant-wise count rates Data is divided into 100 sec bins |
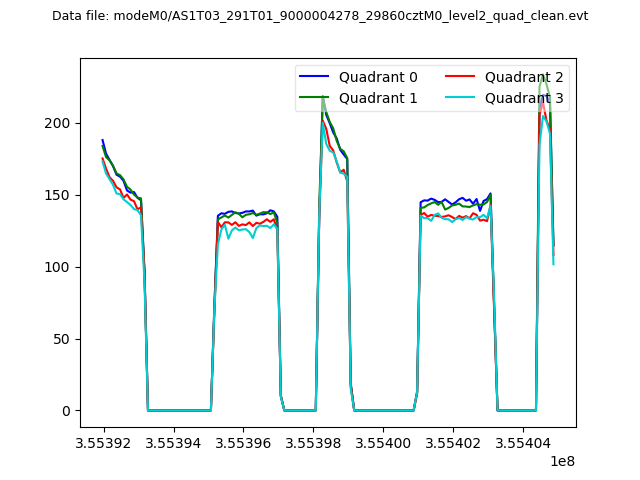 |
|
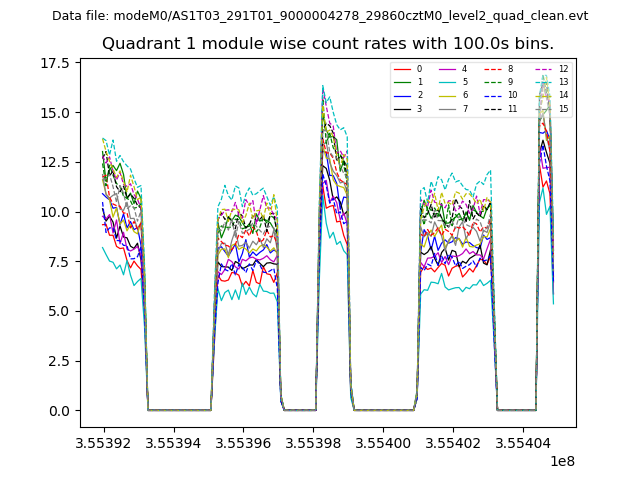
| Module-wise count rates for Quadrant A Data is divided into 100 sec bins |
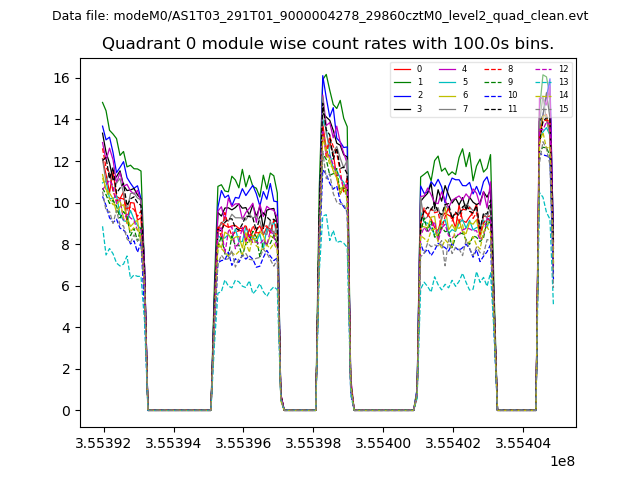 |
 |
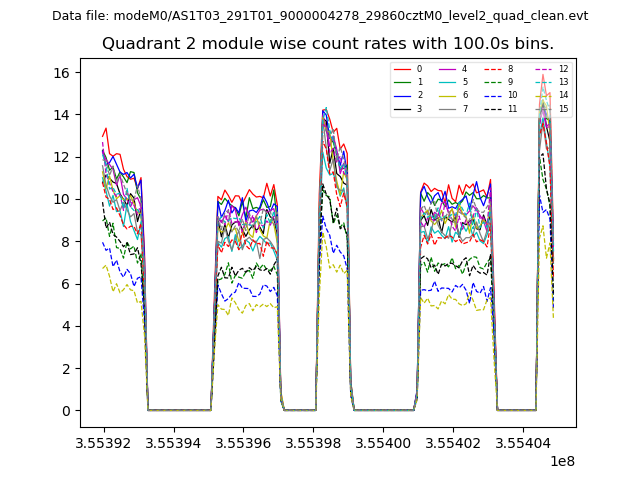
| Module-wise count rates for Quadrant B Data is divided into 100 sec bins |
 |
 |
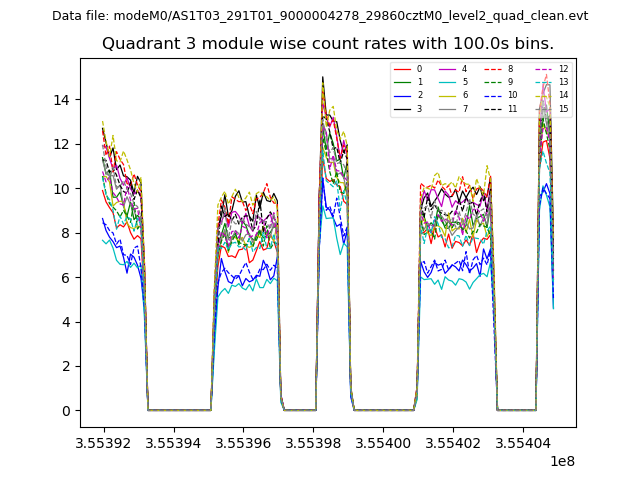
| Module-wise count rates for Quadrant C Data is divided into 100 sec bins |
 |
 |
| Module-wise count rates for Quadrant D Data is divided into 100 sec bins |
 |
 |
| Parameter | Plot |
|---|---|
| CZT HV Monitor | 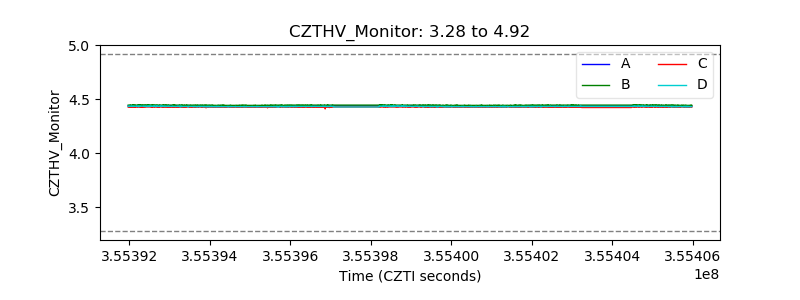 |
| D_VDD | 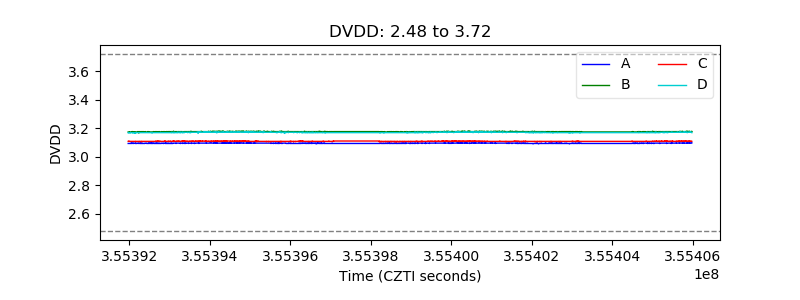 |
| Temperature 1 | 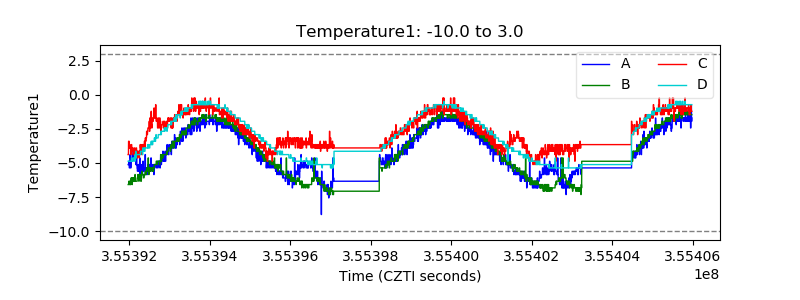 |
| Veto HV Monitor | 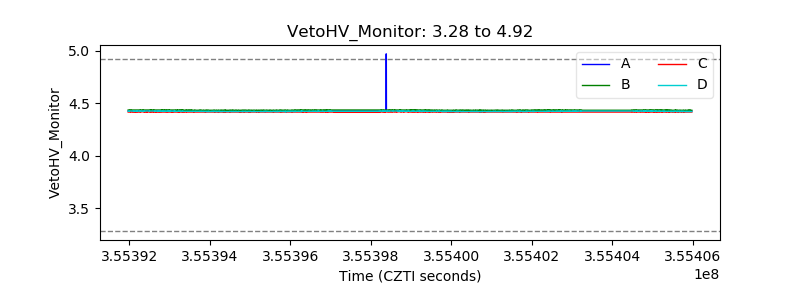 |
| Veto LLD | 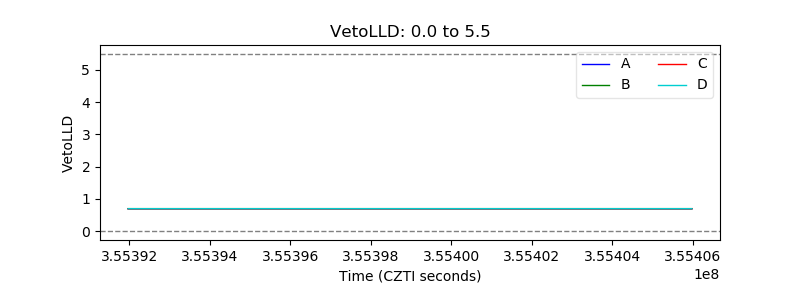 |
| Alpha Counter | 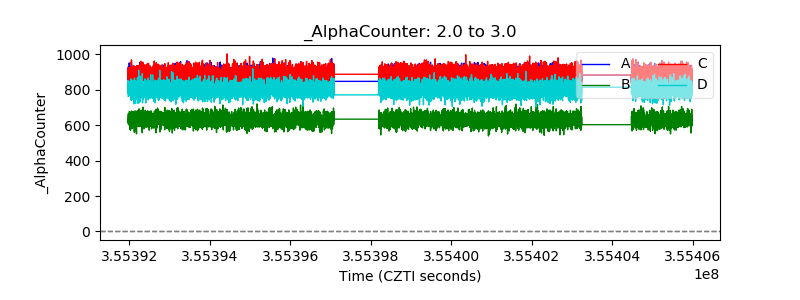 |
| _CPM_Rate | 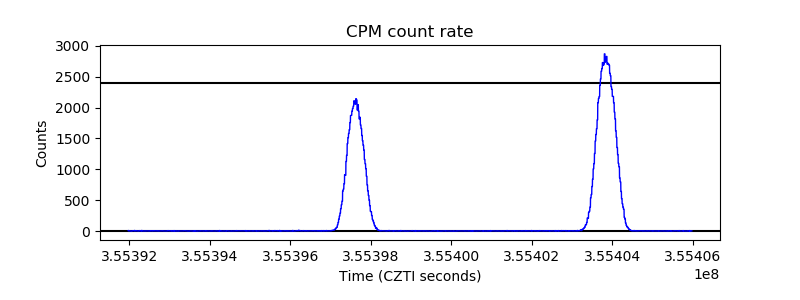 |
| CZT Counter | 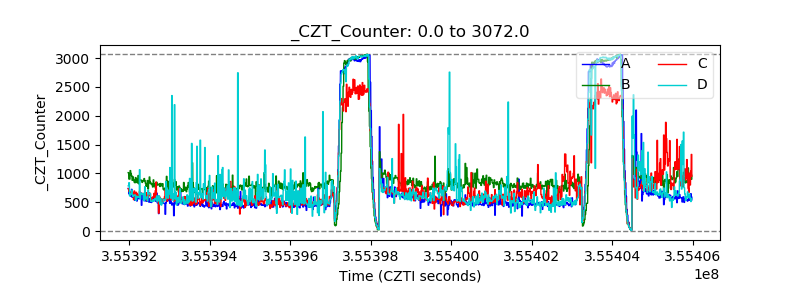 |
| +2.5 Volts monitor |  |
| +5 Volts monitor |  |
| _ROLL_ROT | 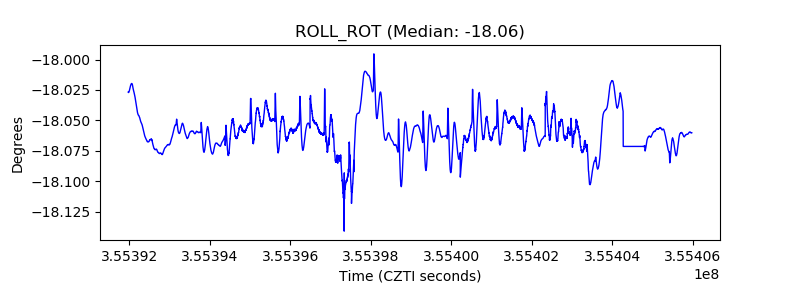 |
| _Roll_DEC | 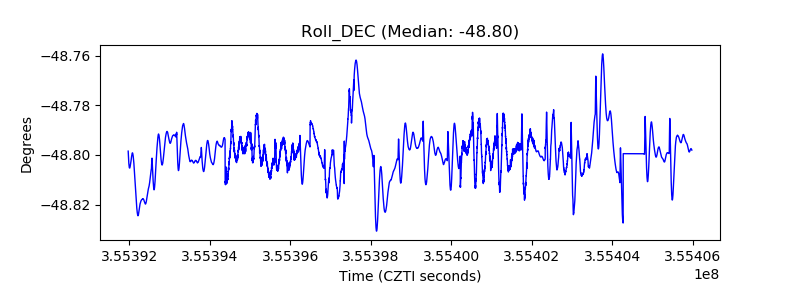 |
| _Roll_RA | 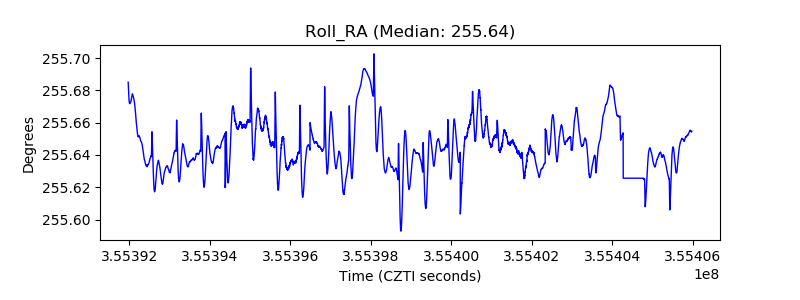 |
| Veto Counter |  |