| Param | Original file | Final file |
|---|---|---|
| Filename | modeM0/AS1T03_291T01_9000004278_29862cztM0_level2.evt | modeM0/AS1T03_291T01_9000004278_29862cztM0_level2_quad_clean.evt |
| Size (bytes) | 615,355,200 | 73,670,400 |
| Size | 586.8 MB | 70.3 MB |
| Events in quadrant A | 3,703,022 | 466,585 |
| Events in quadrant B | 5,711,806 | 463,441 |
| Events in quadrant C | 4,712,743 | 426,436 |
| Events in quadrant D | 4,076,377 | 427,712 |
| Mode SS | |||
|---|---|---|---|
| Quadrant | BADHDUFLAG | Total packets | Discarded packets |
| A | 0 | 130 | 0 |
| B | 0 | 130 | 0 |
| C | 0 | 130 | 0 |
| D | 0 | 130 | 0 |
| Mode M0 | |||
|---|---|---|---|
| Quadrant | BADHDUFLAG | Total packets | Discarded packets |
| A | 0 | 15119 | 2 |
| B | 0 | 21023 | 2 |
| C | 0 | 18810 | 2 |
| D | 0 | 16357 | 2 |
| Mode M9 | |||
|---|---|---|---|
| Quadrant | BADHDUFLAG | Total packets | Discarded packets |
| A | 0 | 16 | 0 |
| B | 0 | 17 | 0 |
| C | 0 | 17 | 0 |
| D | 0 | 17 | 0 |
| Quadrant | Total seconds | Saturated seconds | Saturation percentage |
|---|---|---|---|
| A | 6399 | 104 | 1.625254% |
| B | 6399 | 192 | 3.000469% |
| C | 6399 | 218 | 3.406782% |
| D | 6399 | 100 | 1.562744% |
Noise dominated data is calculated using 1-second bins in cleaned event files. If a bin has >2000 counts, and if more than 50% of those come from <1% of pixels, then it is considered to be noise-dominated and hence unusable.
| Quadrant | # 1 sec bins | Bins with >0 counts | Bins with >2000 counts | High rate bins dominated by noise | Noise dominated (total time) | Noise dominated (detector-on time) | Marked lightcurve |
|---|---|---|---|---|---|---|---|
| A | 7764 | 6400 | 6 | 6 | 0.08% | 0.09% | 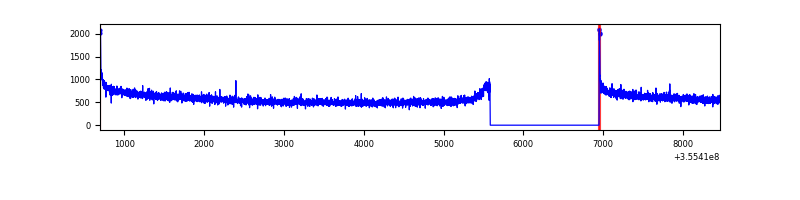 |
| B | 7764 | 6400 | 4 | 4 | 0.05% | 0.06% | 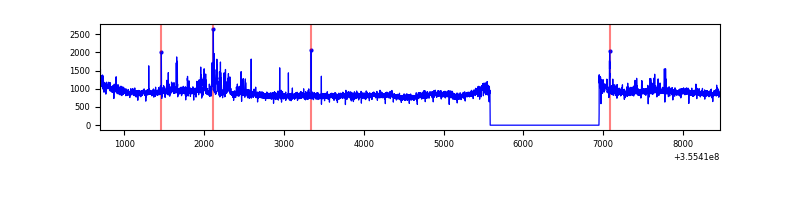 |
| C | 7764 | 6400 | 10 | 10 | 0.13% | 0.16% | 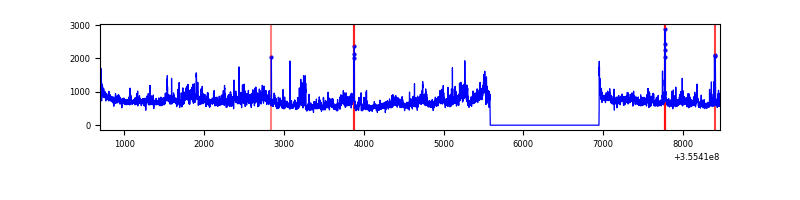 |
| D | 7764 | 6400 | 30 | 30 | 0.39% | 0.47% | 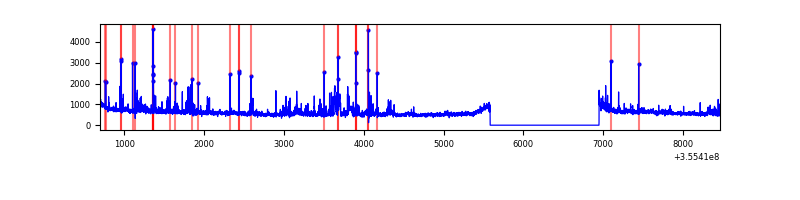 |
Top three noisy pixels from each quadrant. If the there are fewer than three noisy pixels in the level2.evt file, extra rows are filled as -1
| Pixel properties | Quadrant properties | ||||||
|---|---|---|---|---|---|---|---|
| Quadrant | DetID | PixID | Counts | Sigma | Mean | Median | Sigma |
| A | 8 | 192 | 26661 | 138.97 | 952 | 939 | 185.1 |
| A | 13 | 254 | 12801 | 64.09 | 952 | 939 | 185.1 |
| A | 0 | 226 | 8413 | 40.38 | 952 | 939 | 185.1 |
| B | 6 | 159 | 1851843 | 10860.68 | 934 | 915 | 170.4 |
| B | 0 | 190 | 188620 | 1101.4 | 934 | 915 | 170.4 |
| B | 12 | 111 | 19374 | 108.31 | 934 | 915 | 170.4 |
| C | 3 | 233 | 1101639 | 5543.53 | 877 | 886 | 198.6 |
| C | 14 | 238 | 149058 | 746.21 | 877 | 886 | 198.6 |
| C | 10 | 22 | 27246 | 132.75 | 877 | 886 | 198.6 |
| D | 8 | 195 | 193718 | 930.77 | 895 | 874 | 207.2 |
| D | 7 | 80 | 186085 | 893.93 | 895 | 874 | 207.2 |
| D | 13 | 153 | 157601 | 756.45 | 895 | 874 | 207.2 |
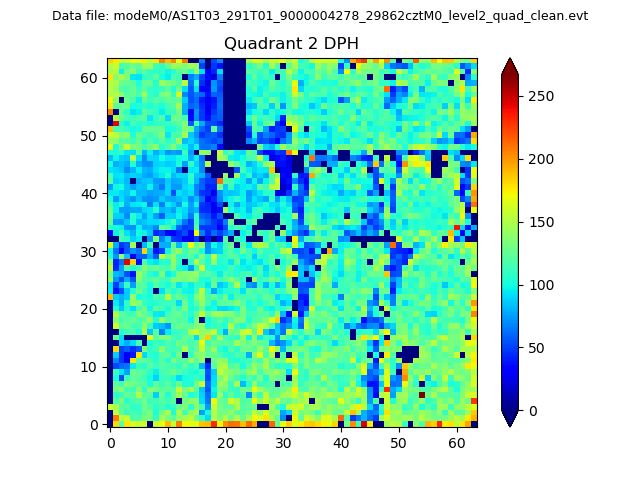
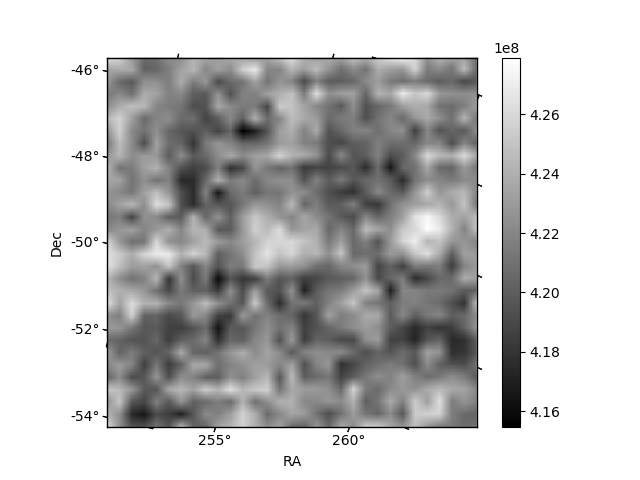
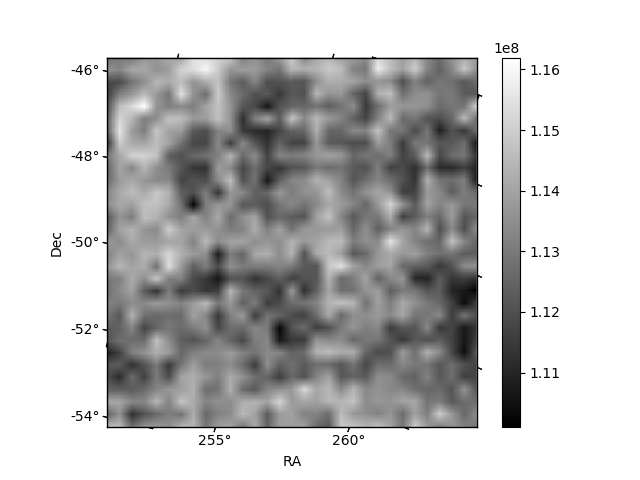
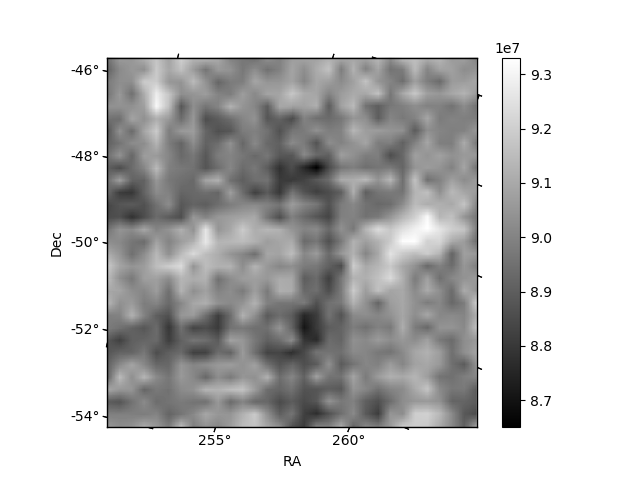
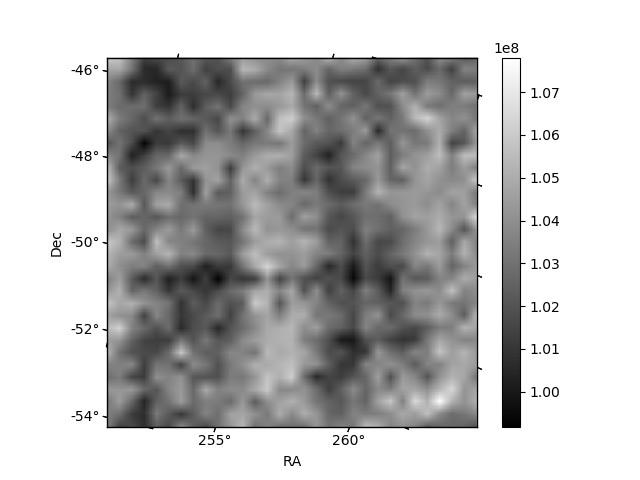
Histogram calculated using DETX and DETY for each event in the final _common_clean file
| Quadrant A | 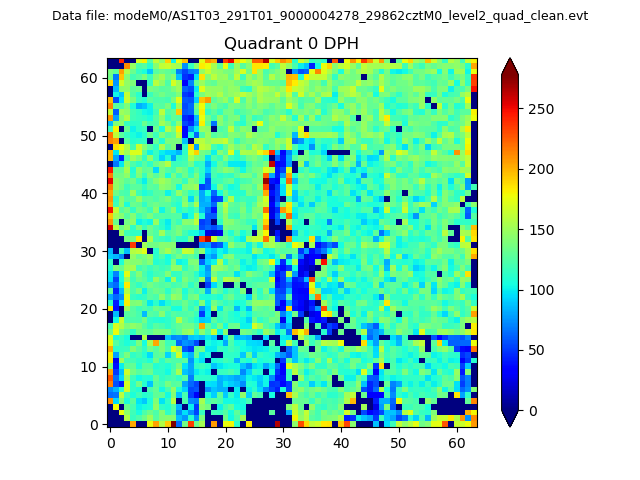 |
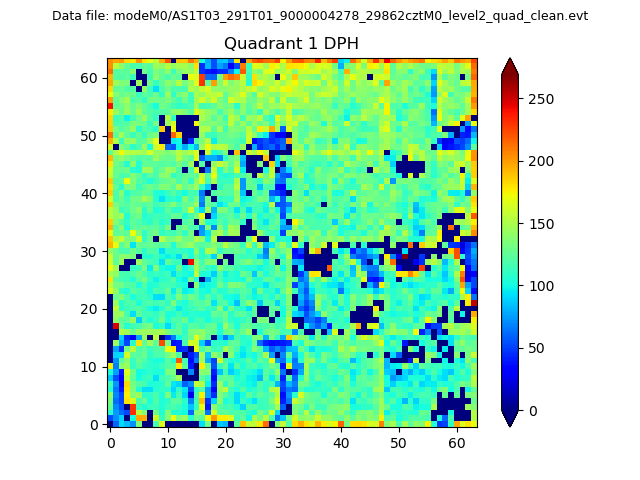 |
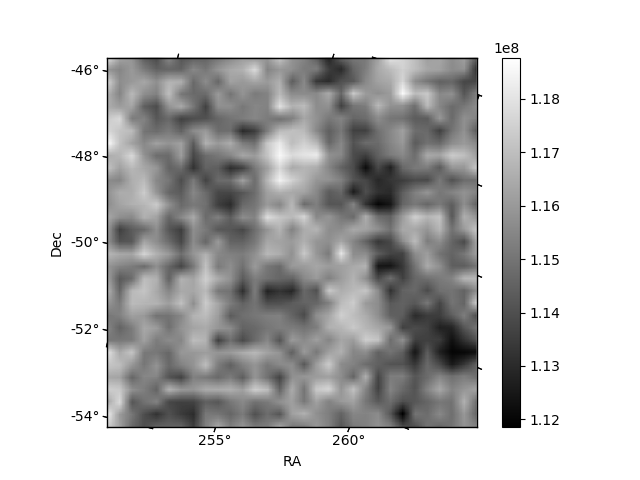
Quadrant B |
|---|---|---|---|
| Quadrant D | 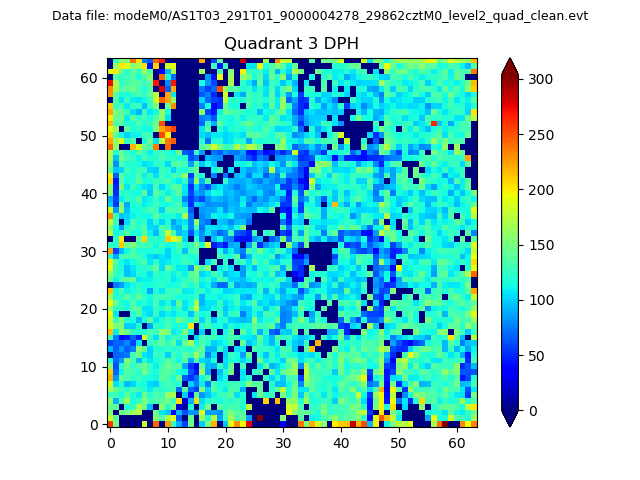 |
 |
Quadrant C |
| Plot type | Count rate plots | Images |
|---|---|---|
| Comparison with Poisson distribution Blue bars denote a histogram of data divided into 1 sec bins. Red curve is a Poisson curve with rate = median count rate of data. |
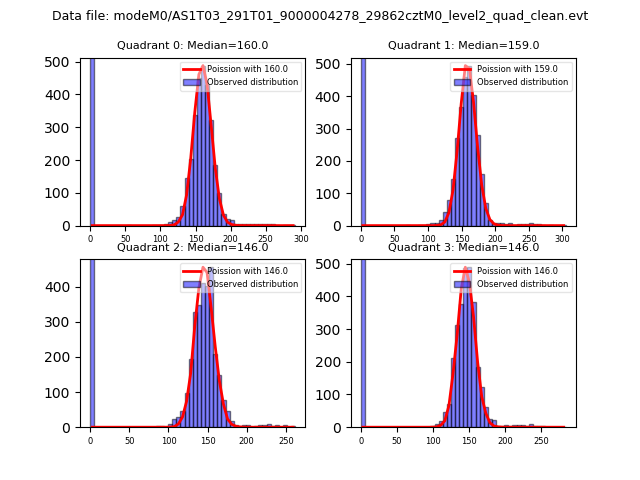 |
 |
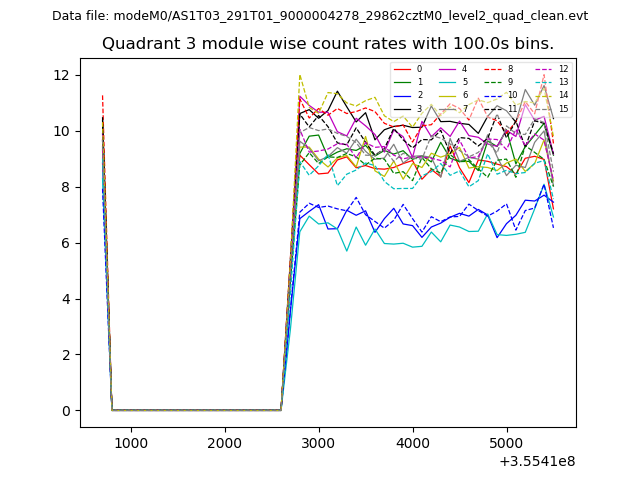
| Quadrant-wise count rates Data is divided into 100 sec bins |
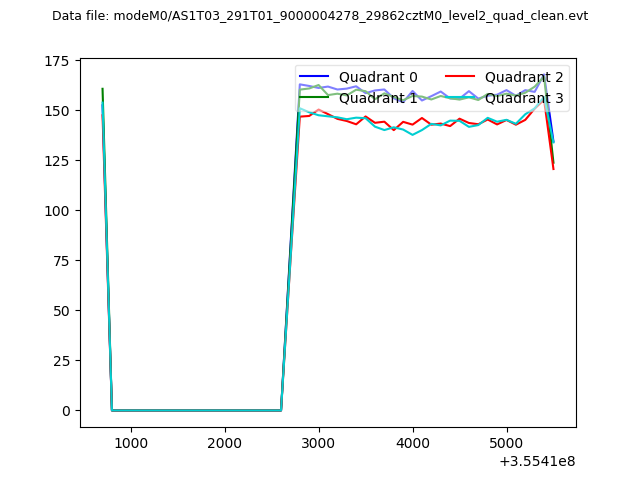 |
|
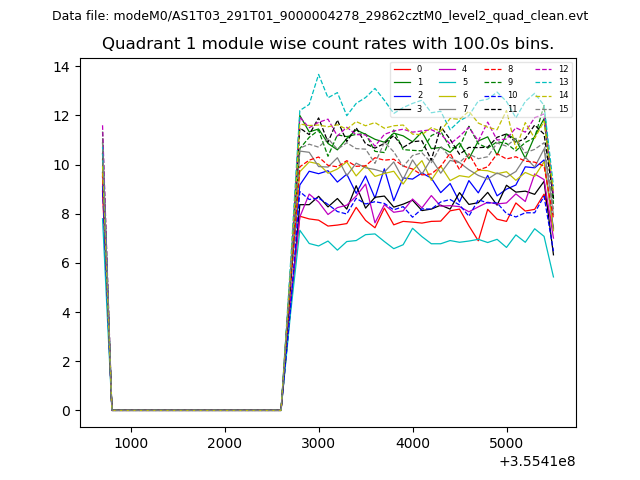
| Module-wise count rates for Quadrant A Data is divided into 100 sec bins |
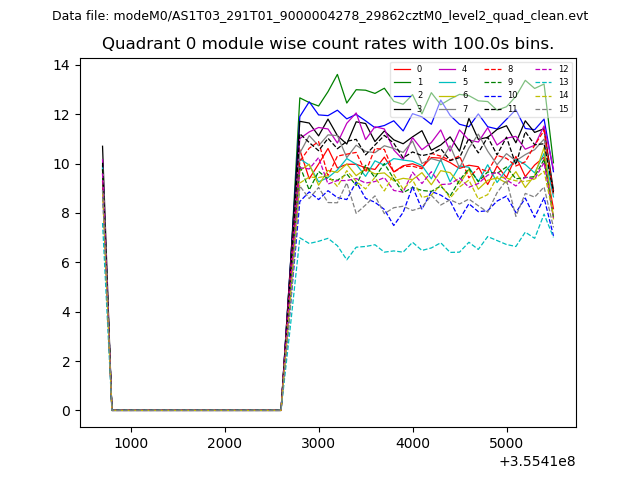 |
 |
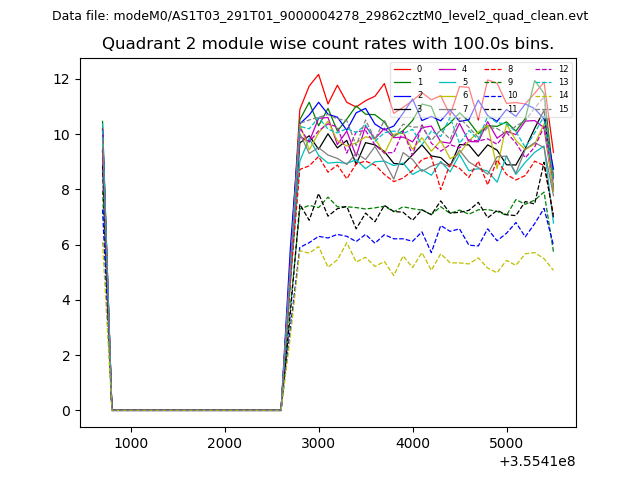
| Module-wise count rates for Quadrant B Data is divided into 100 sec bins |
 |
 |
| Module-wise count rates for Quadrant C Data is divided into 100 sec bins |
 |
 |
| Module-wise count rates for Quadrant D Data is divided into 100 sec bins |
 |
 |
| Parameter | Plot |
|---|---|
| CZT HV Monitor | 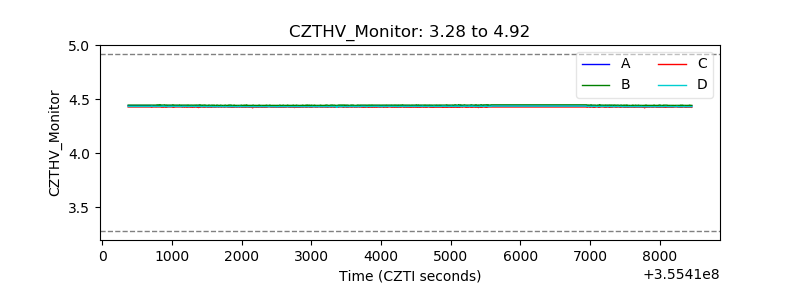 |
| D_VDD | 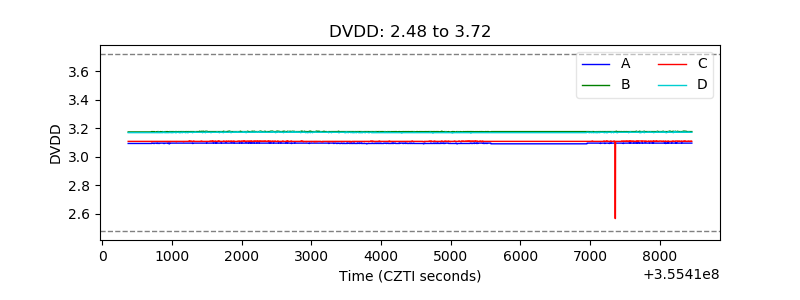 |
| Temperature 1 | 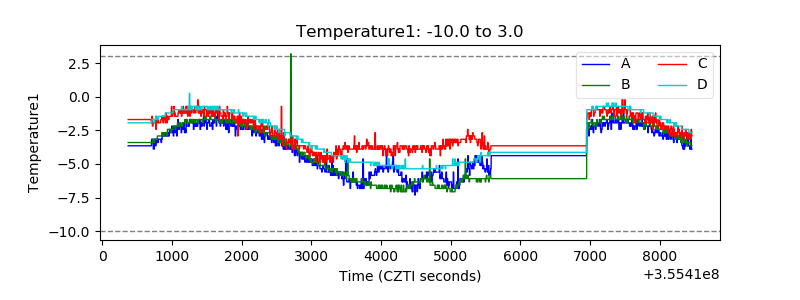 |
| Veto HV Monitor | 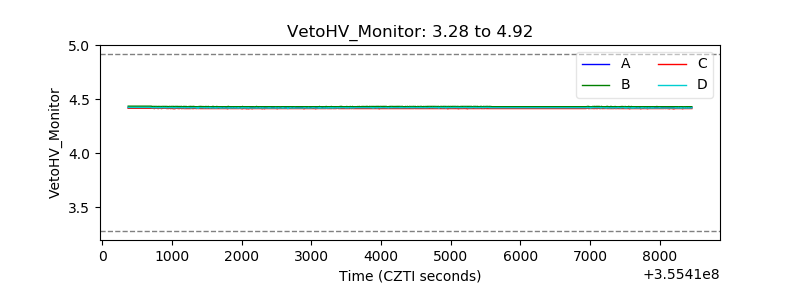 |
| Veto LLD | 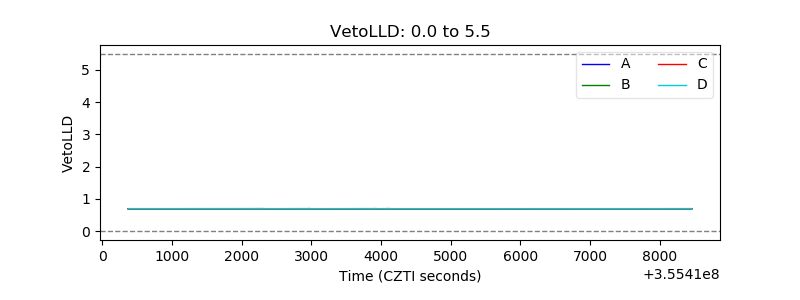 |
| Alpha Counter | 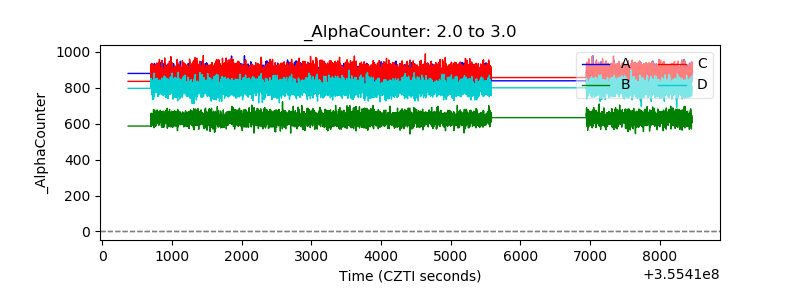 |
| _CPM_Rate |  |
| CZT Counter | 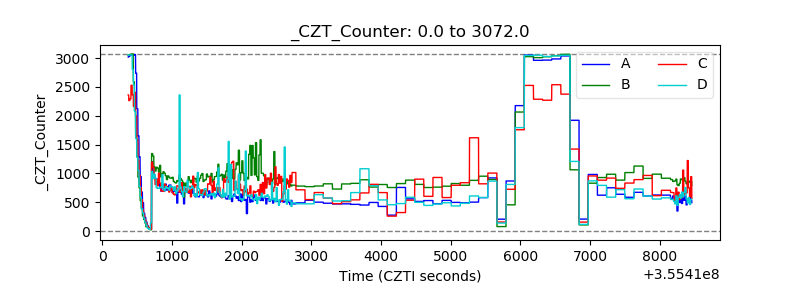 |
| +2.5 Volts monitor |  |
| +5 Volts monitor |  |
| _ROLL_ROT | 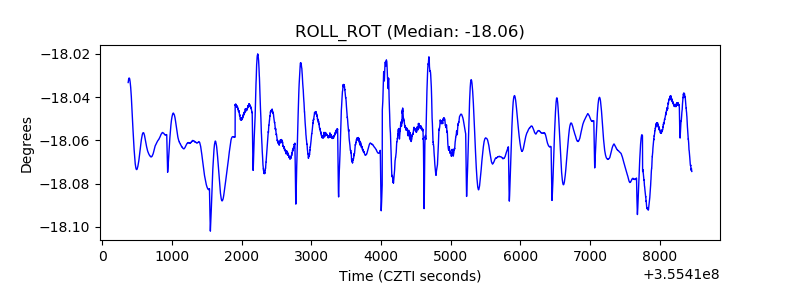 |
| _Roll_DEC | 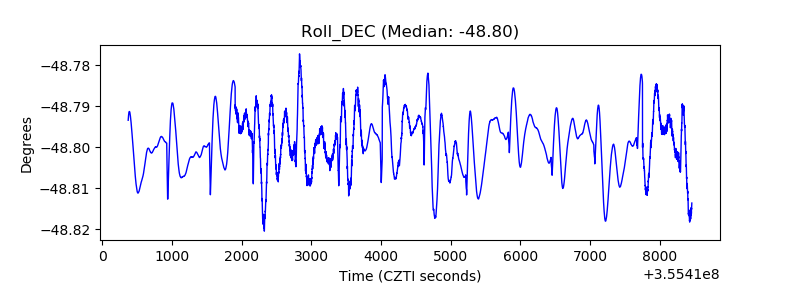 |
| _Roll_RA | 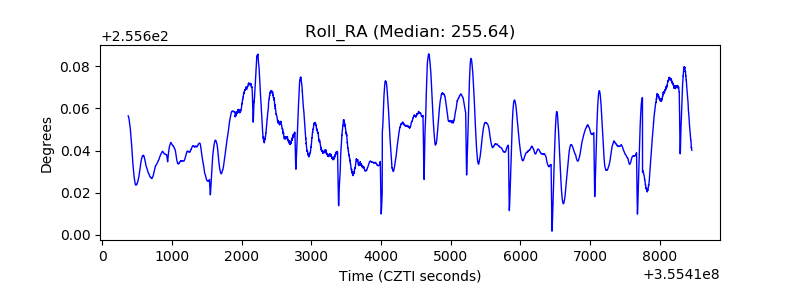 |
| Veto Counter | 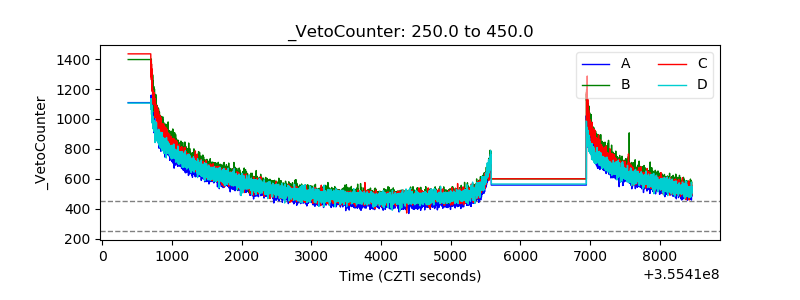 |