| Param | Original file | Final file |
|---|---|---|
| Filename | modeM0/AS1T03_291T01_9000004278_29863cztM0_level2.evt | modeM0/AS1T03_291T01_9000004278_29863cztM0_level2_quad_clean.evt |
| Size (bytes) | 564,050,880 | 81,285,120 |
| Size | 537.9 MB | 77.5 MB |
| Events in quadrant A | 3,425,037 | 531,546 |
| Events in quadrant B | 5,370,787 | 525,118 |
| Events in quadrant C | 4,301,157 | 486,566 |
| Events in quadrant D | 3,564,369 | 484,056 |
| Mode SS | |||
|---|---|---|---|
| Quadrant | BADHDUFLAG | Total packets | Discarded packets |
| A | 0 | 126 | 0 |
| B | 0 | 126 | 0 |
| C | 0 | 126 | 0 |
| D | 0 | 126 | 0 |
| Mode M0 | |||
|---|---|---|---|
| Quadrant | BADHDUFLAG | Total packets | Discarded packets |
| A | 0 | 14000 | 1 |
| B | 0 | 19879 | 1 |
| C | 0 | 17508 | 2 |
| D | 0 | 14654 | 1 |
| Mode M9 | |||
|---|---|---|---|
| Quadrant | BADHDUFLAG | Total packets | Discarded packets |
| A | 0 | 13 | 0 |
| B | 0 | 13 | 0 |
| C | 0 | 13 | 0 |
| D | 0 | 13 | 0 |
| Quadrant | Total seconds | Saturated seconds | Saturation percentage |
|---|---|---|---|
| A | 6223 | 133 | 2.137233% |
| B | 6223 | 212 | 3.406717% |
| C | 6222 | 196 | 3.150113% |
| D | 6222 | 128 | 2.057216% |
Noise dominated data is calculated using 1-second bins in cleaned event files. If a bin has >2000 counts, and if more than 50% of those come from <1% of pixels, then it is considered to be noise-dominated and hence unusable.
| Quadrant | # 1 sec bins | Bins with >0 counts | Bins with >2000 counts | High rate bins dominated by noise | Noise dominated (total time) | Noise dominated (detector-on time) | Marked lightcurve |
|---|---|---|---|---|---|---|---|
| A | 7498 | 6224 | 3 | 3 | 0.04% | 0.05% | 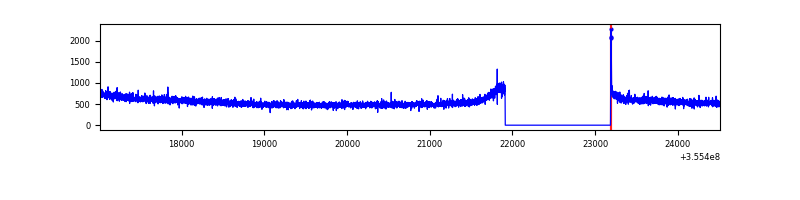 |
| B | 7498 | 6224 | 2 | 2 | 0.03% | 0.03% | 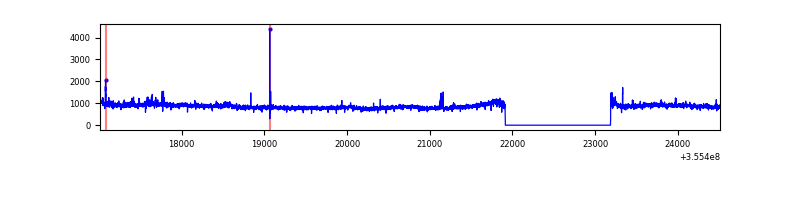 |
| C | 7497 | 6223 | 9 | 9 | 0.12% | 0.14% | 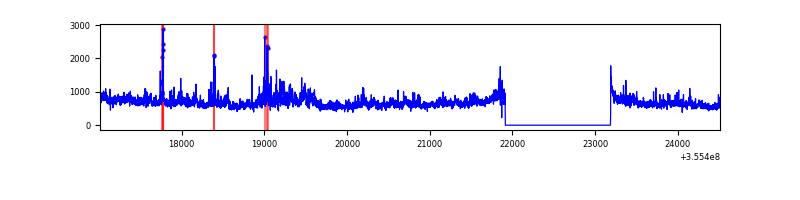 |
| D | 7497 | 6223 | 36 | 36 | 0.48% | 0.58% | 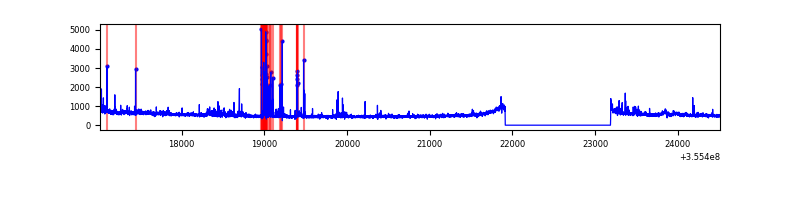 |
Top three noisy pixels from each quadrant. If the there are fewer than three noisy pixels in the level2.evt file, extra rows are filled as -1
| Pixel properties | Quadrant properties | ||||||
|---|---|---|---|---|---|---|---|
| Quadrant | DetID | PixID | Counts | Sigma | Mean | Median | Sigma |
| A | 8 | 192 | 14789 | 80.2 | 883 | 870 | 173.6 |
| A | 13 | 254 | 12517 | 67.1 | 883 | 870 | 173.6 |
| A | 3 | 137 | 7951 | 40.8 | 883 | 870 | 173.6 |
| B | 6 | 159 | 1855870 | 11553.5 | 868 | 851 | 160.6 |
| B | 0 | 190 | 98944 | 610.95 | 868 | 851 | 160.6 |
| B | 12 | 111 | 18375 | 109.14 | 868 | 851 | 160.6 |
| C | 3 | 233 | 925766 | 4939.5 | 819 | 826 | 187.3 |
| C | 14 | 238 | 136346 | 723.72 | 819 | 826 | 187.3 |
| C | 10 | 22 | 30356 | 157.7 | 819 | 826 | 187.3 |
| D | 13 | 104 | 154590 | 796.62 | 830 | 809 | 193.0 |
| D | 8 | 195 | 111518 | 573.49 | 830 | 809 | 193.0 |
| D | 7 | 80 | 63590 | 325.22 | 830 | 809 | 193.0 |
Histogram calculated using DETX and DETY for each event in the final _common_clean file
| Quadrant A | 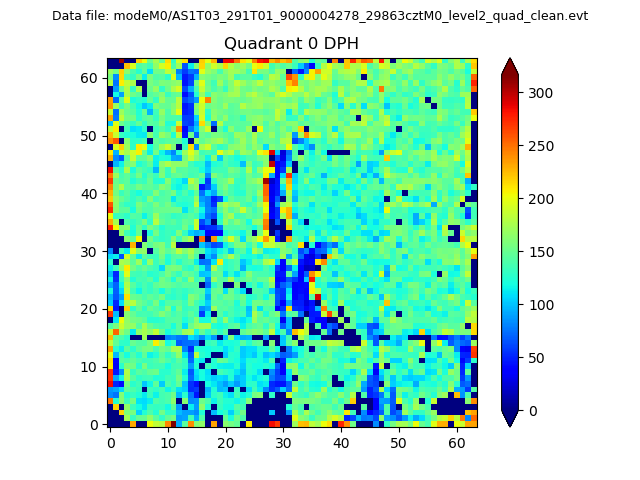 |
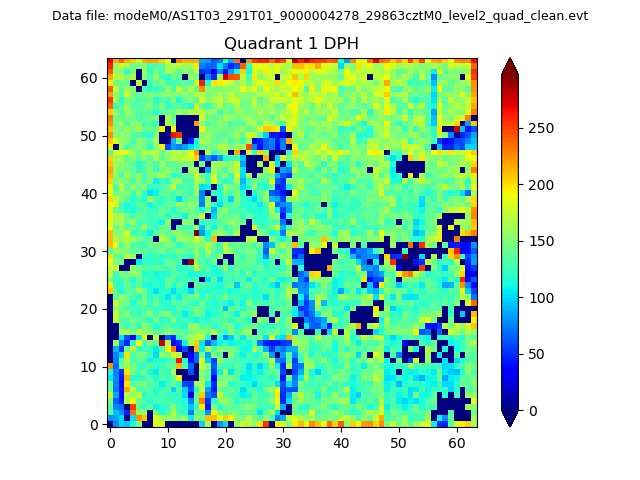 |
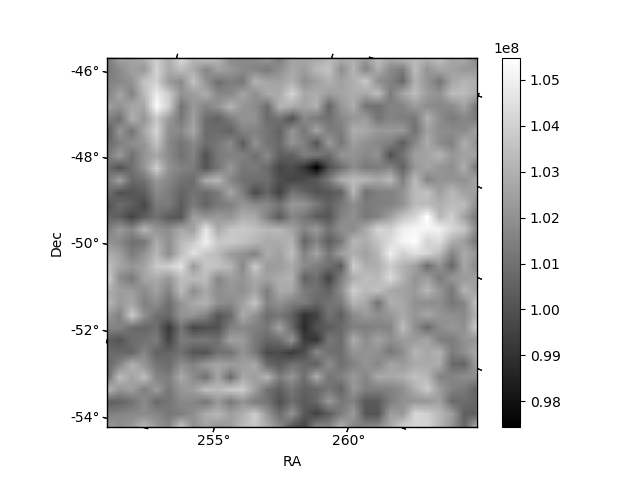
Quadrant B |
|---|---|---|---|
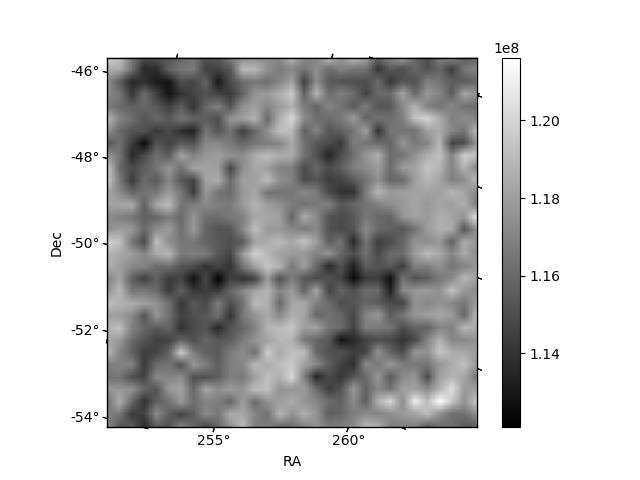
| Quadrant D | 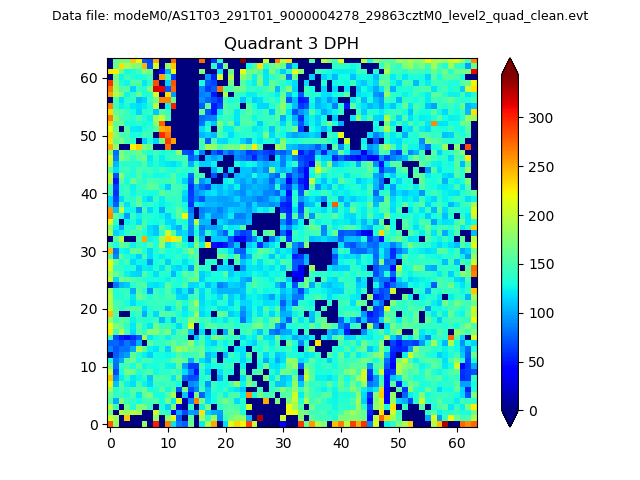 |
 |
Quadrant C |
| Plot type | Count rate plots | Images |
|---|---|---|
| Comparison with Poisson distribution Blue bars denote a histogram of data divided into 1 sec bins. Red curve is a Poisson curve with rate = median count rate of data. |
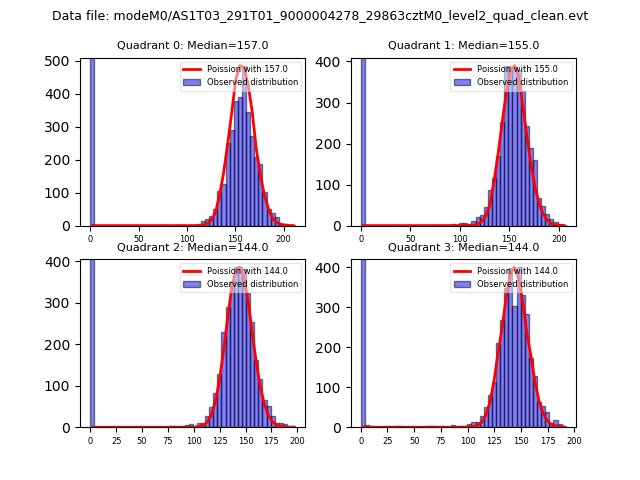 |
 |
| Quadrant-wise count rates Data is divided into 100 sec bins |
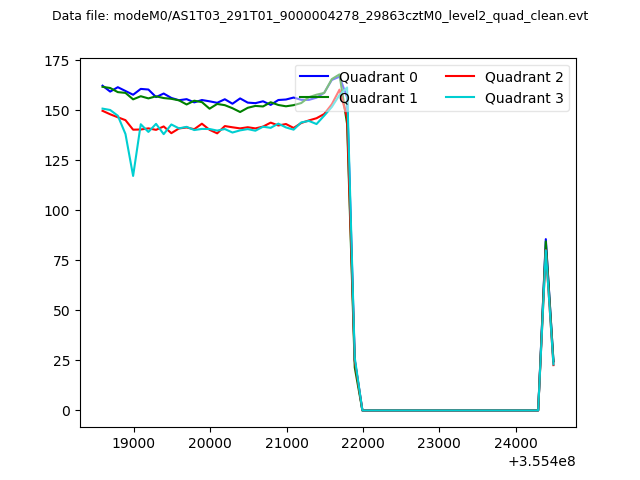 |
|
| Module-wise count rates for Quadrant A Data is divided into 100 sec bins |
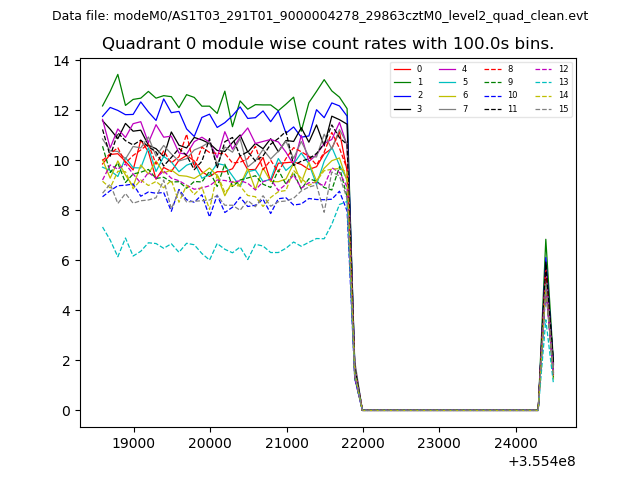 |
 |
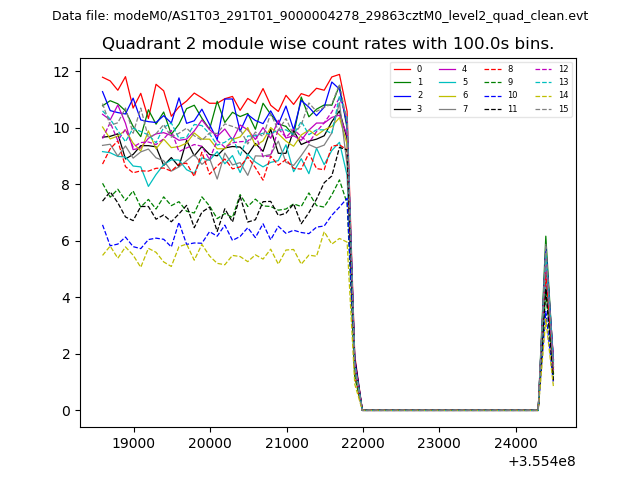
| Module-wise count rates for Quadrant B Data is divided into 100 sec bins |
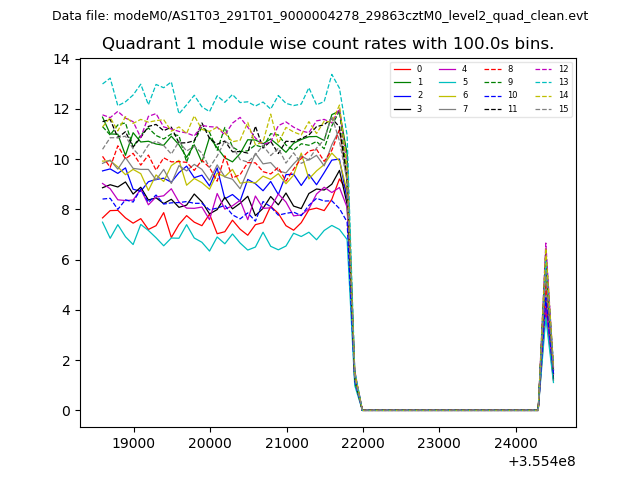 |
 |
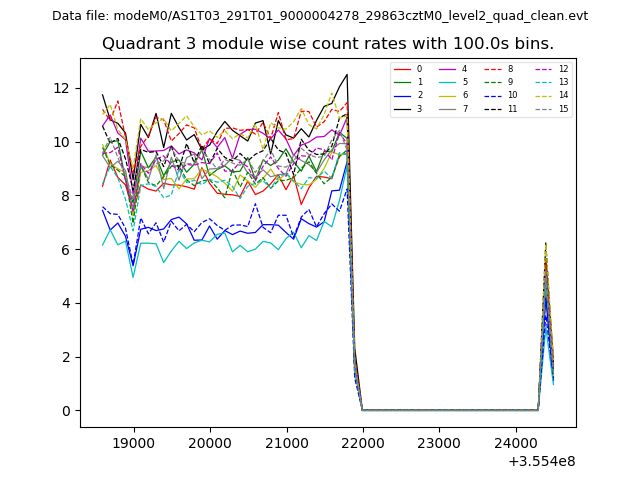
| Module-wise count rates for Quadrant C Data is divided into 100 sec bins |
 |
 |
| Module-wise count rates for Quadrant D Data is divided into 100 sec bins |
 |
 |
| Parameter | Plot |
|---|---|
| CZT HV Monitor | 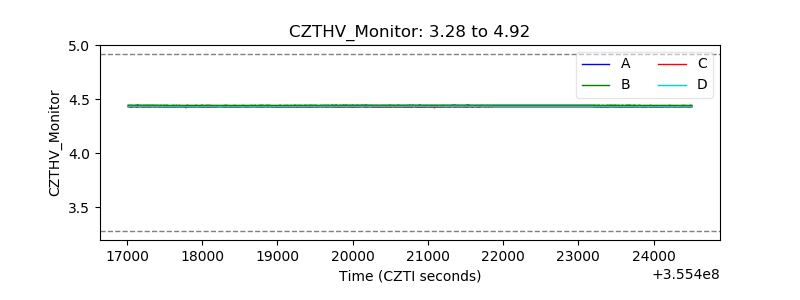 |
| D_VDD |  |
| Temperature 1 | 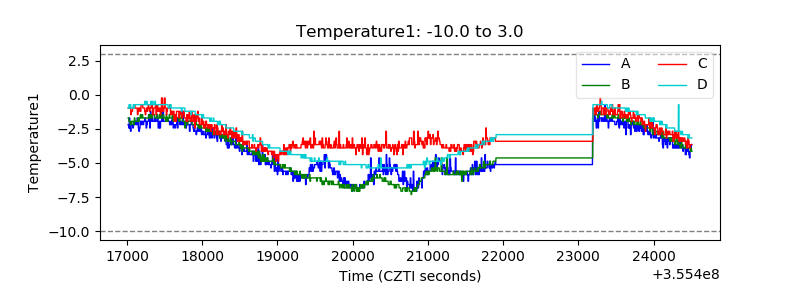 |
| Veto HV Monitor | 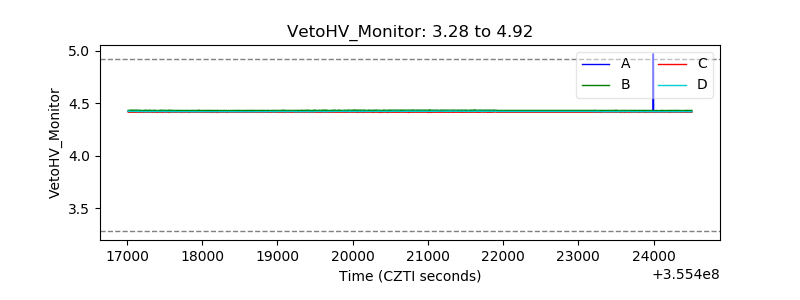 |
| Veto LLD | 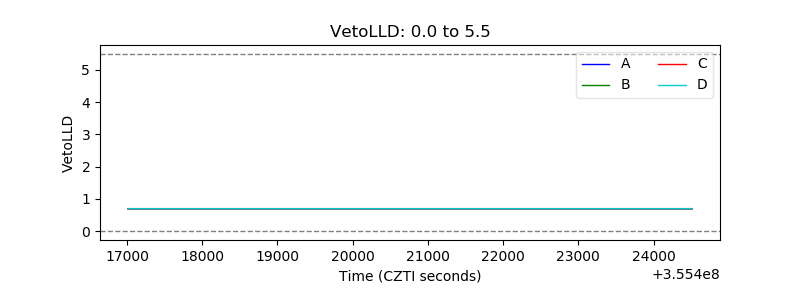 |
| Alpha Counter | 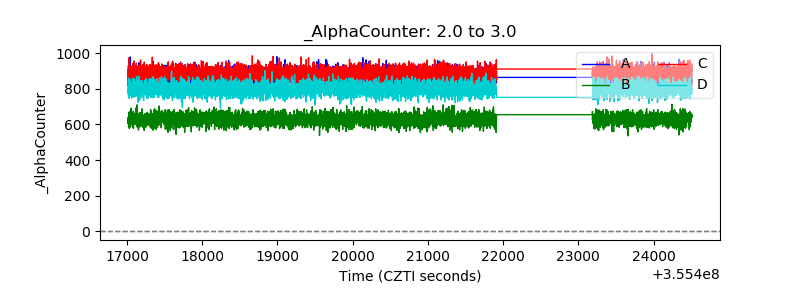 |
| _CPM_Rate | 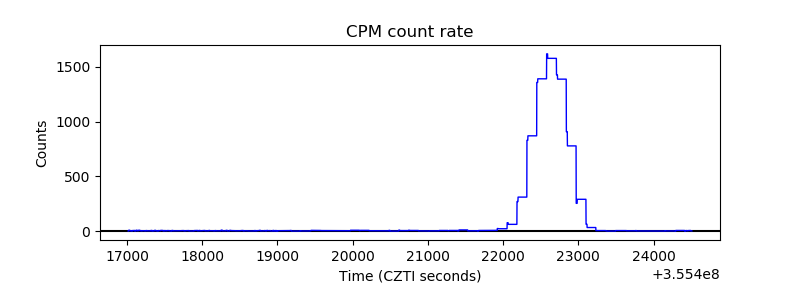 |
| CZT Counter |  |
| +2.5 Volts monitor |  |
| +5 Volts monitor | 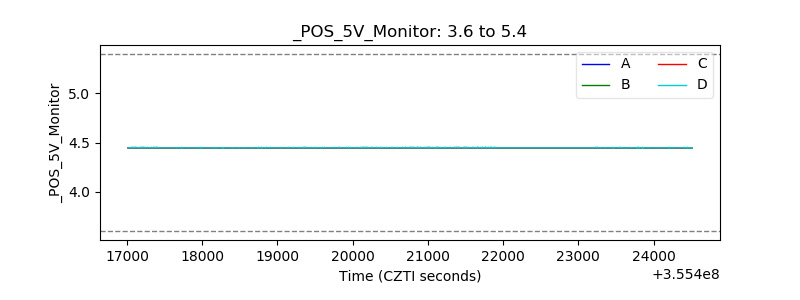 |
| _ROLL_ROT | 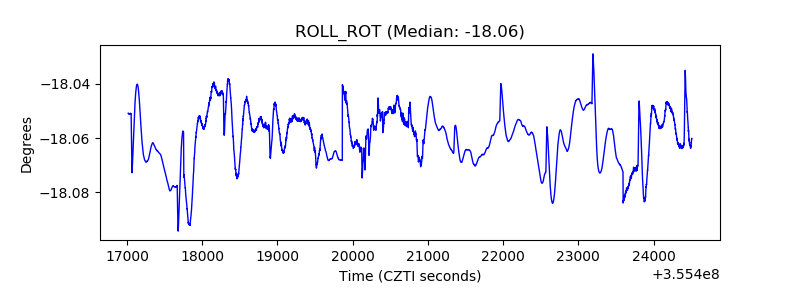 |
| _Roll_DEC | 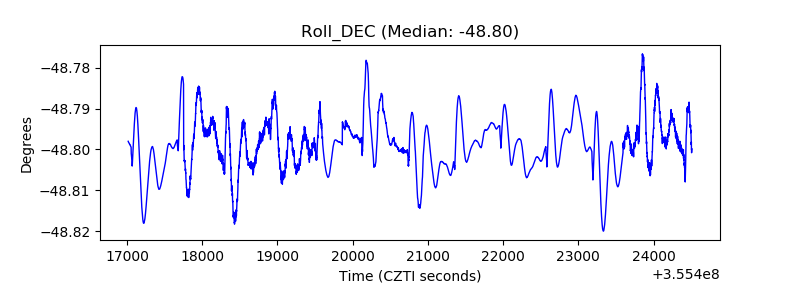 |
| _Roll_RA | 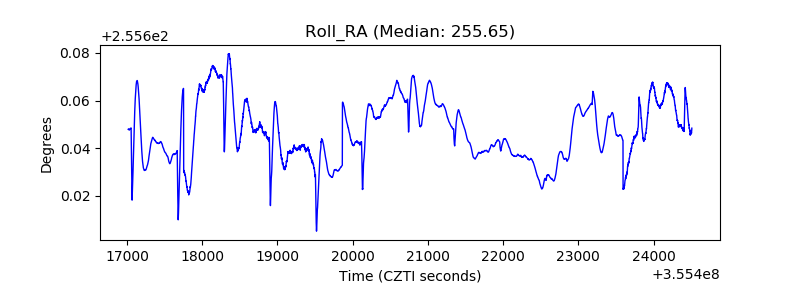 |
| Veto Counter | 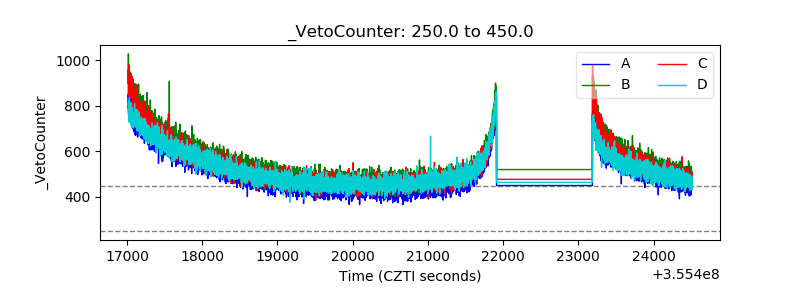 |