| Param | Original file | Final file |
|---|---|---|
| Filename | modeM0/AS1T03_291T01_9000004278_29864cztM0_level2.evt | modeM0/AS1T03_291T01_9000004278_29864cztM0_level2_quad_clean.evt |
| Size (bytes) | 569,888,640 | 98,372,160 |
| Size | 543.5 MB | 93.8 MB |
| Events in quadrant A | 3,385,428 | 654,262 |
| Events in quadrant B | 5,441,611 | 653,261 |
| Events in quadrant C | 4,027,575 | 611,914 |
| Events in quadrant D | 3,959,664 | 601,541 |
| Mode SS | |||
|---|---|---|---|
| Quadrant | BADHDUFLAG | Total packets | Discarded packets |
| A | 0 | 132 | 0 |
| B | 0 | 132 | 0 |
| C | 0 | 132 | 0 |
| D | 0 | 132 | 0 |
| Mode M0 | |||
|---|---|---|---|
| Quadrant | BADHDUFLAG | Total packets | Discarded packets |
| A | 0 | 14051 | 2 |
| B | 0 | 20297 | 2 |
| C | 0 | 16284 | 2 |
| D | 0 | 15940 | 2 |
| Mode M9 | |||
|---|---|---|---|
| Quadrant | BADHDUFLAG | Total packets | Discarded packets |
| A | 0 | 19 | 0 |
| B | 0 | 20 | 0 |
| C | 0 | 20 | 0 |
| D | 0 | 20 | 0 |
| Quadrant | Total seconds | Saturated seconds | Saturation percentage |
|---|---|---|---|
| A | 6576 | 54 | 0.821168% |
| B | 6576 | 134 | 2.037713% |
| C | 6576 | 137 | 2.083333% |
| D | 6576 | 126 | 1.916058% |
Noise dominated data is calculated using 1-second bins in cleaned event files. If a bin has >2000 counts, and if more than 50% of those come from <1% of pixels, then it is considered to be noise-dominated and hence unusable.
| Quadrant | # 1 sec bins | Bins with >0 counts | Bins with >2000 counts | High rate bins dominated by noise | Noise dominated (total time) | Noise dominated (detector-on time) | Marked lightcurve |
|---|---|---|---|---|---|---|---|
| A | 7681 | 6577 | 7 | 7 | 0.09% | 0.11% | 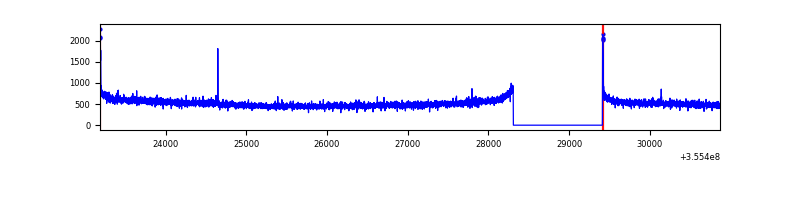 |
| B | 7681 | 6577 | 2 | 2 | 0.03% | 0.03% | 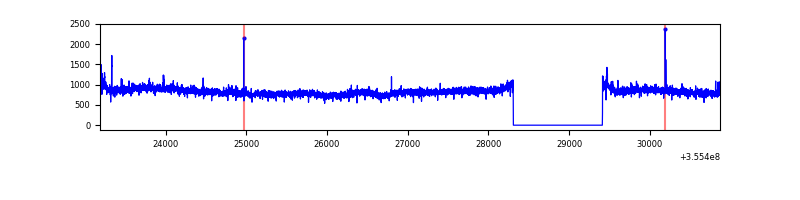 |
| C | 7681 | 6577 | 6 | 6 | 0.08% | 0.09% | 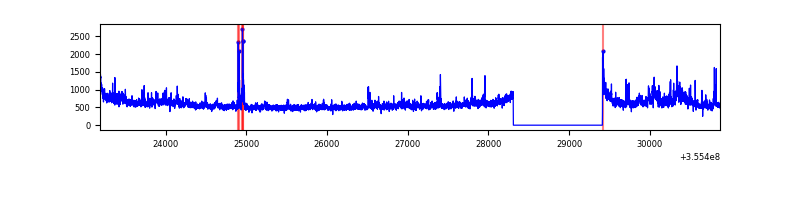 |
| D | 7681 | 6577 | 70 | 70 | 0.91% | 1.06% | 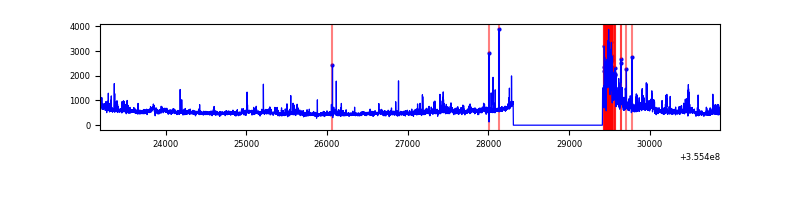 |
Top three noisy pixels from each quadrant. If the there are fewer than three noisy pixels in the level2.evt file, extra rows are filled as -1
| Pixel properties | Quadrant properties | ||||||
|---|---|---|---|---|---|---|---|
| Quadrant | DetID | PixID | Counts | Sigma | Mean | Median | Sigma |
| A | 8 | 192 | 29542 | 167.49 | 868 | 853 | 171.3 |
| A | 13 | 254 | 13386 | 73.17 | 868 | 853 | 171.3 |
| A | 3 | 137 | 8076 | 42.17 | 868 | 853 | 171.3 |
| B | 6 | 159 | 2024045 | 12593.97 | 858 | 841 | 160.6 |
| B | 0 | 190 | 45727 | 279.4 | 858 | 841 | 160.6 |
| B | 12 | 111 | 18635 | 110.76 | 858 | 841 | 160.6 |
| C | 3 | 233 | 652766 | 3459.45 | 815 | 821 | 188.5 |
| C | 14 | 238 | 136114 | 717.91 | 815 | 821 | 188.5 |
| C | 10 | 22 | 44791 | 233.32 | 815 | 821 | 188.5 |
| D | 8 | 195 | 422371 | 2185.95 | 817 | 796 | 192.9 |
| D | 7 | 238 | 211733 | 1093.75 | 817 | 796 | 192.9 |
| D | 7 | 80 | 53206 | 271.76 | 817 | 796 | 192.9 |
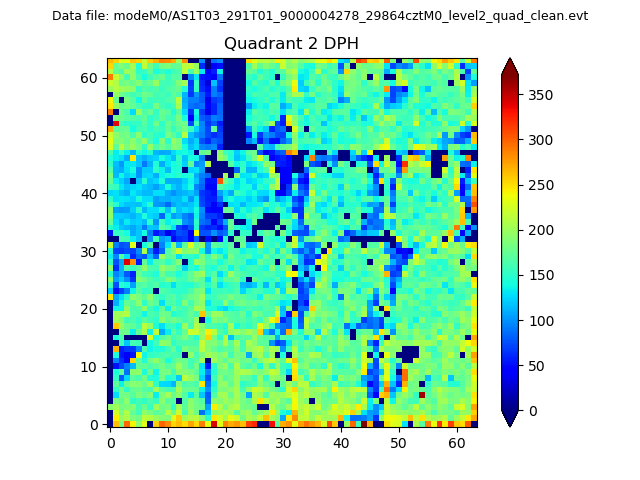
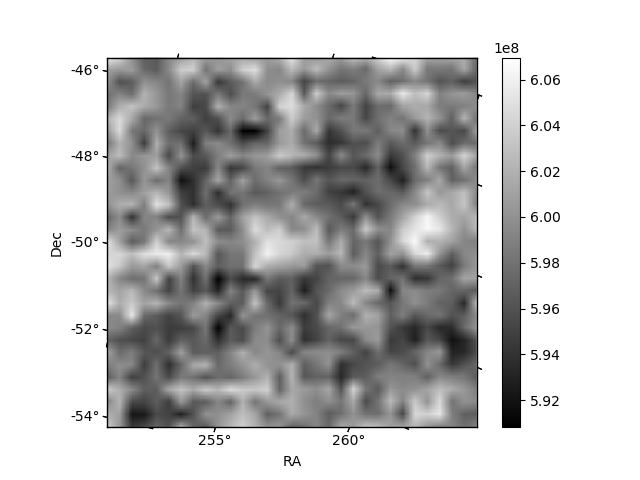
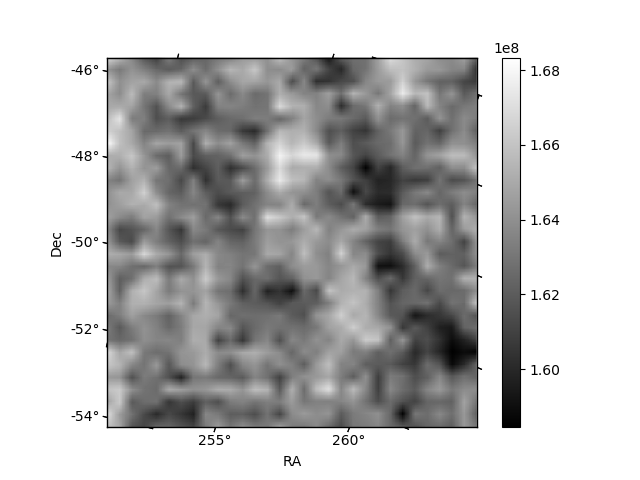
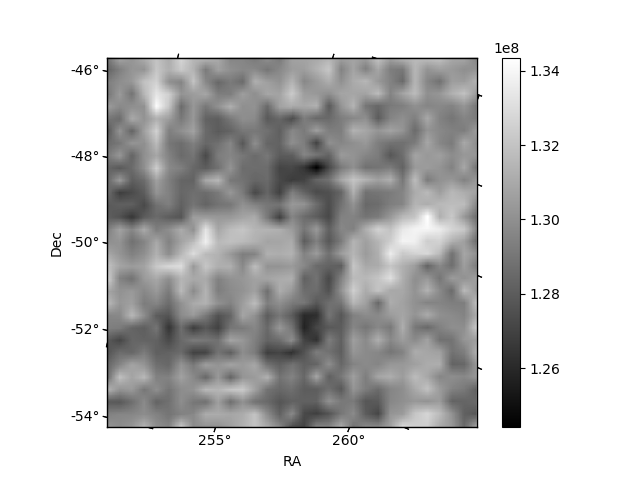
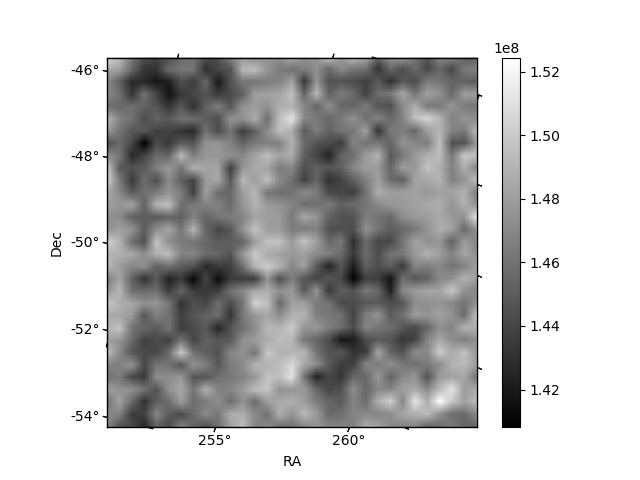
Histogram calculated using DETX and DETY for each event in the final _common_clean file
| Quadrant A | 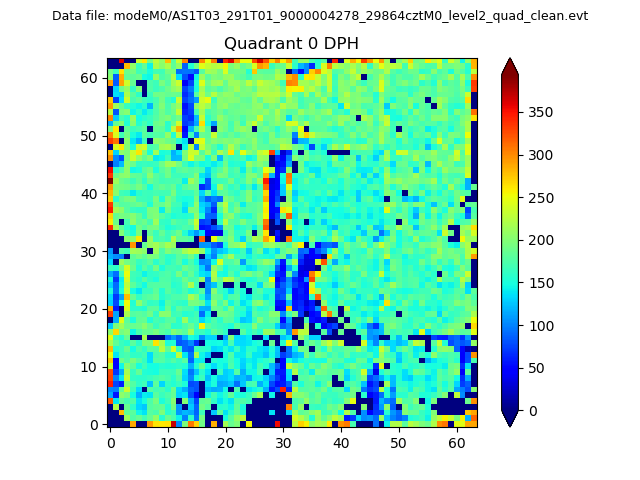 |
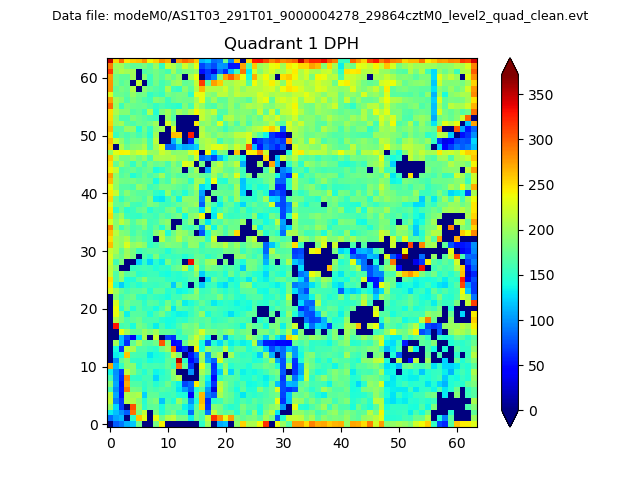 |
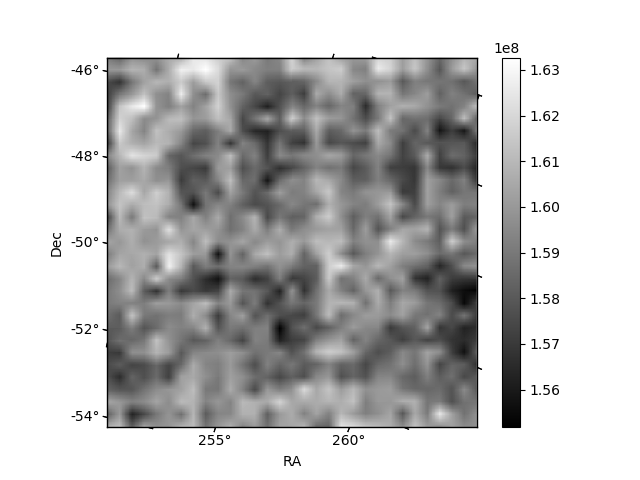
Quadrant B |
|---|---|---|---|
| Quadrant D | 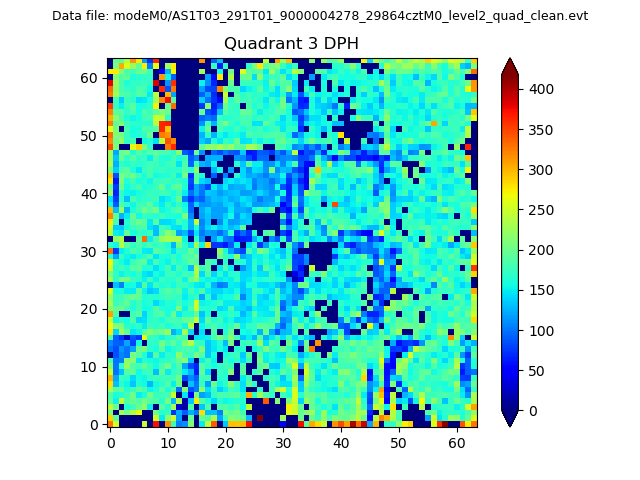 |
 |
Quadrant C |
| Plot type | Count rate plots | Images |
|---|---|---|
| Comparison with Poisson distribution Blue bars denote a histogram of data divided into 1 sec bins. Red curve is a Poisson curve with rate = median count rate of data. |
 |
 |
| Quadrant-wise count rates Data is divided into 100 sec bins |
 |
|
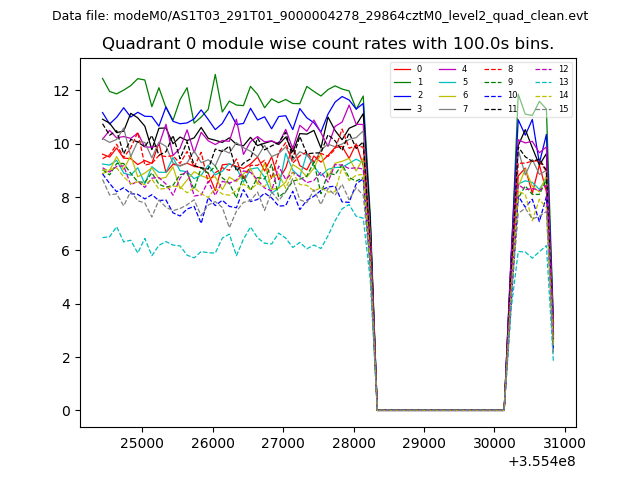
| Module-wise count rates for Quadrant A Data is divided into 100 sec bins |
 |
 |
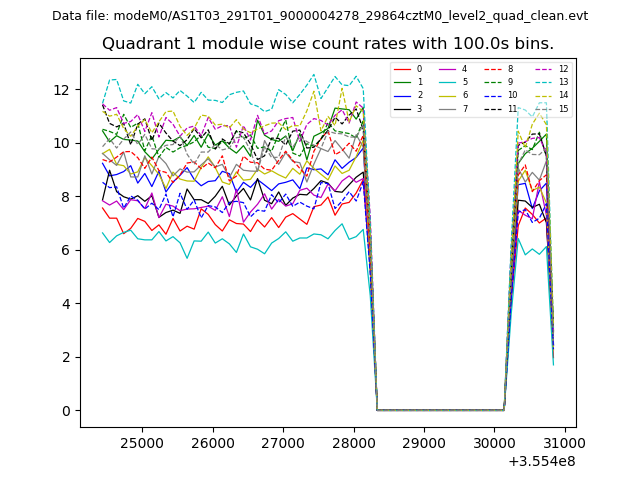
| Module-wise count rates for Quadrant B Data is divided into 100 sec bins |
 |
 |
| Module-wise count rates for Quadrant C Data is divided into 100 sec bins |
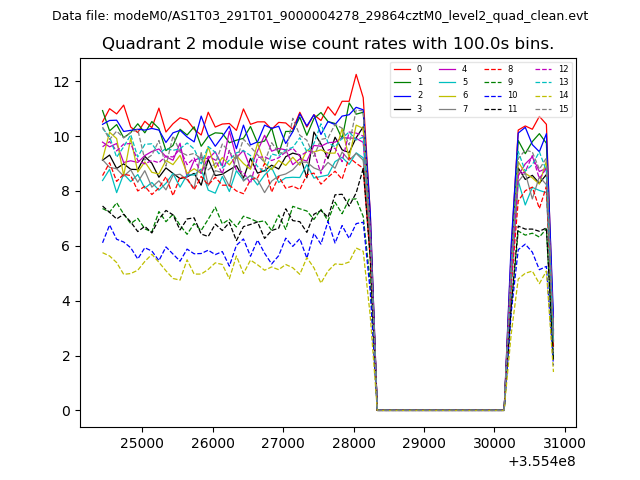 |
 |
| Module-wise count rates for Quadrant D Data is divided into 100 sec bins |
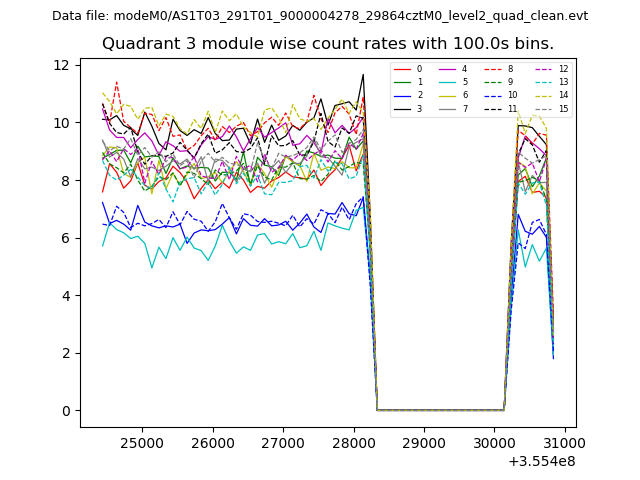 |
 |
| Parameter | Plot |
|---|---|
| CZT HV Monitor | 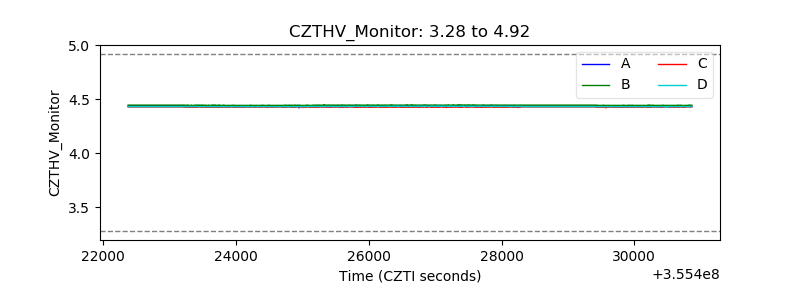 |
| D_VDD | 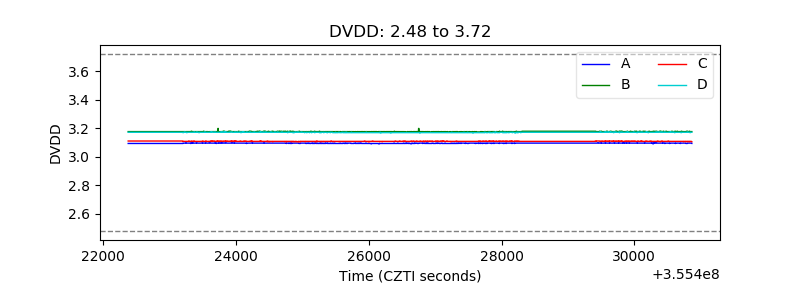 |
| Temperature 1 | 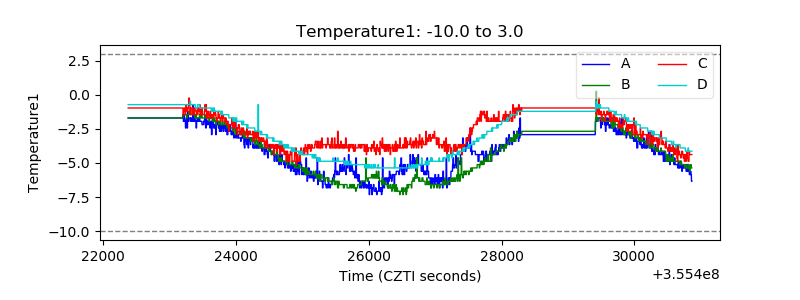 |
| Veto HV Monitor | 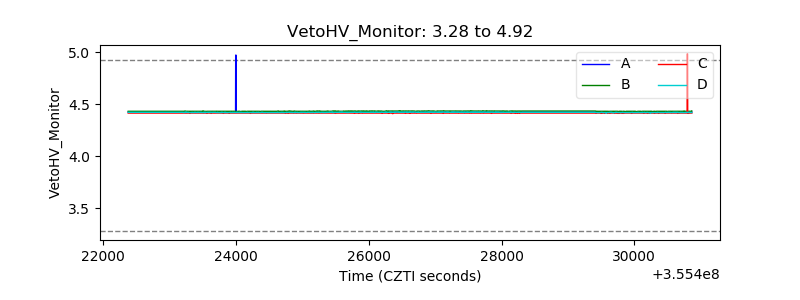 |
| Veto LLD | 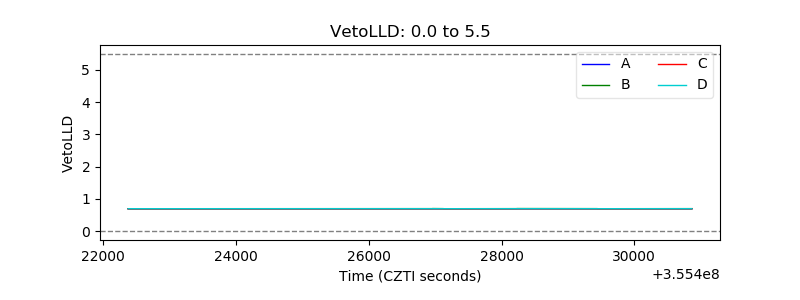 |
| Alpha Counter | 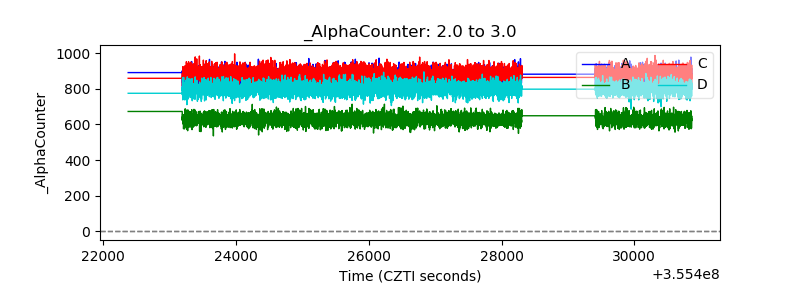 |
| _CPM_Rate | 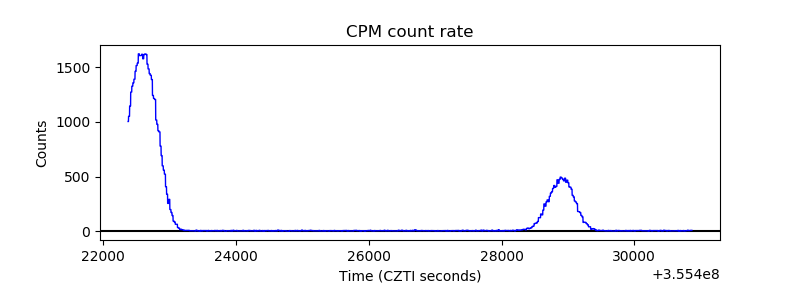 |
| CZT Counter | 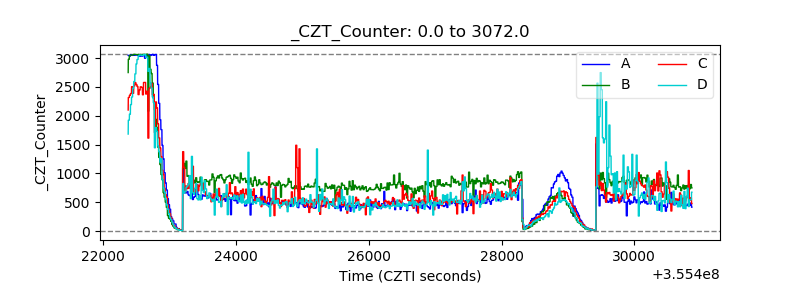 |
| +2.5 Volts monitor |  |
| +5 Volts monitor |  |
| _ROLL_ROT | 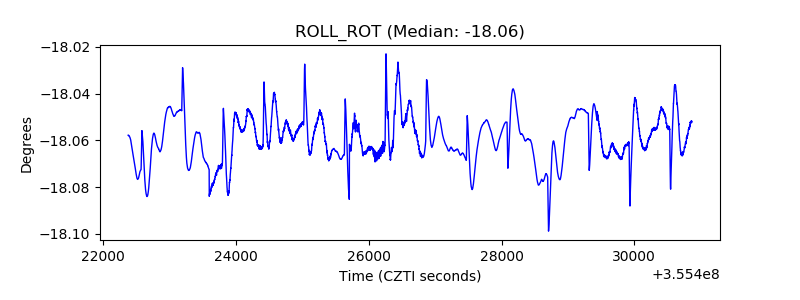 |
| _Roll_DEC | 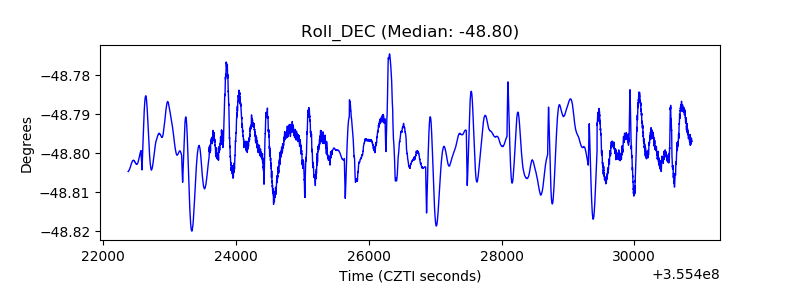 |
| _Roll_RA | 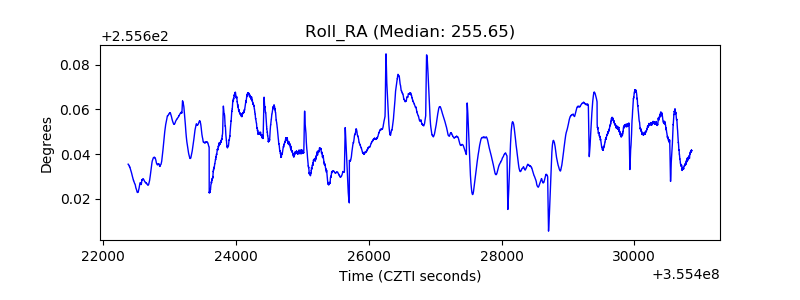 |
| Veto Counter | 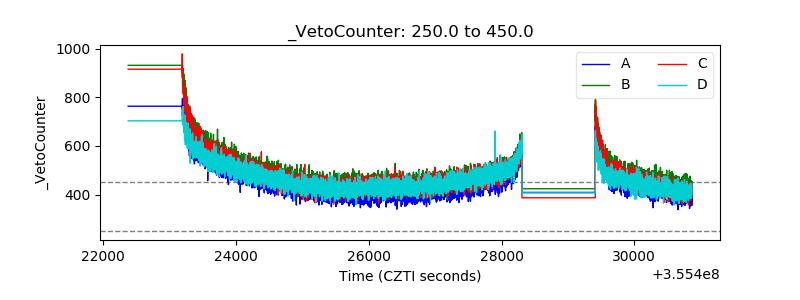 |