| Param | Original file | Final file |
|---|---|---|
| Filename | modeM0/AS1T03_291T01_9000004278_29865cztM0_level2.evt | modeM0/AS1T03_291T01_9000004278_29865cztM0_level2_quad_clean.evt |
| Size (bytes) | 584,579,520 | 101,237,760 |
| Size | 557.5 MB | 96.5 MB |
| Events in quadrant A | 3,277,062 | 673,172 |
| Events in quadrant B | 5,355,138 | 671,939 |
| Events in quadrant C | 4,713,325 | 626,880 |
| Events in quadrant D | 3,900,267 | 621,912 |
| Mode SS | |||
|---|---|---|---|
| Quadrant | BADHDUFLAG | Total packets | Discarded packets |
| A | 0 | 138 | 0 |
| B | 0 | 138 | 0 |
| C | 0 | 138 | 0 |
| D | 0 | 138 | 0 |
| Mode M0 | |||
|---|---|---|---|
| Quadrant | BADHDUFLAG | Total packets | Discarded packets |
| A | 0 | 13966 | 1 |
| B | 0 | 20533 | 1 |
| C | 0 | 18765 | 1 |
| D | 0 | 15996 | 1 |
| Mode M9 | |||
|---|---|---|---|
| Quadrant | BADHDUFLAG | Total packets | Discarded packets |
| A | 0 | 6 | 0 |
| B | 0 | 6 | 0 |
| C | 0 | 6 | 0 |
| D | 0 | 6 | 0 |
| Quadrant | Total seconds | Saturated seconds | Saturation percentage |
|---|---|---|---|
| A | 6772 | 59 | 0.871234% |
| B | 6772 | 115 | 1.698169% |
| C | 6772 | 163 | 2.406970% |
| D | 6773 | 89 | 1.314041% |
Noise dominated data is calculated using 1-second bins in cleaned event files. If a bin has >2000 counts, and if more than 50% of those come from <1% of pixels, then it is considered to be noise-dominated and hence unusable.
| Quadrant | # 1 sec bins | Bins with >0 counts | Bins with >2000 counts | High rate bins dominated by noise | Noise dominated (total time) | Noise dominated (detector-on time) | Marked lightcurve |
|---|---|---|---|---|---|---|---|
| A | 7427 | 6773 | 1 | 1 | 0.01% | 0.01% | 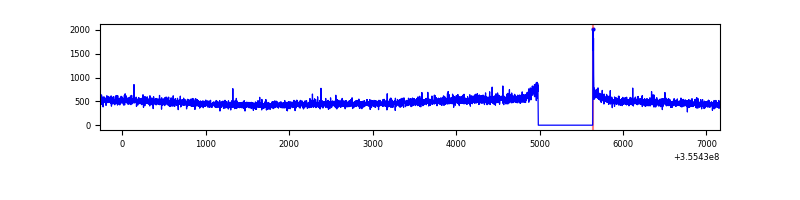 |
| B | 7427 | 6773 | 1 | 1 | 0.01% | 0.01% | 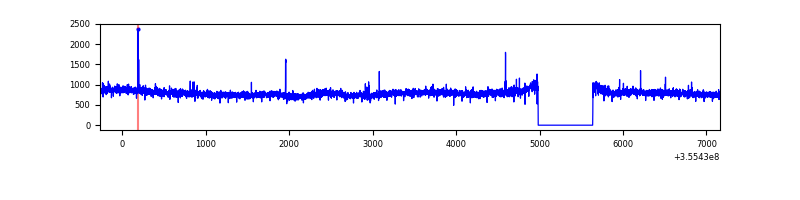 |
| C | 7427 | 6773 | 18 | 18 | 0.24% | 0.27% | 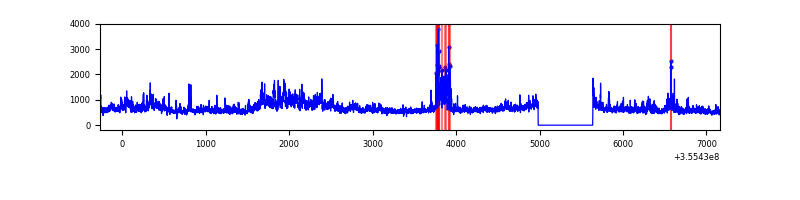 |
| D | 7428 | 6774 | 30 | 30 | 0.40% | 0.44% | 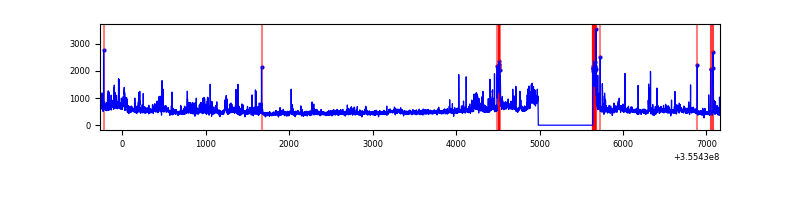 |
Top three noisy pixels from each quadrant. If the there are fewer than three noisy pixels in the level2.evt file, extra rows are filled as -1
| Pixel properties | Quadrant properties | ||||||
|---|---|---|---|---|---|---|---|
| Quadrant | DetID | PixID | Counts | Sigma | Mean | Median | Sigma |
| A | 8 | 192 | 15262 | 85.42 | 845 | 828 | 169.0 |
| A | 13 | 254 | 13628 | 75.75 | 845 | 828 | 169.0 |
| A | 3 | 137 | 8366 | 44.61 | 845 | 828 | 169.0 |
| B | 6 | 159 | 2039669 | 12773.9 | 835 | 813 | 159.6 |
| B | 12 | 111 | 19233 | 115.41 | 835 | 813 | 159.6 |
| B | 11 | 111 | 17340 | 103.55 | 835 | 813 | 159.6 |
| C | 3 | 233 | 1291414 | 6992.8 | 796 | 803 | 184.6 |
| C | 10 | 22 | 173691 | 936.74 | 796 | 803 | 184.6 |
| C | 14 | 238 | 130063 | 700.36 | 796 | 803 | 184.6 |
| D | 8 | 195 | 291119 | 1512.32 | 804 | 783 | 192.0 |
| D | 1 | 52 | 182048 | 944.19 | 804 | 783 | 192.0 |
| D | 13 | 153 | 141789 | 734.48 | 804 | 783 | 192.0 |
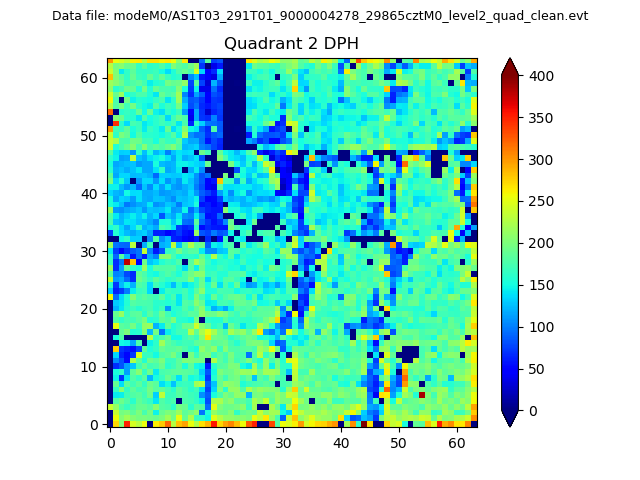
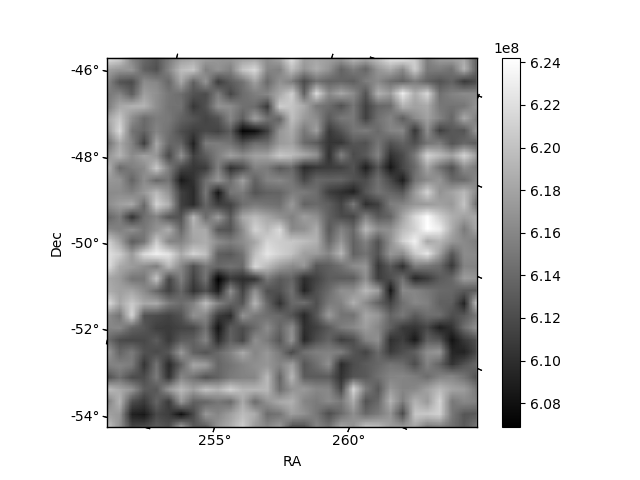
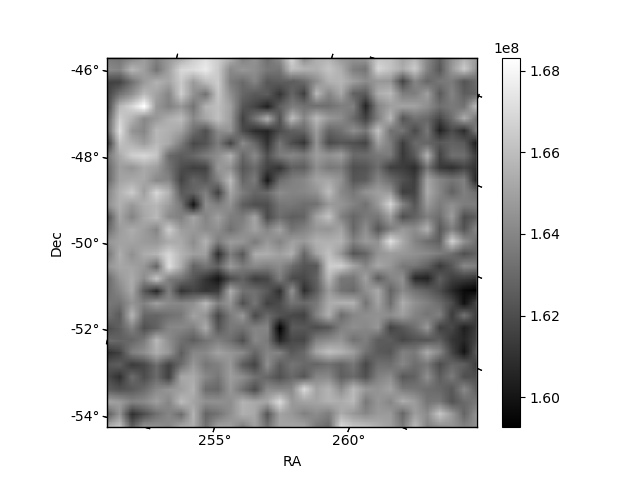
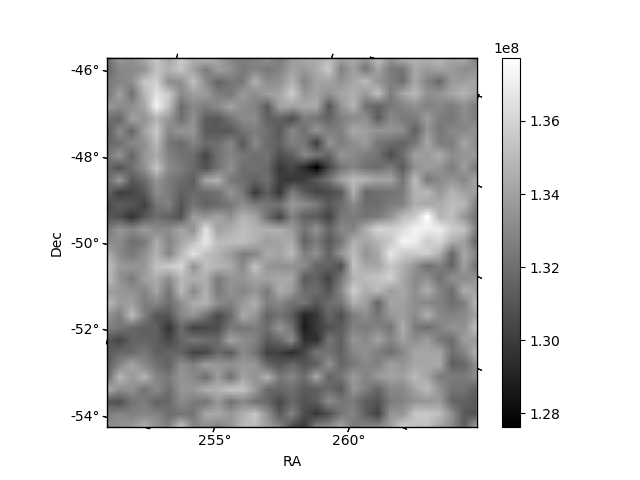
Histogram calculated using DETX and DETY for each event in the final _common_clean file
| Quadrant A | 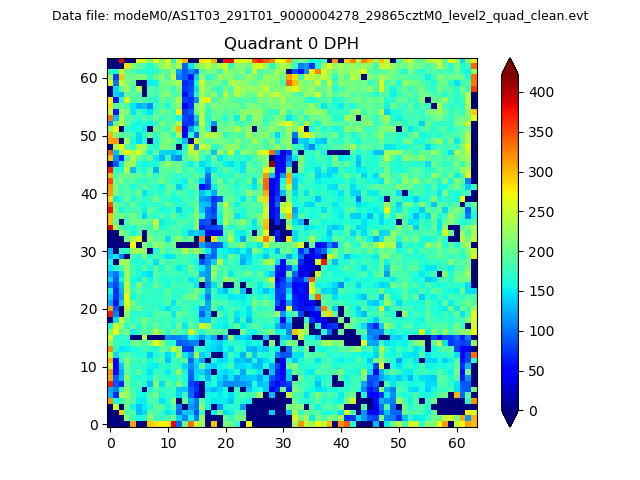 |
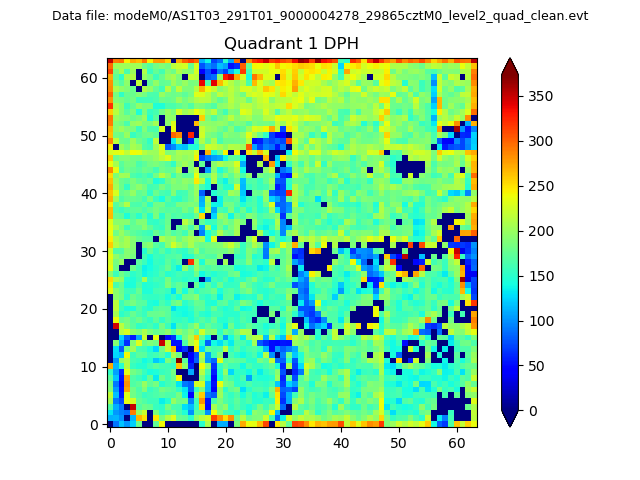 |
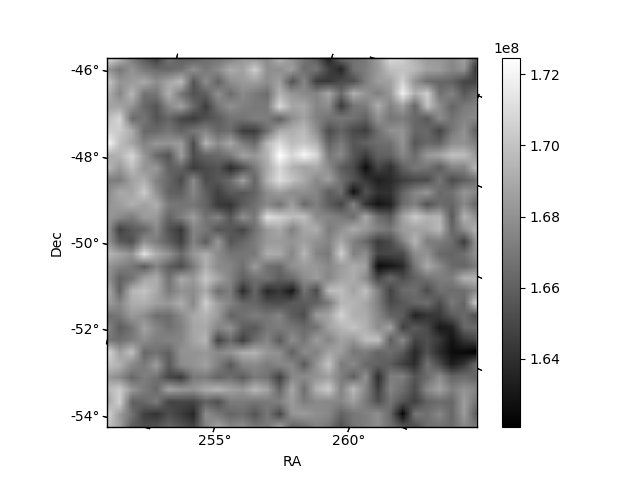
Quadrant B |
|---|---|---|---|
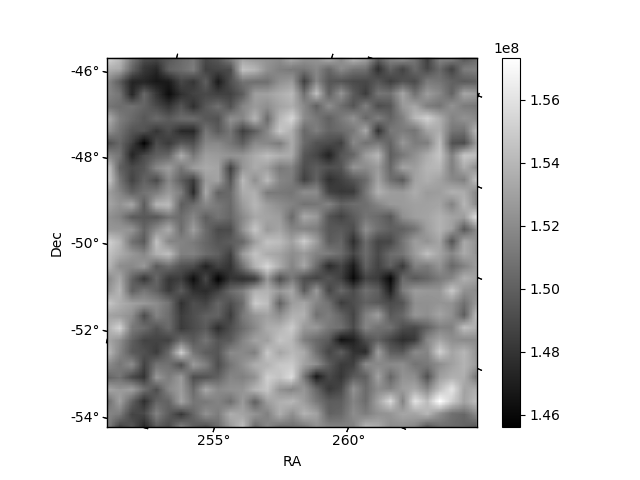
| Quadrant D | 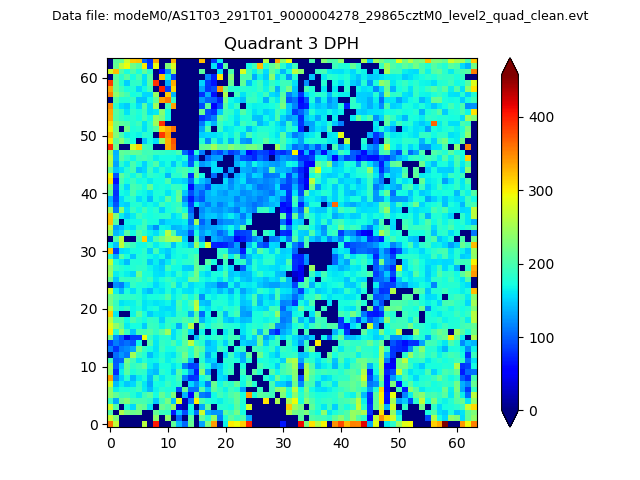 |
 |
Quadrant C |
| Plot type | Count rate plots | Images |
|---|---|---|
| Comparison with Poisson distribution Blue bars denote a histogram of data divided into 1 sec bins. Red curve is a Poisson curve with rate = median count rate of data. |
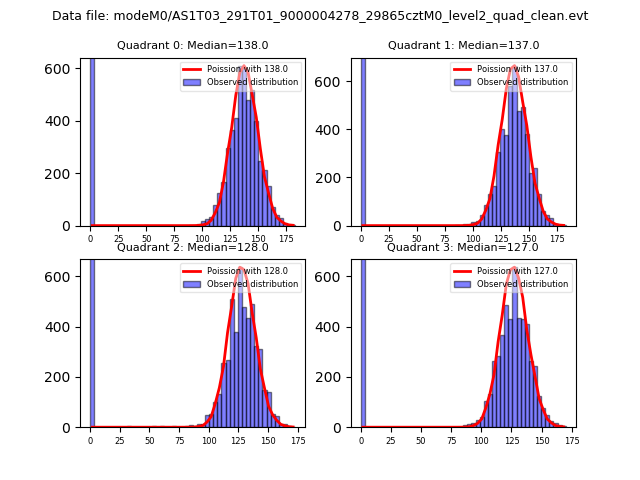 |
 |
| Quadrant-wise count rates Data is divided into 100 sec bins |
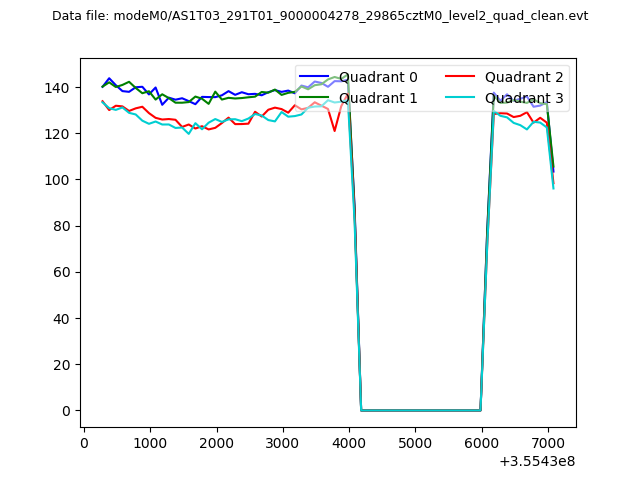 |
|
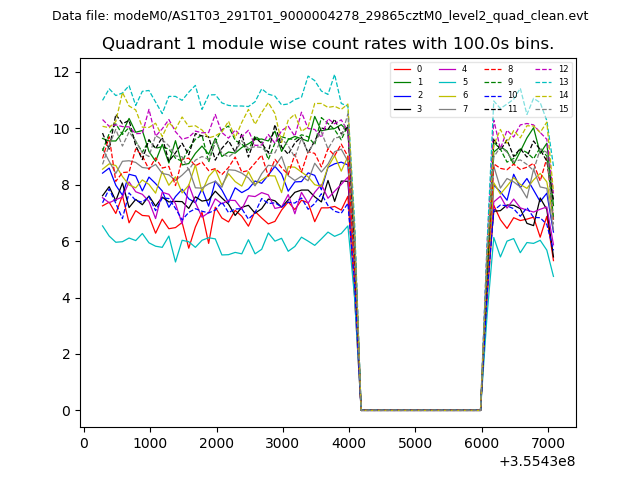
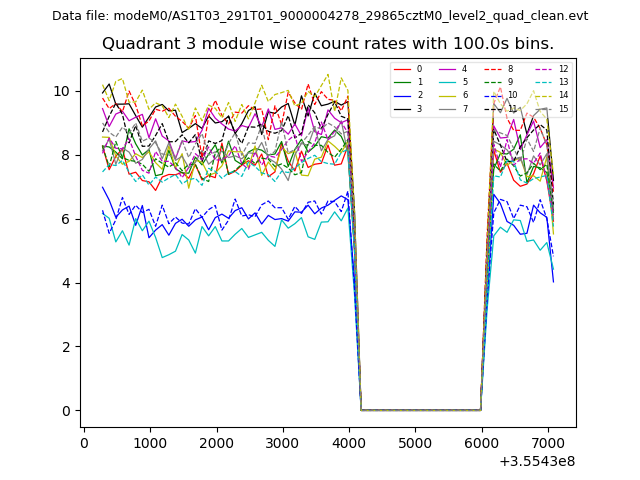
| Module-wise count rates for Quadrant A Data is divided into 100 sec bins |
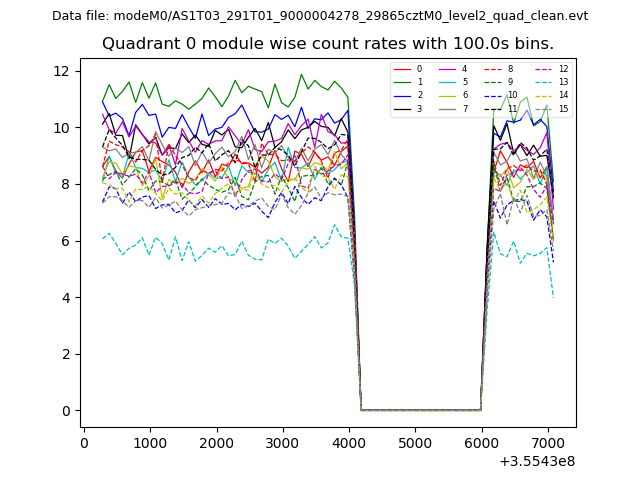 |
 |
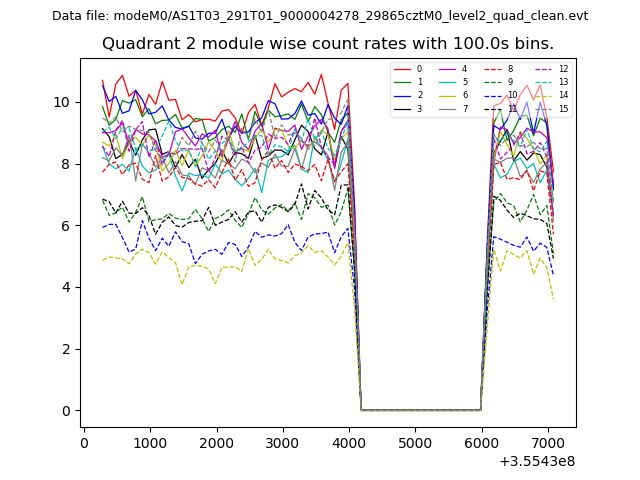
| Module-wise count rates for Quadrant B Data is divided into 100 sec bins |
 |
 |
| Module-wise count rates for Quadrant C Data is divided into 100 sec bins |
 |
 |
| Module-wise count rates for Quadrant D Data is divided into 100 sec bins |
 |
 |
| Parameter | Plot |
|---|---|
| CZT HV Monitor | 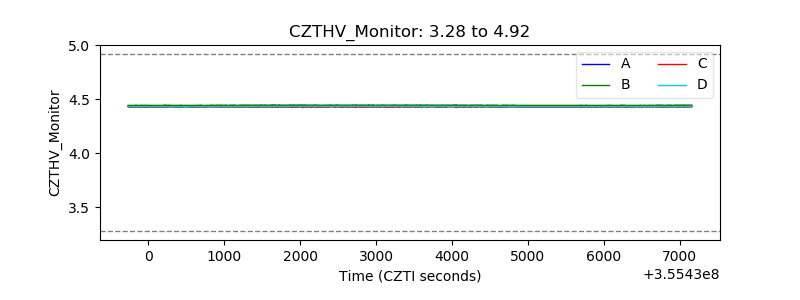 |
| D_VDD | 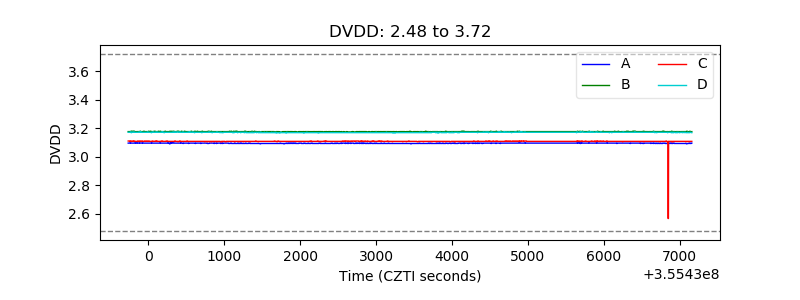 |
| Temperature 1 | 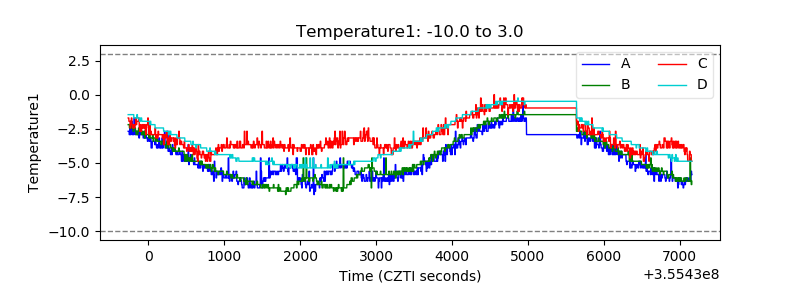 |
| Veto HV Monitor | 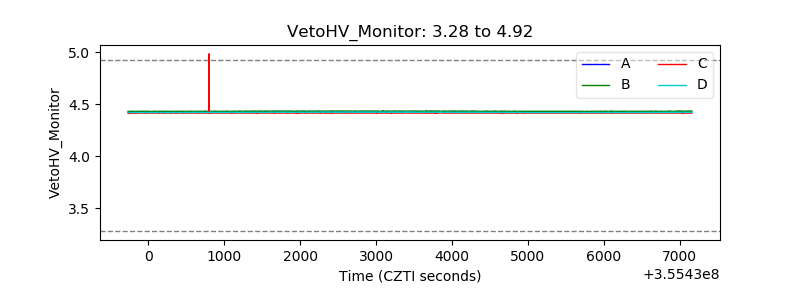 |
| Veto LLD | 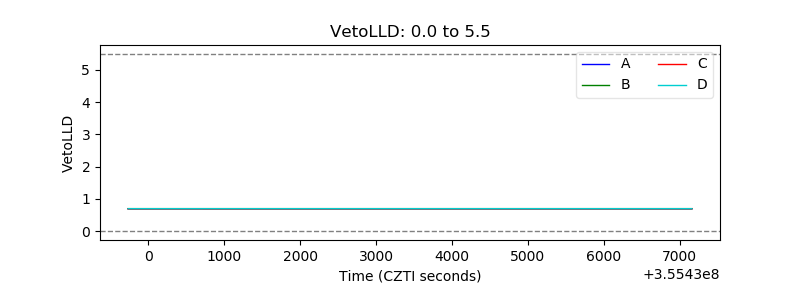 |
| Alpha Counter | 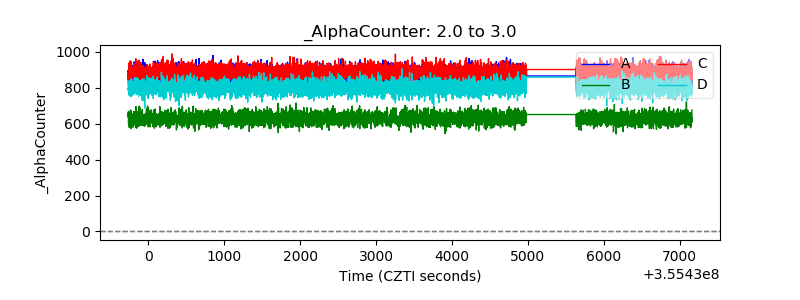 |
| _CPM_Rate | 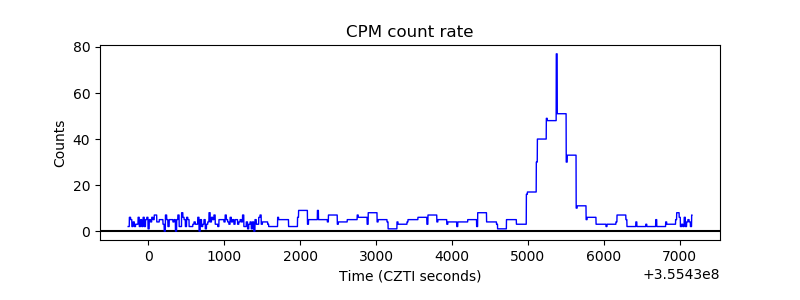 |
| CZT Counter | 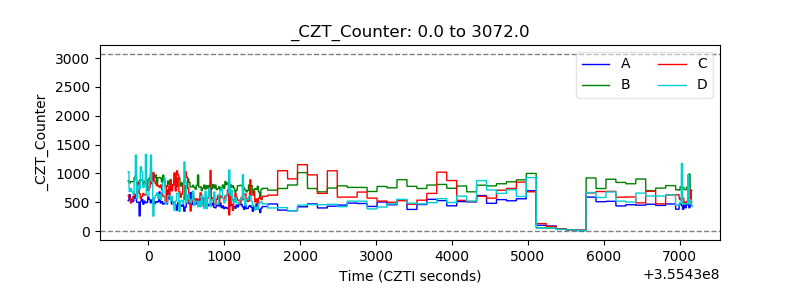 |
| +2.5 Volts monitor | 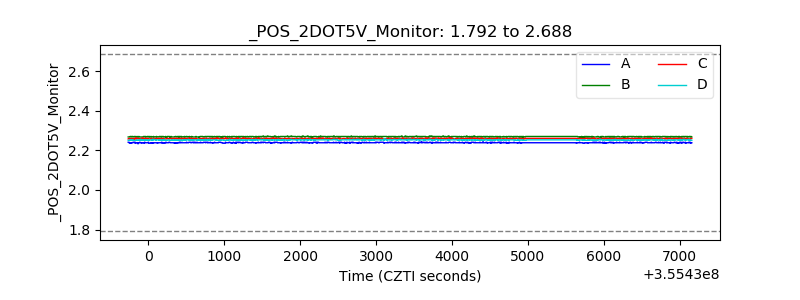 |
| +5 Volts monitor |  |
| _ROLL_ROT | 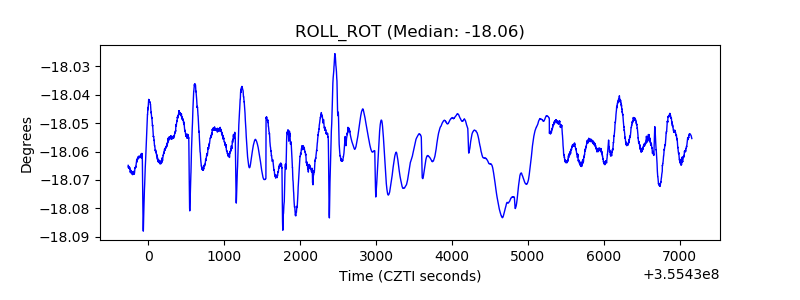 |
| _Roll_DEC | 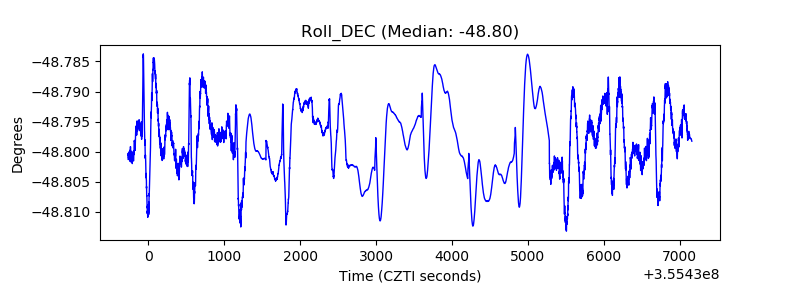 |
| _Roll_RA | 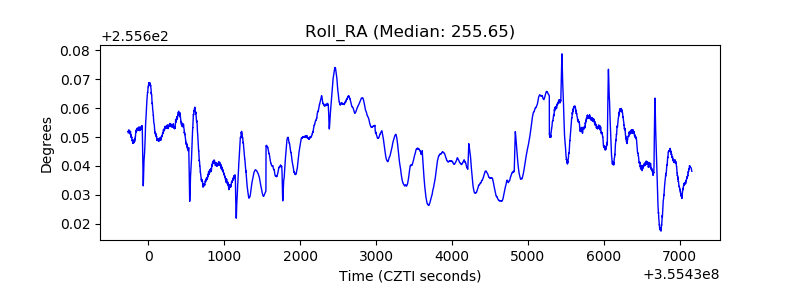 |
| Veto Counter |  |