| Param | Original file | Final file |
|---|---|---|
| Filename | modeM0/AS1T03_291T01_9000004278_29866cztM0_level2.evt | modeM0/AS1T03_291T01_9000004278_29866cztM0_level2_quad_clean.evt |
| Size (bytes) | 179,832,960 | 30,516,480 |
| Size | 171.5 MB | 29.1 MB |
| Events in quadrant A | 1,036,813 | 199,133 |
| Events in quadrant B | 1,672,708 | 197,787 |
| Events in quadrant C | 1,335,453 | 187,507 |
| Events in quadrant D | 1,255,029 | 185,553 |
| Mode SS | |||
|---|---|---|---|
| Quadrant | BADHDUFLAG | Total packets | Discarded packets |
| A | 0 | 46 | 0 |
| B | 0 | 46 | 0 |
| C | 0 | 46 | 0 |
| D | 0 | 46 | 0 |
| Mode M0 | |||
|---|---|---|---|
| Quadrant | BADHDUFLAG | Total packets | Discarded packets |
| A | 0 | 4494 | 1 |
| B | 0 | 6465 | 1 |
| C | 0 | 5378 | 1 |
| D | 0 | 5119 | 1 |
| Mode M9 | |||
|---|---|---|---|
| Quadrant | BADHDUFLAG | Total packets | Discarded packets |
| A | 0 | 6 | 0 |
| B | 0 | 6 | 0 |
| C | 0 | 6 | 0 |
| D | 0 | 6 | 0 |
| Quadrant | Total seconds | Saturated seconds | Saturation percentage |
|---|---|---|---|
| A | 2114 | 56 | 2.649007% |
| B | 2114 | 95 | 4.493851% |
| C | 2115 | 63 | 2.978723% |
| D | 2115 | 70 | 3.309693% |
Noise dominated data is calculated using 1-second bins in cleaned event files. If a bin has >2000 counts, and if more than 50% of those come from <1% of pixels, then it is considered to be noise-dominated and hence unusable.
| Quadrant | # 1 sec bins | Bins with >0 counts | Bins with >2000 counts | High rate bins dominated by noise | Noise dominated (total time) | Noise dominated (detector-on time) | Marked lightcurve |
|---|---|---|---|---|---|---|---|
| A | 2769 | 2115 | 1 | 1 | 0.04% | 0.05% | 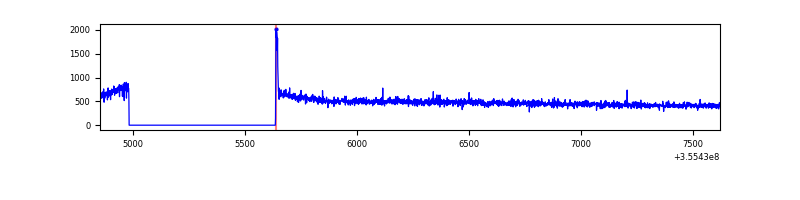 |
| B | 2769 | 2115 | 0 | 0 | 0.00% | 0.00% | 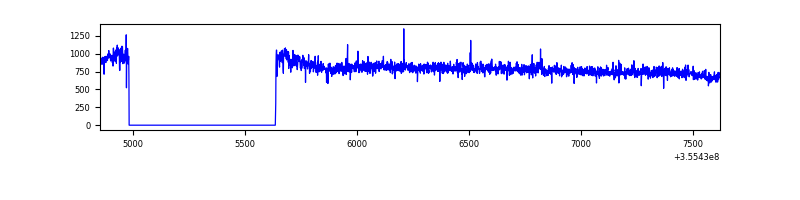 |
| C | 2770 | 2116 | 2 | 2 | 0.07% | 0.09% | 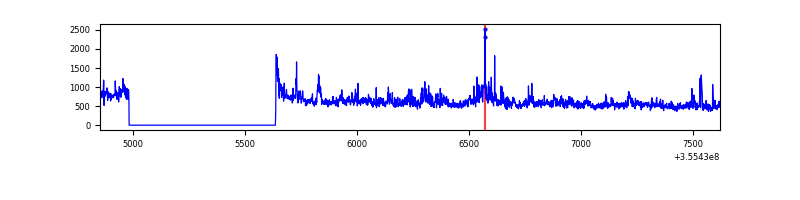 |
| D | 2770 | 2116 | 21 | 21 | 0.76% | 0.99% | 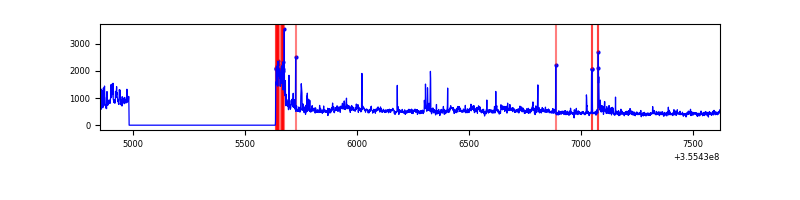 |
Top three noisy pixels from each quadrant. If the there are fewer than three noisy pixels in the level2.evt file, extra rows are filled as -1
| Pixel properties | Quadrant properties | ||||||
|---|---|---|---|---|---|---|---|
| Quadrant | DetID | PixID | Counts | Sigma | Mean | Median | Sigma |
| A | 8 | 192 | 14433 | 258.65 | 264 | 258 | 54.8 |
| A | 13 | 254 | 4416 | 75.87 | 264 | 258 | 54.8 |
| A | 3 | 137 | 2763 | 45.71 | 264 | 258 | 54.8 |
| B | 6 | 159 | 627817 | 11899.42 | 263 | 257 | 52.7 |
| B | 12 | 111 | 6246 | 113.56 | 263 | 257 | 52.7 |
| B | 0 | 190 | 5556 | 100.48 | 263 | 257 | 52.7 |
| C | 3 | 233 | 305211 | 5090.33 | 248 | 249 | 59.9 |
| C | 14 | 238 | 39782 | 659.87 | 248 | 249 | 59.9 |
| C | 10 | 22 | 16181 | 265.93 | 248 | 249 | 59.9 |
| D | 12 | 227 | 75221 | 1225.03 | 248 | 241 | 61.2 |
| D | 8 | 195 | 60057 | 977.28 | 248 | 241 | 61.2 |
| D | 1 | 52 | 56627 | 921.24 | 248 | 241 | 61.2 |
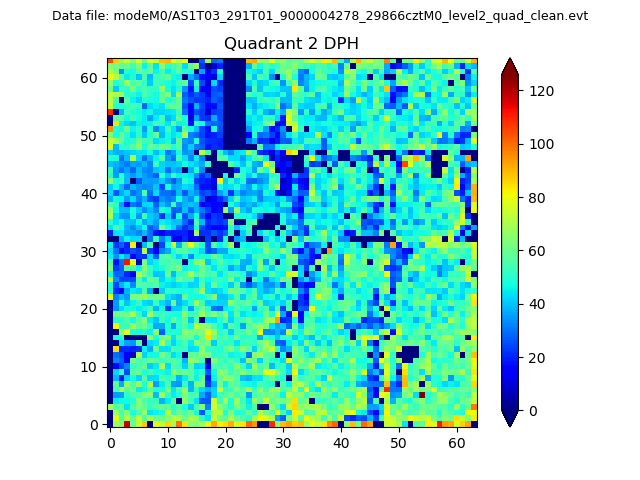
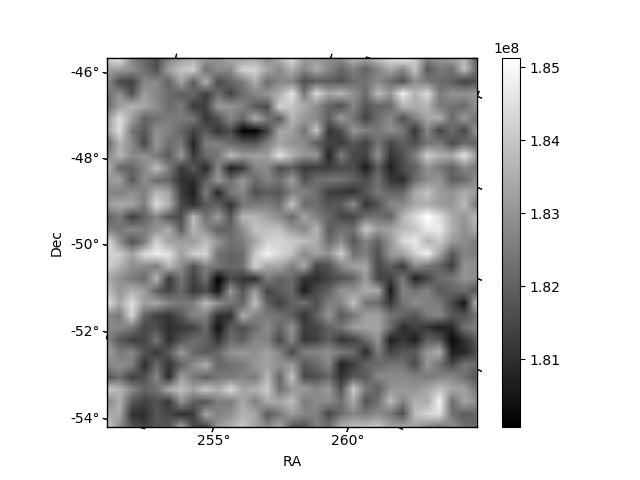
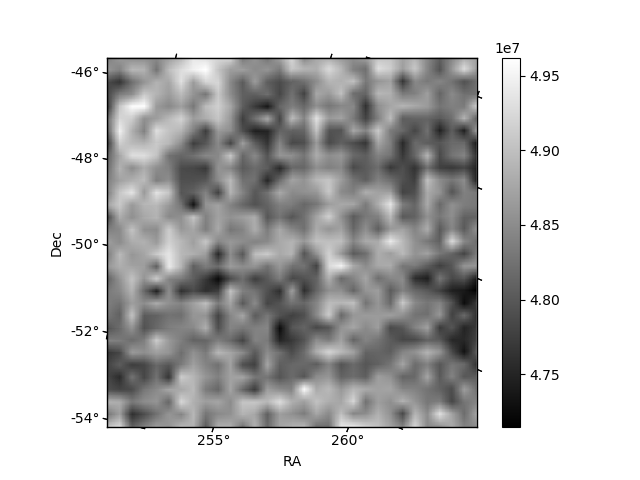
Histogram calculated using DETX and DETY for each event in the final _common_clean file
| Quadrant A | 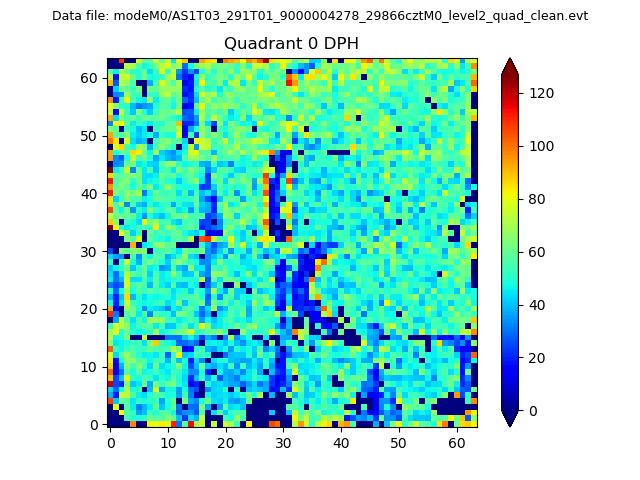 |
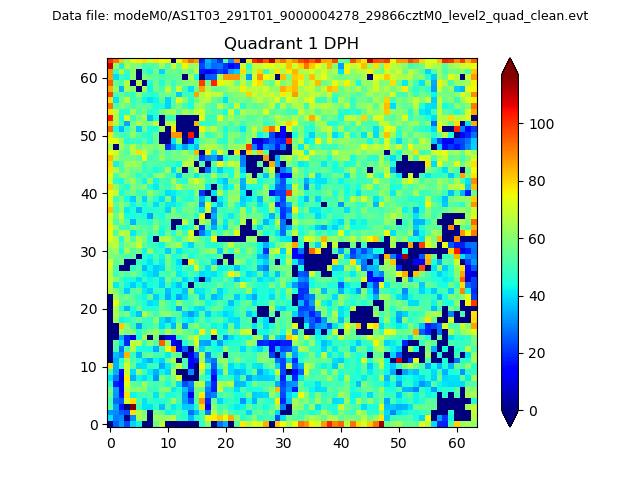 |
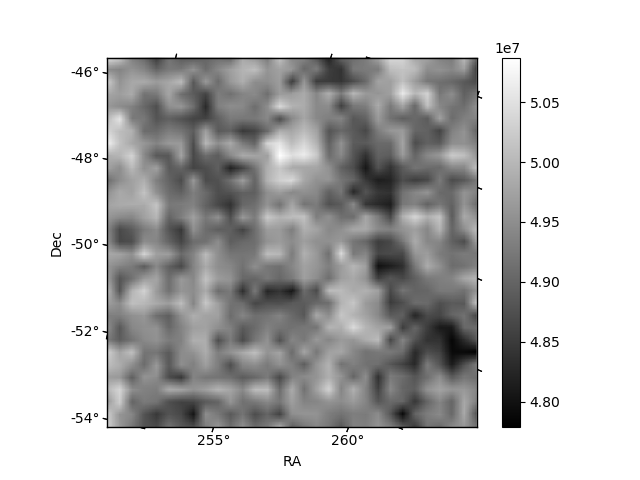
Quadrant B |
|---|---|---|---|
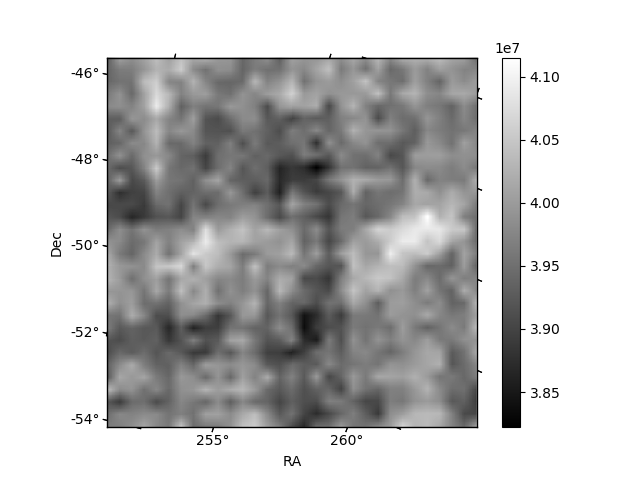
| Quadrant D | 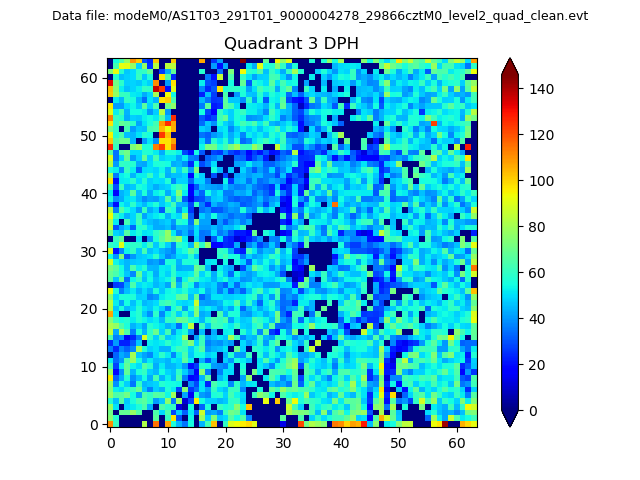 |
 |
Quadrant C |
| Plot type | Count rate plots | Images |
|---|---|---|
| Comparison with Poisson distribution Blue bars denote a histogram of data divided into 1 sec bins. Red curve is a Poisson curve with rate = median count rate of data. |
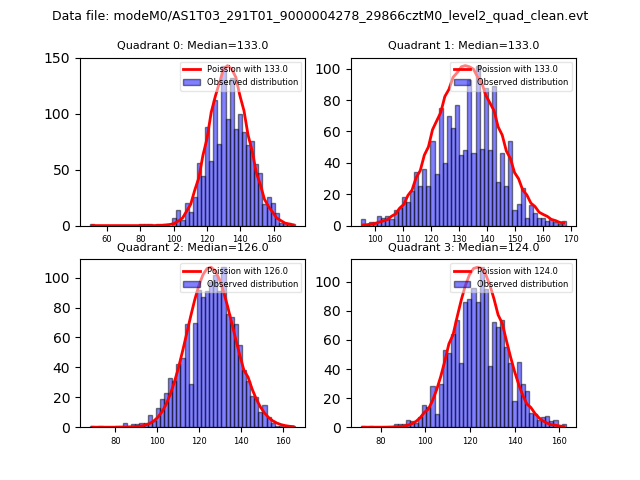 |
 |
| Quadrant-wise count rates Data is divided into 100 sec bins |
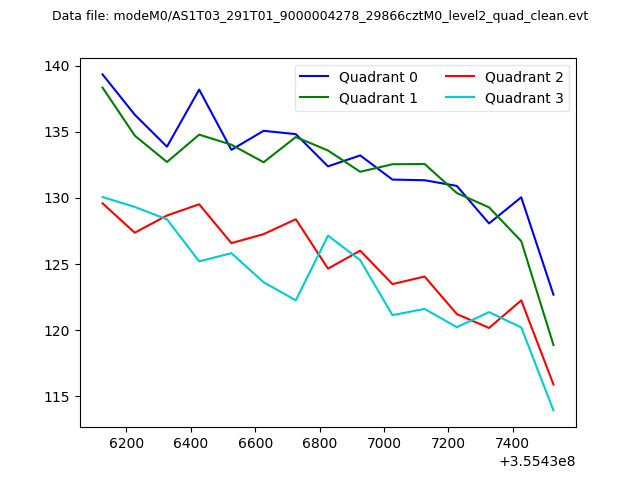 |
|
| Module-wise count rates for Quadrant A Data is divided into 100 sec bins |
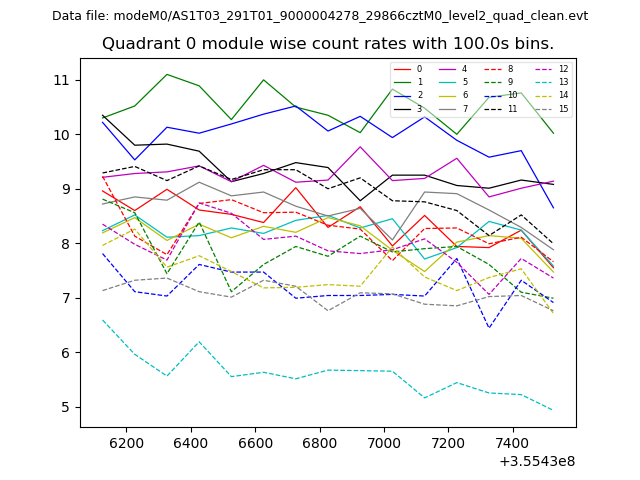 |
 |
| Module-wise count rates for Quadrant B Data is divided into 100 sec bins |
 |
 |
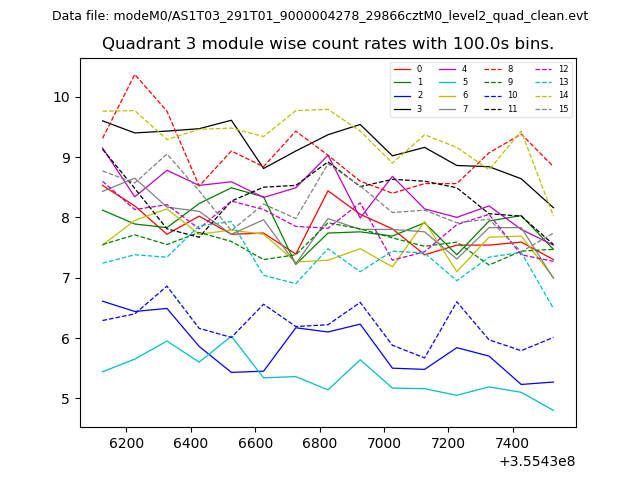
| Module-wise count rates for Quadrant C Data is divided into 100 sec bins |
 |
 |
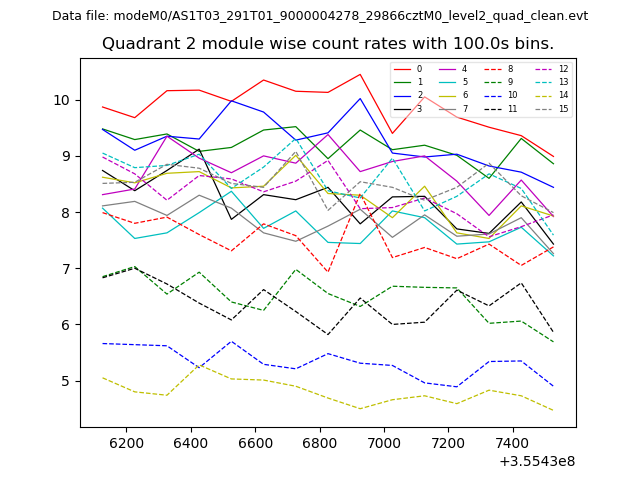
| Module-wise count rates for Quadrant D Data is divided into 100 sec bins |
 |
 |
| Parameter | Plot |
|---|---|
| CZT HV Monitor | 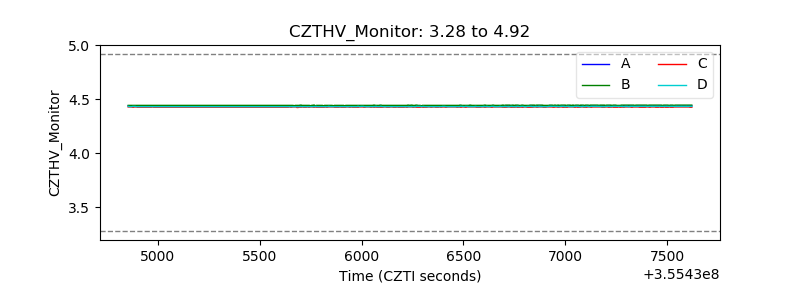 |
| D_VDD | 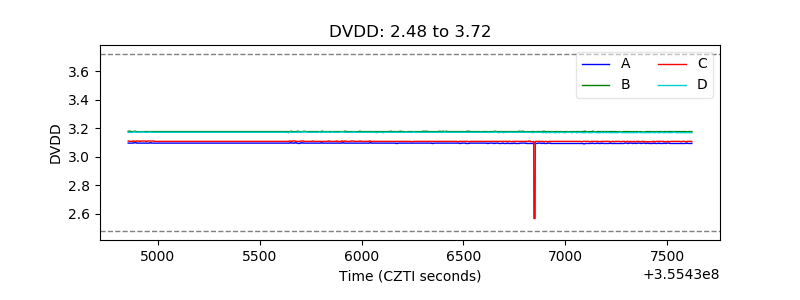 |
| Temperature 1 | 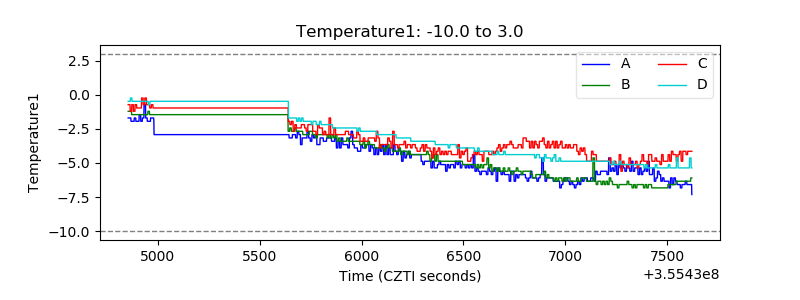 |
| Veto HV Monitor | 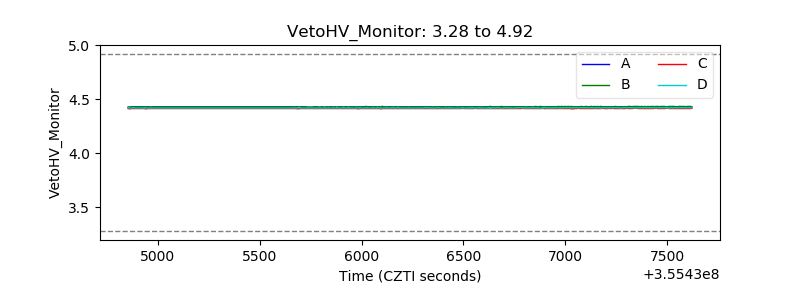 |
| Veto LLD | 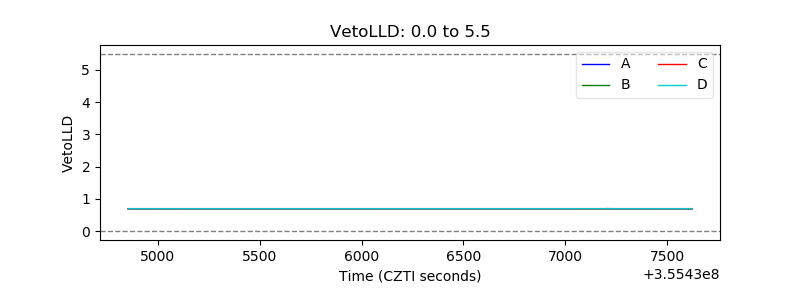 |
| Alpha Counter | 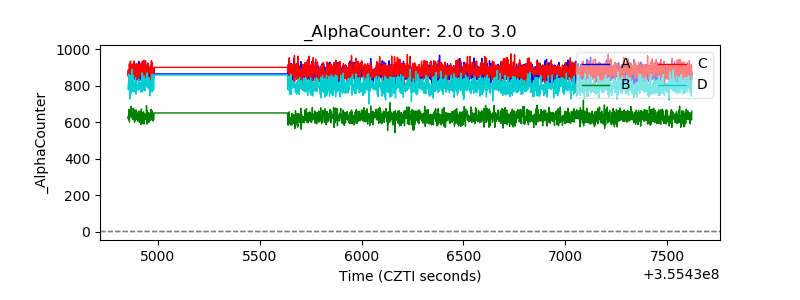 |
| _CPM_Rate | 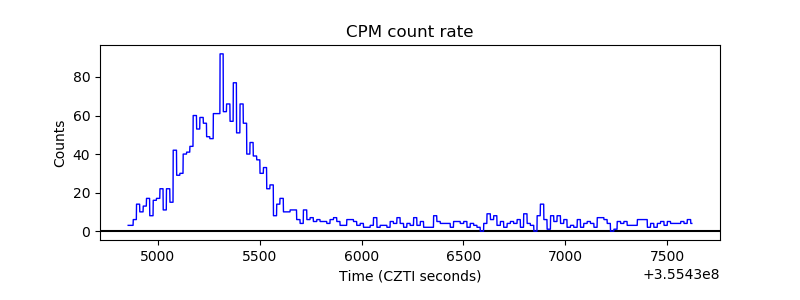 |
| CZT Counter | 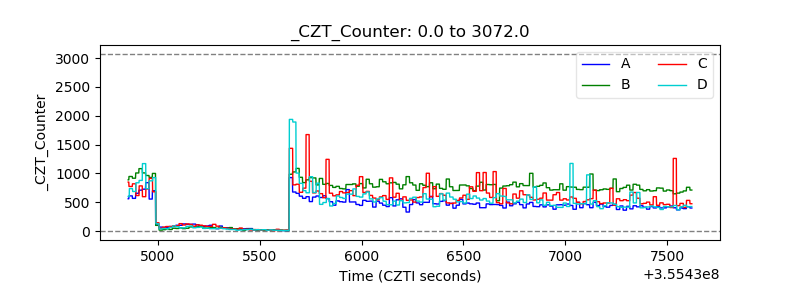 |
| +2.5 Volts monitor | 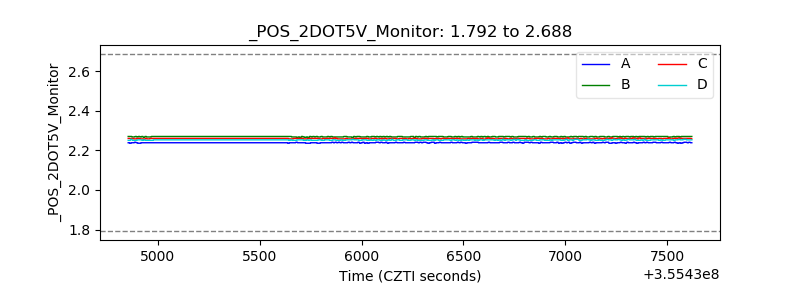 |
| +5 Volts monitor |  |
| _ROLL_ROT | 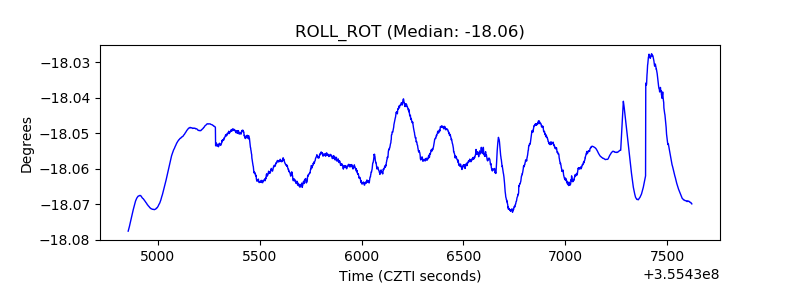 |
| _Roll_DEC | 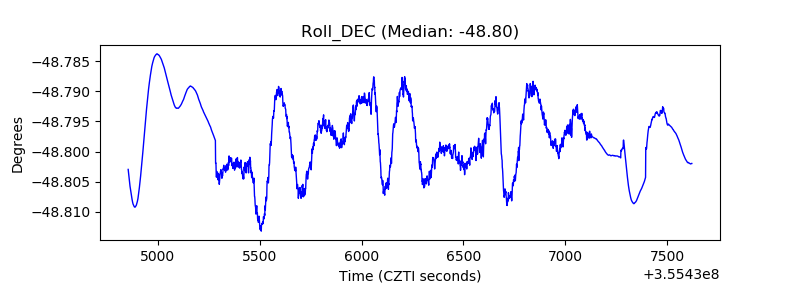 |
| _Roll_RA | 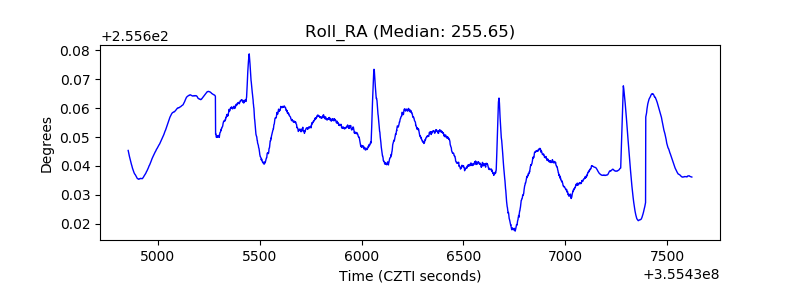 |
| Veto Counter | 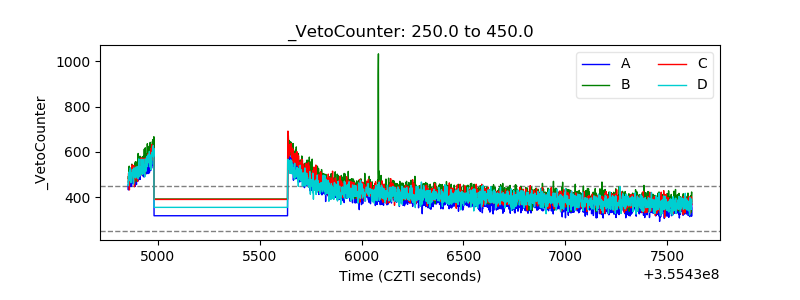 |