| Param | Original file | Final file |
|---|---|---|
| Filename | modeM0/AS1A10_083T01_9000004280cztM0_level2.fits | modeM0/AS1A10_083T01_9000004280cztM0_level2_quad_clean.evt |
| Size (bytes) | 147,951,360 | 140,451,840 |
| Size | 141.1 MB | 133.9 MB |
| Events in quadrant A | 920,724 | 843,932 |
| Events in quadrant B | 863,760 | 835,648 |
| Events in quadrant C | 871,848 | 776,727 |
| Events in quadrant D | 754,422 | 726,944 |
| Mode M0 | |||
|---|---|---|---|
| Quadrant | BADHDUFLAG | Total packets | Discarded packets |
| A | 0 | 31956 | 0 |
| B | 0 | 47024 | 0 |
| C | 0 | 39778 | 0 |
| D | 0 | 38254 | 0 |
| Mode SS | |||
|---|---|---|---|
| Quadrant | BADHDUFLAG | Total packets | Discarded packets |
| A | 0 | 316 | 0 |
| B | 0 | 316 | 0 |
| C | 0 | 316 | 0 |
| D | 0 | 316 | 0 |
| Mode M9 | |||
|---|---|---|---|
| Quadrant | BADHDUFLAG | Total packets | Discarded packets |
| A | 0 | 7 | 0 |
| B | 0 | 7 | 0 |
| C | 0 | 7 | 0 |
| D | 0 | 7 | 0 |
| Quadrant | Total seconds | Saturated seconds | Saturation percentage |
|---|---|---|---|
| A | 15505 | 146 | 0.941632% |
| B | 15505 | 426 | 2.747501% |
| C | 15505 | 500 | 3.224766% |
| D | 15505 | 744 | 4.798452% |
Noise dominated data is calculated using 1-second bins in cleaned event files. If a bin has >2000 counts, and if more than 50% of those come from <1% of pixels, then it is considered to be noise-dominated and hence unusable.
| Quadrant | # 1 sec bins | Bins with >0 counts | Bins with >2000 counts | High rate bins dominated by noise | Noise dominated (total time) | Noise dominated (detector-on time) | Marked lightcurve |
|---|---|---|---|---|---|---|---|
| A | 20266 | 15507 | 0 | 0 | 0.00% | 0.00% | 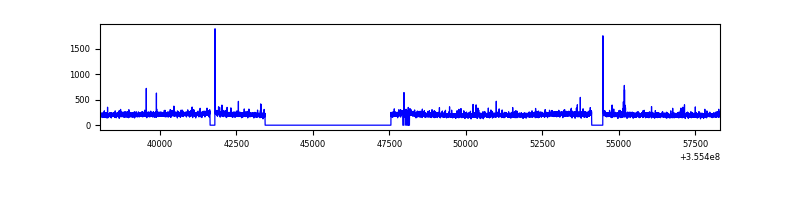 |
| B | 20266 | 15506 | 0 | 0 | 0.00% | 0.00% | 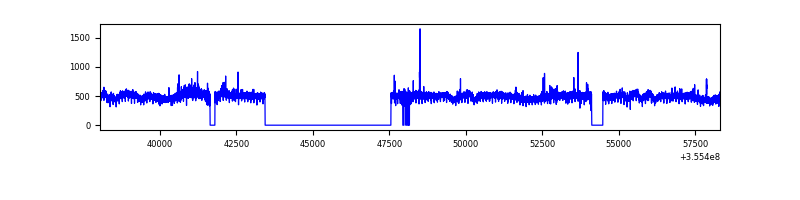 |
| C | 20266 | 15506 | 0 | 0 | 0.00% | 0.00% | 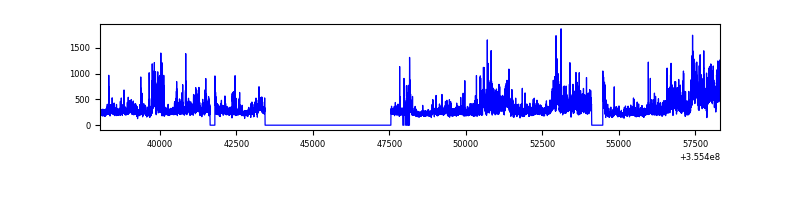 |
| D | 20266 | 15393 | 0 | 0 | 0.00% | 0.00% | 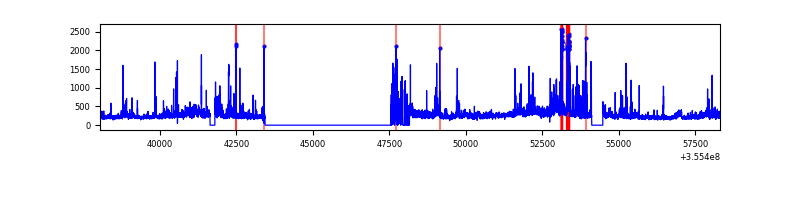 |
Top three noisy pixels from each quadrant. If the there are fewer than three noisy pixels in the level2.evt file, extra rows are filled as -1
| Pixel properties | Quadrant properties | ||||||
|---|---|---|---|---|---|---|---|
| Quadrant | DetID | PixID | Counts | Sigma | Mean | Median | Sigma |
| A | 0 | 29 | 921 | 11.4 | 240 | 226 | 61.0 |
| A | 15 | 236 | 706 | 7.87 | 240 | 226 | 61.0 |
| A | 0 | 30 | 705 | 7.85 | 240 | 226 | 61.0 |
| B | 2 | 9 | 708 | 10.56 | 228 | 218 | 46.4 |
| B | 5 | 128 | 609 | 8.43 | 228 | 218 | 46.4 |
| B | 2 | 8 | 593 | 8.09 | 228 | 218 | 46.4 |
| C | 1 | 81 | 685 | 7.96 | 230 | 215 | 59.0 |
| C | 1 | 80 | 659 | 7.52 | 230 | 215 | 59.0 |
| C | 12 | 241 | 625 | 6.95 | 230 | 215 | 59.0 |
| D | 10 | 189 | 563 | 6.23 | 215 | 195 | 59.0 |
| D | 15 | 46 | 536 | 5.78 | 215 | 195 | 59.0 |
| D | 12 | 6 | 527 | 5.62 | 215 | 195 | 59.0 |
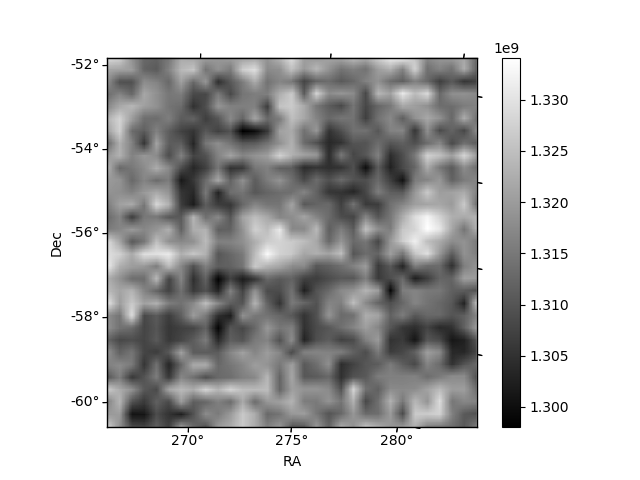
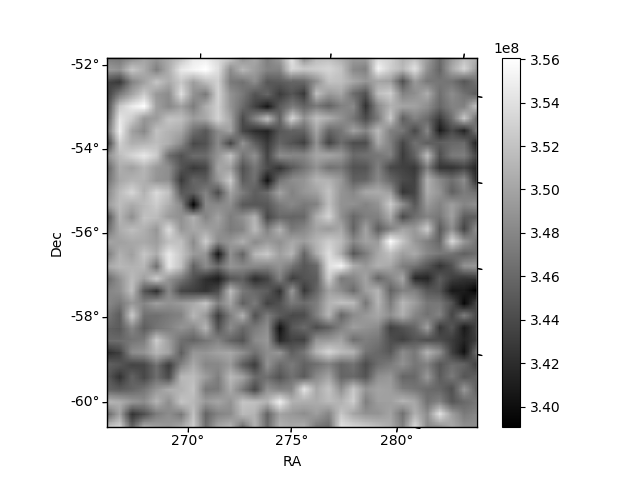
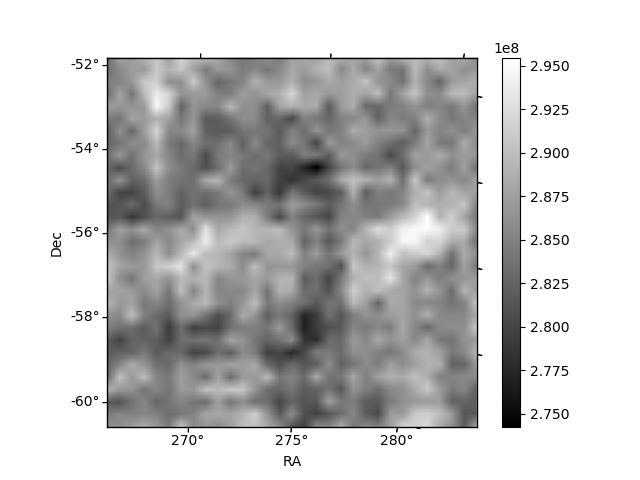
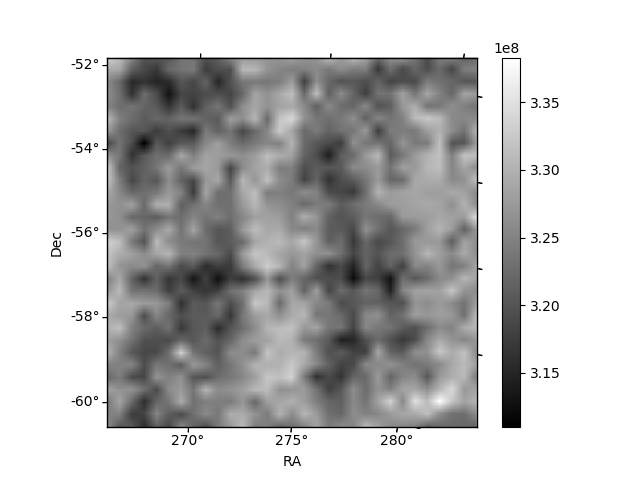
Histogram calculated using DETX and DETY for each event in the final _common_clean file
| Quadrant A | 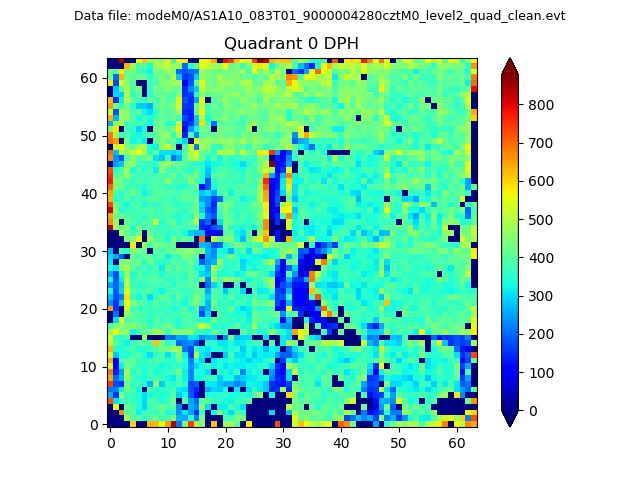 |
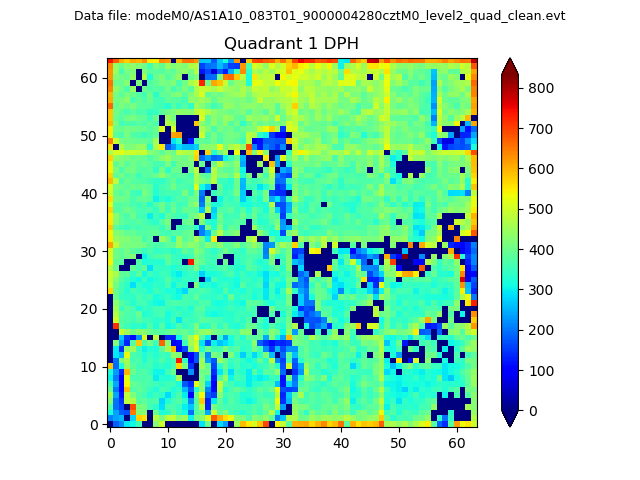 |
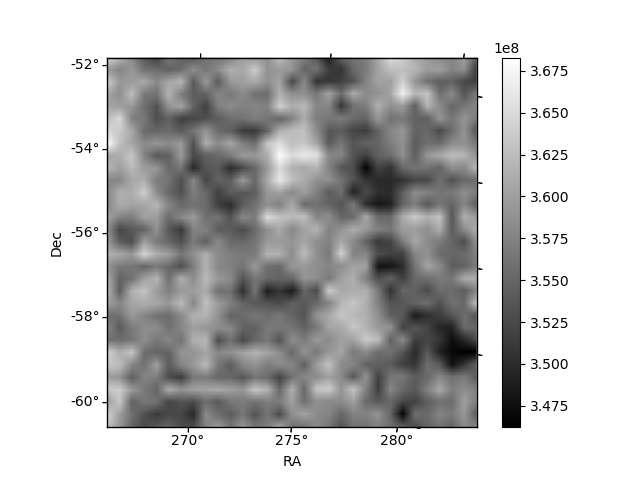
Quadrant B |
|---|---|---|---|
| Quadrant D | 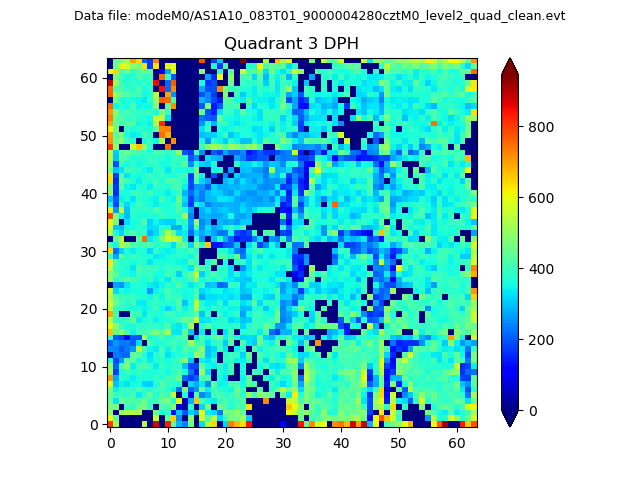 |
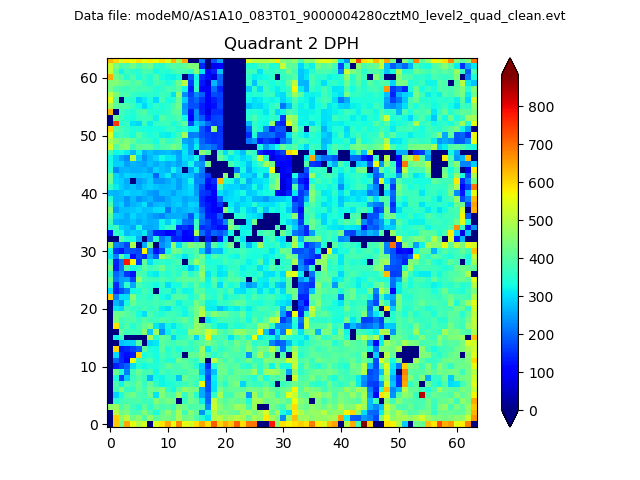 |
Quadrant C |
| Plot type | Count rate plots | Images |
|---|---|---|
| Comparison with Poisson distribution Blue bars denote a histogram of data divided into 1 sec bins. Red curve is a Poisson curve with rate = median count rate of data. |
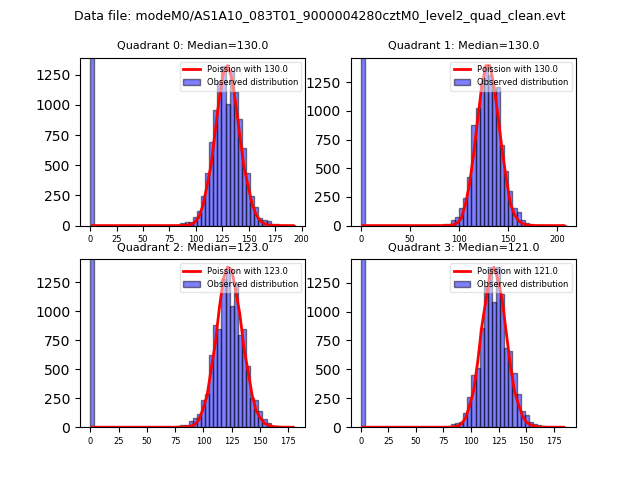 |
 |
| Quadrant-wise count rates Data is divided into 100 sec bins |
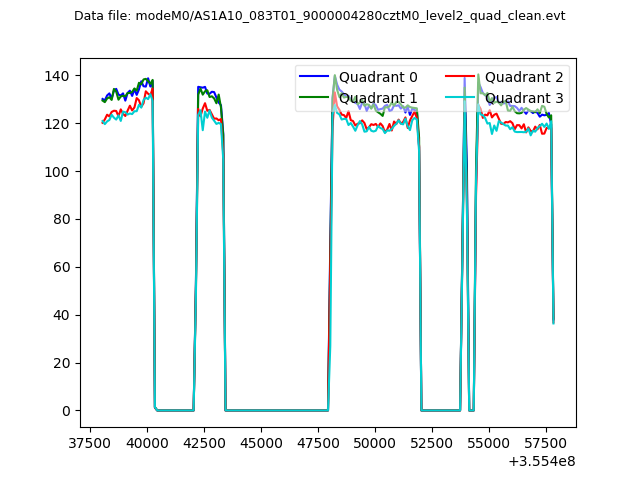 |
|
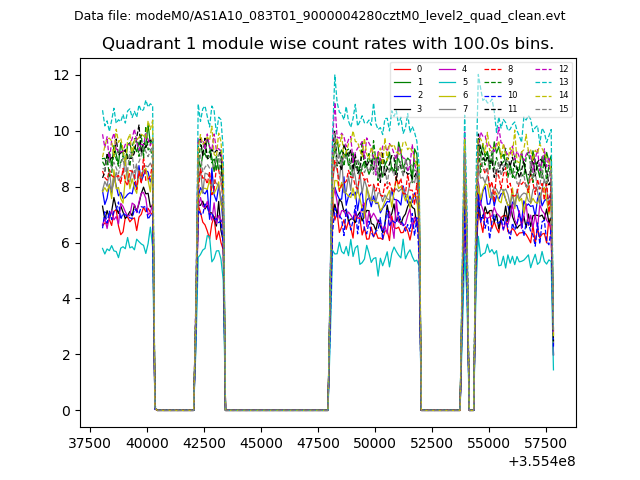
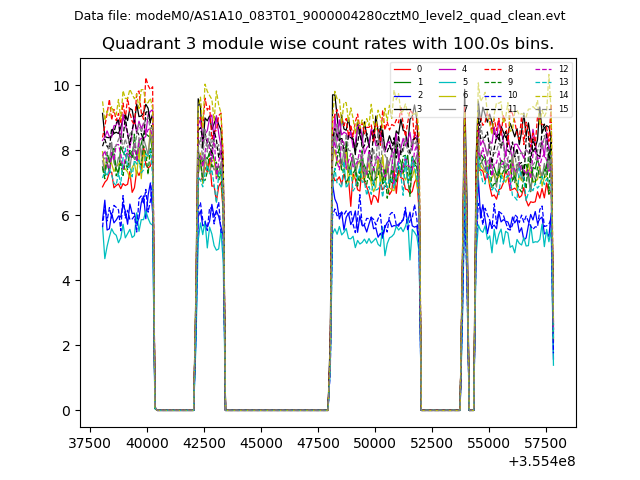
| Module-wise count rates for Quadrant A Data is divided into 100 sec bins |
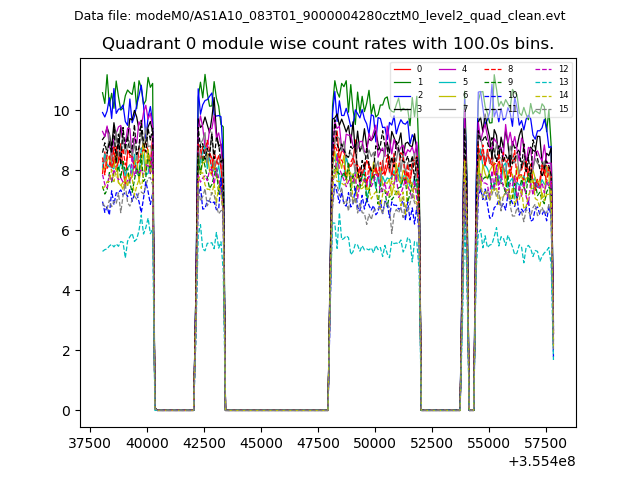 |
 |
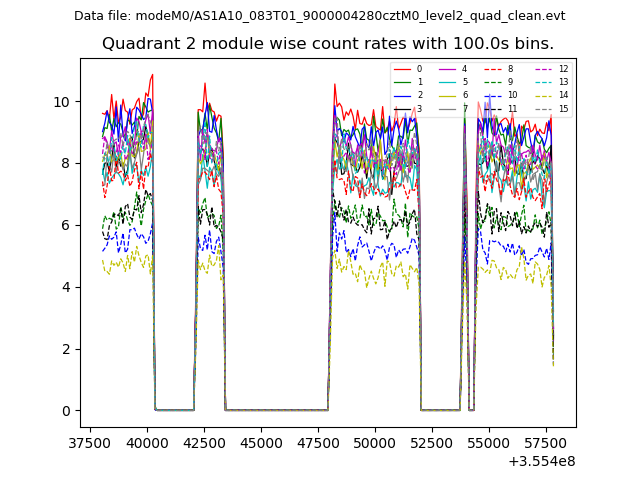
| Module-wise count rates for Quadrant B Data is divided into 100 sec bins |
 |
 |
| Module-wise count rates for Quadrant C Data is divided into 100 sec bins |
 |
 |
| Module-wise count rates for Quadrant D Data is divided into 100 sec bins |
 |
 |
| Parameter | Plot |
|---|---|
| CZT HV Monitor | 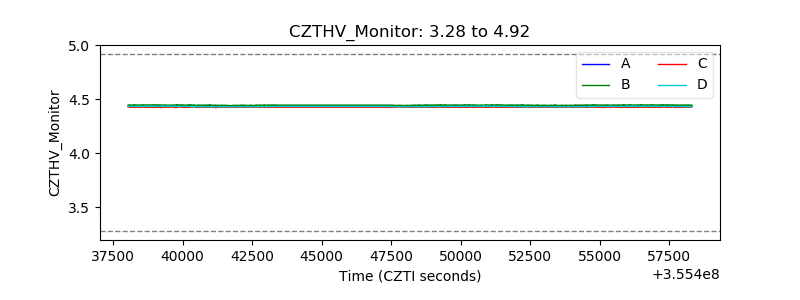 |
| D_VDD | 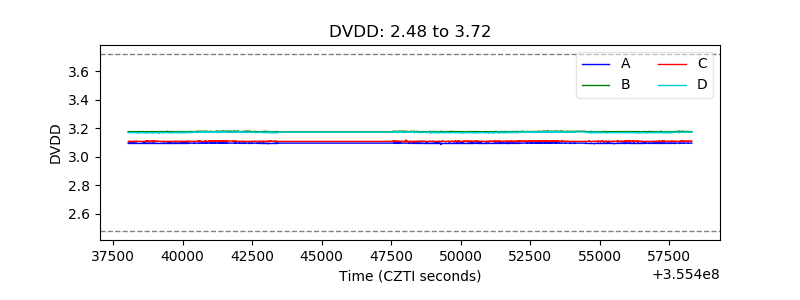 |
| Temperature 1 | 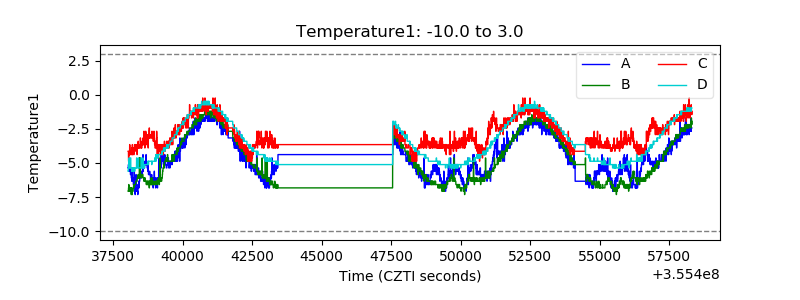 |
| Veto HV Monitor | 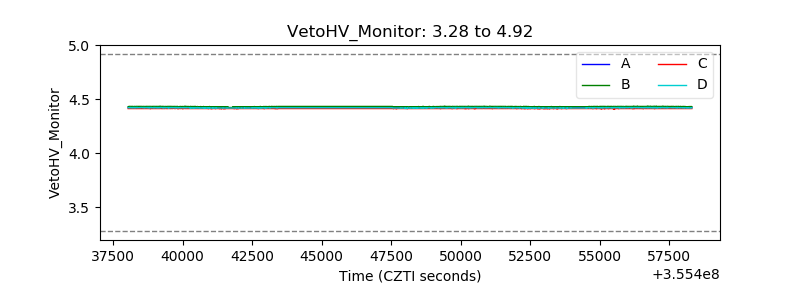 |
| Veto LLD | 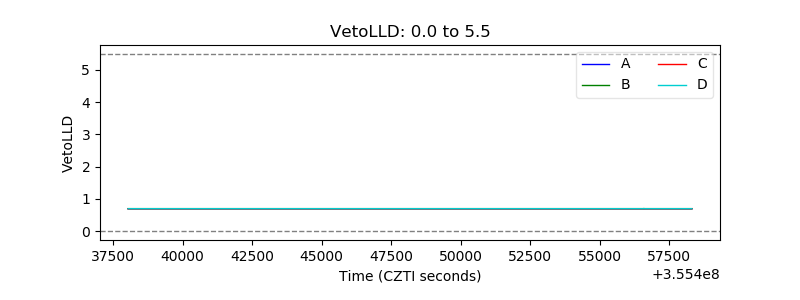 |
| Alpha Counter | 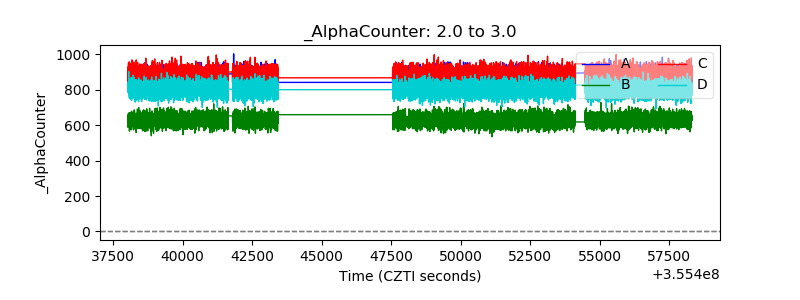 |
| _CPM_Rate | 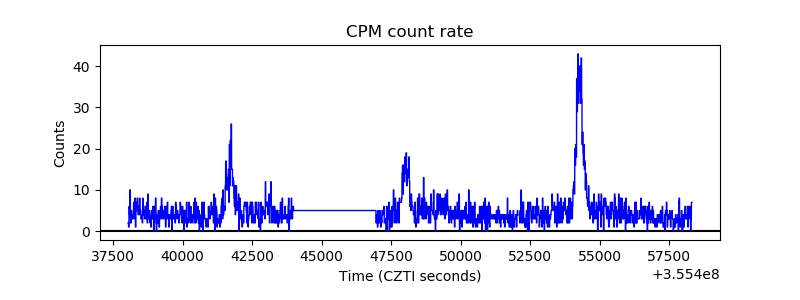 |
| CZT Counter | 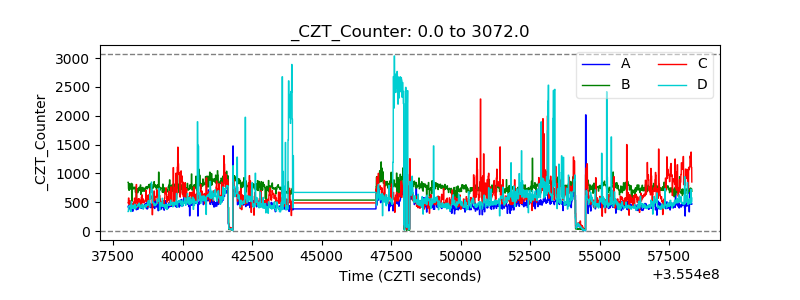 |
| +2.5 Volts monitor | 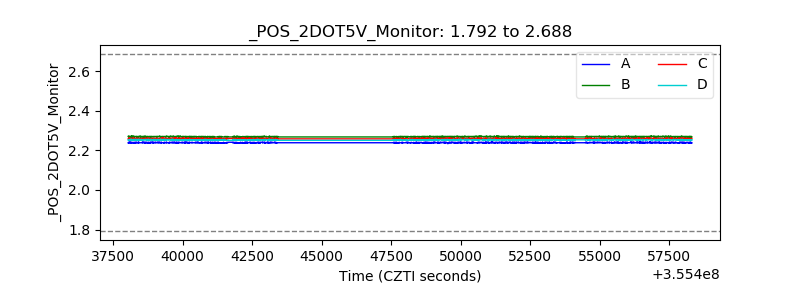 |
| +5 Volts monitor | 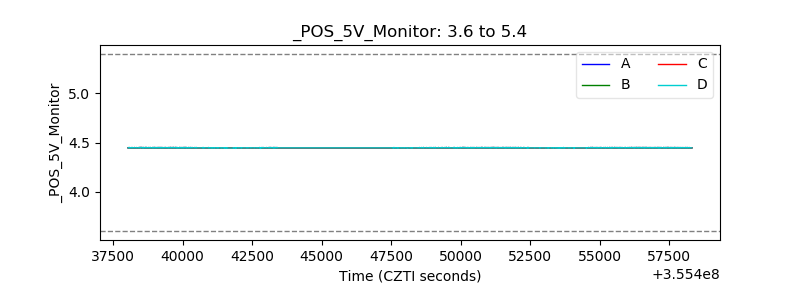 |
| _ROLL_ROT | 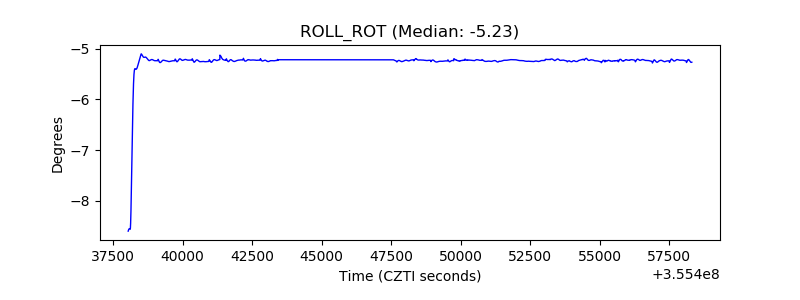 |
| _Roll_DEC | 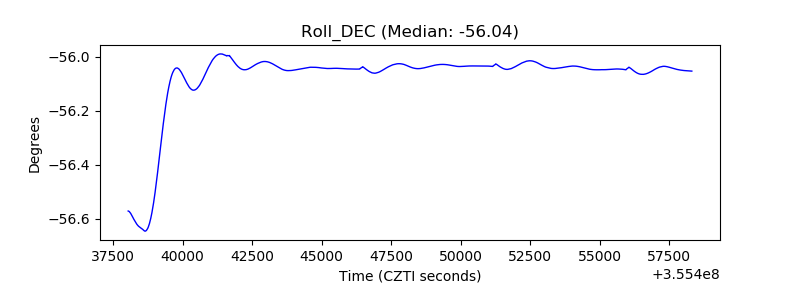 |
| _Roll_RA | 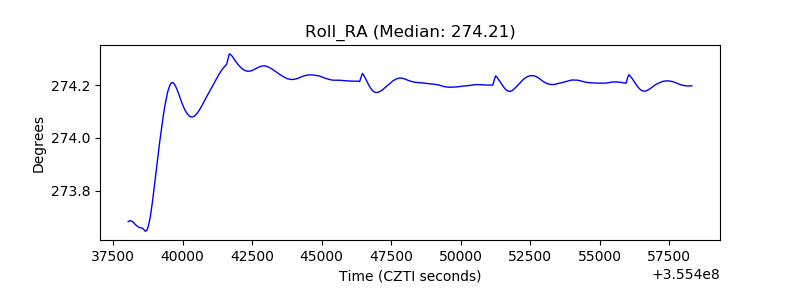 |
| Veto Counter | 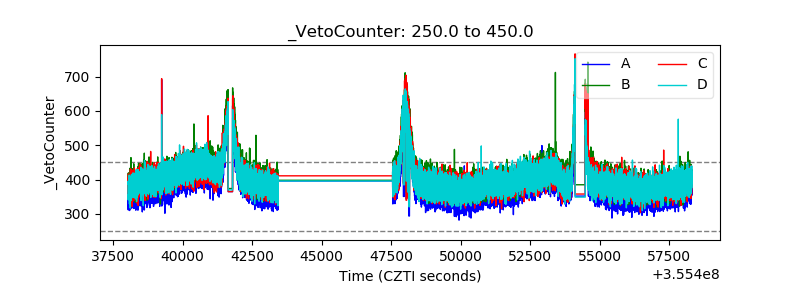 |