| Param | Original file | Final file |
|---|---|---|
| Filename | modeM0/AS1A10_083T01_9000004280_29870cztM0_level2.evt | modeM0/AS1A10_083T01_9000004280_29870cztM0_level2_quad_clean.evt |
| Size (bytes) | 884,085,120 | 147,473,280 |
| Size | 843.1 MB | 140.6 MB |
| Events in quadrant A | 4,804,809 | 968,696 |
| Events in quadrant B | 7,871,365 | 970,478 |
| Events in quadrant C | 6,764,667 | 912,142 |
| Events in quadrant D | 6,639,932 | 903,452 |
| Mode M0 | |||
|---|---|---|---|
| Quadrant | BADHDUFLAG | Total packets | Discarded packets |
| A | 0 | 21061 | 3 |
| B | 0 | 31046 | 3 |
| C | 0 | 26852 | 3 |
| D | 0 | 26373 | 3 |
| Mode SS | |||
|---|---|---|---|
| Quadrant | BADHDUFLAG | Total packets | Discarded packets |
| A | 0 | 210 | 0 |
| B | 0 | 210 | 0 |
| C | 0 | 210 | 0 |
| D | 0 | 210 | 0 |
| Mode M9 | |||
|---|---|---|---|
| Quadrant | BADHDUFLAG | Total packets | Discarded packets |
| A | 0 | 5 | 0 |
| B | 0 | 5 | 0 |
| C | 0 | 5 | 0 |
| D | 0 | 5 | 0 |
| Quadrant | Total seconds | Saturated seconds | Saturation percentage |
|---|---|---|---|
| A | 10271 | 80 | 0.778892% |
| B | 10272 | 267 | 2.599299% |
| C | 10272 | 338 | 3.290498% |
| D | 10272 | 659 | 6.415498% |
Noise dominated data is calculated using 1-second bins in cleaned event files. If a bin has >2000 counts, and if more than 50% of those come from <1% of pixels, then it is considered to be noise-dominated and hence unusable.
| Quadrant | # 1 sec bins | Bins with >0 counts | Bins with >2000 counts | High rate bins dominated by noise | Noise dominated (total time) | Noise dominated (detector-on time) | Marked lightcurve |
|---|---|---|---|---|---|---|---|
| A | 10756 | 10276 | 4 | 4 | 0.04% | 0.04% | 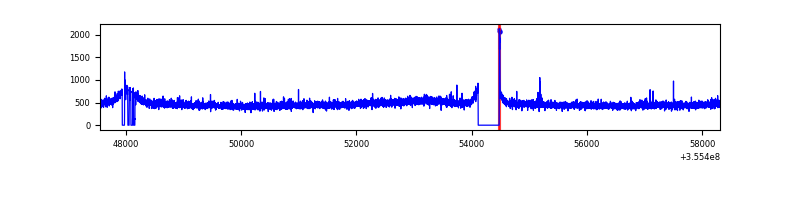 |
| B | 10757 | 10277 | 1 | 1 | 0.01% | 0.01% | 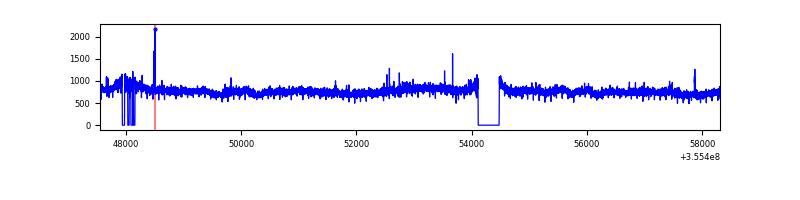 |
| C | 10757 | 10277 | 9 | 9 | 0.08% | 0.09% | 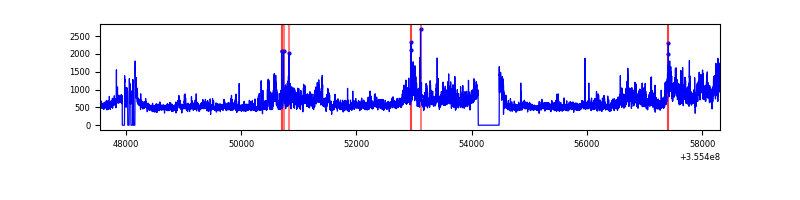 |
| D | 10757 | 10273 | 512 | 512 | 4.76% | 4.98% | 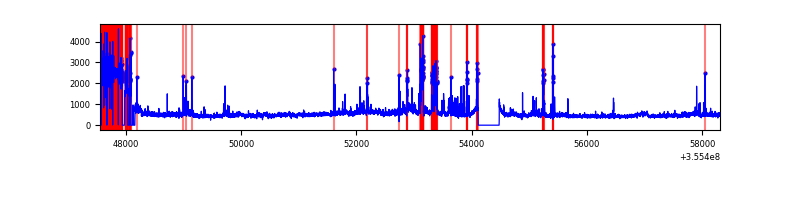 |
Top three noisy pixels from each quadrant. If the there are fewer than three noisy pixels in the level2.evt file, extra rows are filled as -1
| Pixel properties | Quadrant properties | ||||||
|---|---|---|---|---|---|---|---|
| Quadrant | DetID | PixID | Counts | Sigma | Mean | Median | Sigma |
| A | 8 | 192 | 23826 | 91.69 | 1238 | 1213 | 246.6 |
| A | 13 | 254 | 19113 | 72.58 | 1238 | 1213 | 246.6 |
| A | 3 | 137 | 12241 | 44.71 | 1238 | 1213 | 246.6 |
| B | 6 | 159 | 3019207 | 13084.91 | 1223 | 1192 | 230.6 |
| B | 12 | 111 | 28999 | 120.56 | 1223 | 1192 | 230.6 |
| B | 11 | 111 | 26303 | 108.87 | 1223 | 1192 | 230.6 |
| C | 3 | 233 | 1932865 | 6969.24 | 1184 | 1191 | 277.2 |
| C | 14 | 238 | 192074 | 688.68 | 1184 | 1191 | 277.2 |
| C | 2 | 114 | 24628 | 84.56 | 1184 | 1191 | 277.2 |
| D | 13 | 153 | 1098061 | 4116.25 | 1135 | 1106 | 266.5 |
| D | 13 | 104 | 403324 | 1509.3 | 1135 | 1106 | 266.5 |
| D | 8 | 195 | 356275 | 1332.75 | 1135 | 1106 | 266.5 |
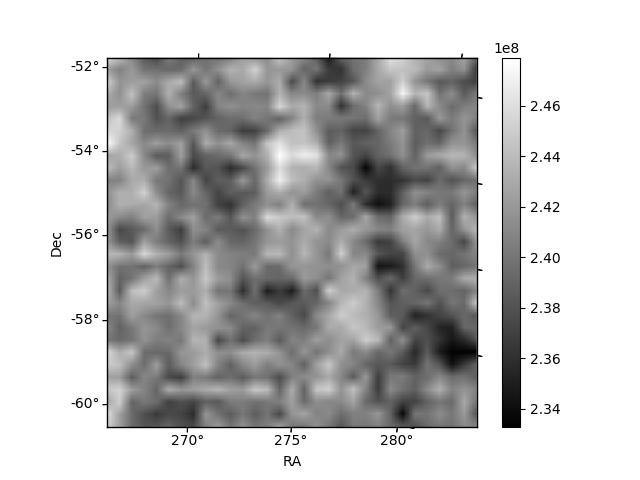
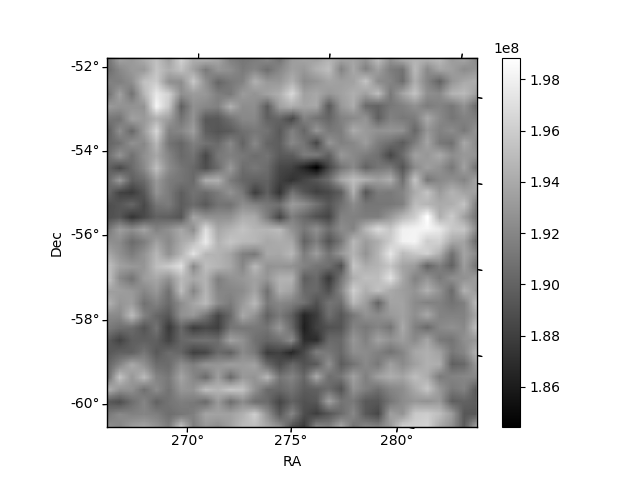
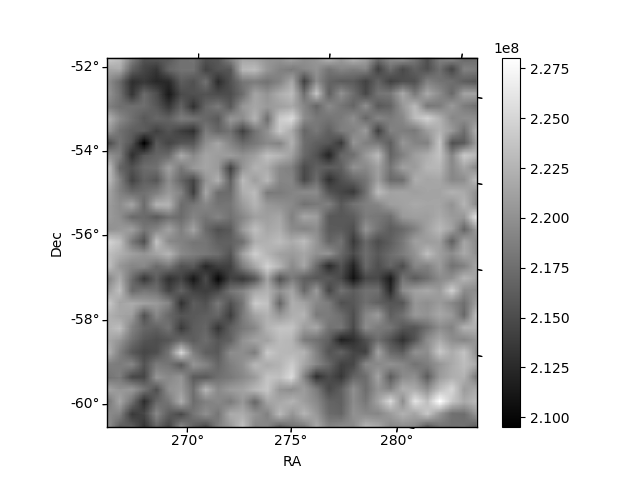
Histogram calculated using DETX and DETY for each event in the final _common_clean file
| Quadrant A |  |
 |
Quadrant B |
|---|---|---|---|
| Quadrant D |  |
 |
Quadrant C |
| Plot type | Count rate plots | Images |
|---|---|---|
| Comparison with Poisson distribution Blue bars denote a histogram of data divided into 1 sec bins. Red curve is a Poisson curve with rate = median count rate of data. |
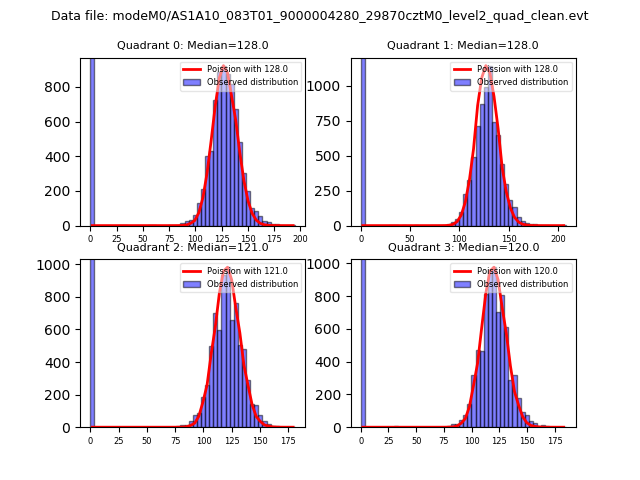 |
 |
| Quadrant-wise count rates Data is divided into 100 sec bins |
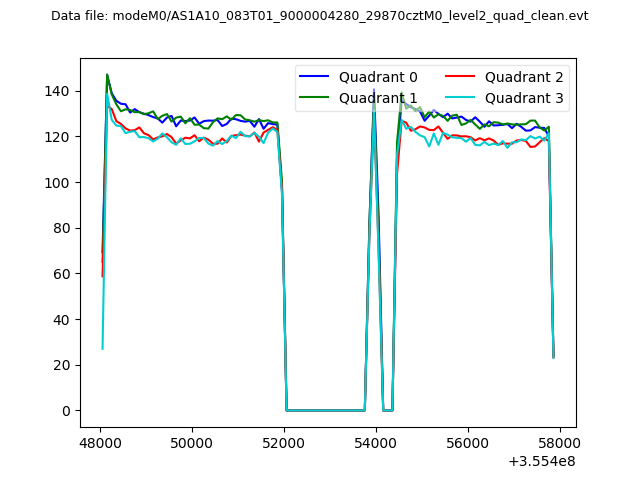 |
|
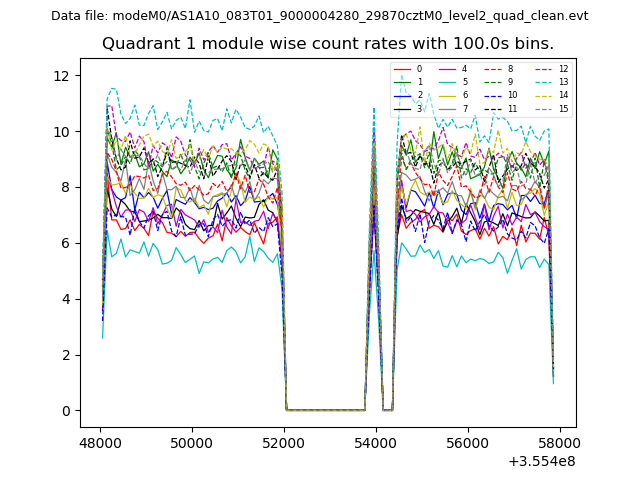
| Module-wise count rates for Quadrant A Data is divided into 100 sec bins |
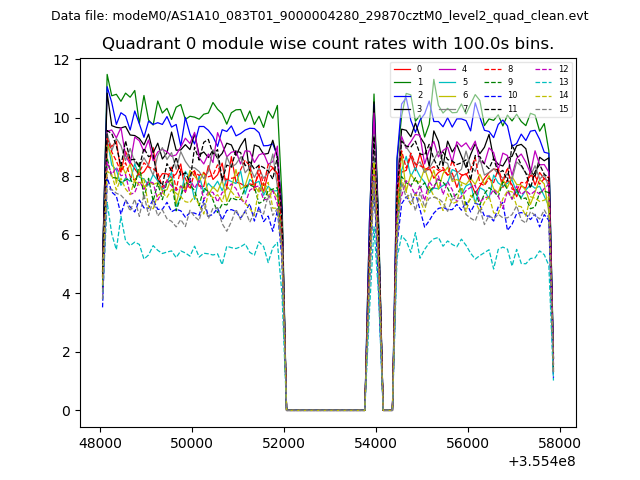 |
 |
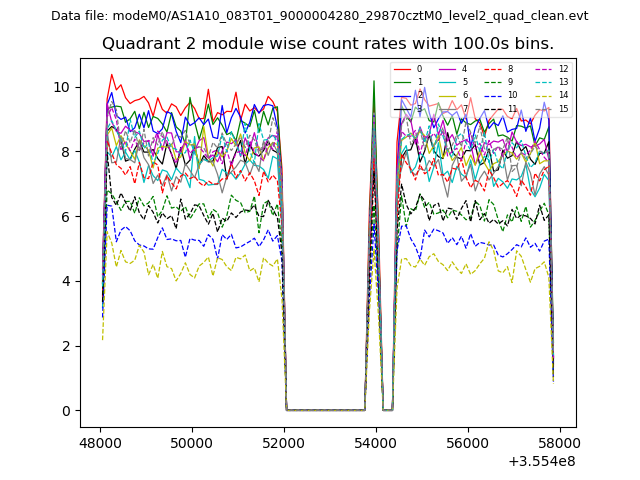
| Module-wise count rates for Quadrant B Data is divided into 100 sec bins |
 |
 |
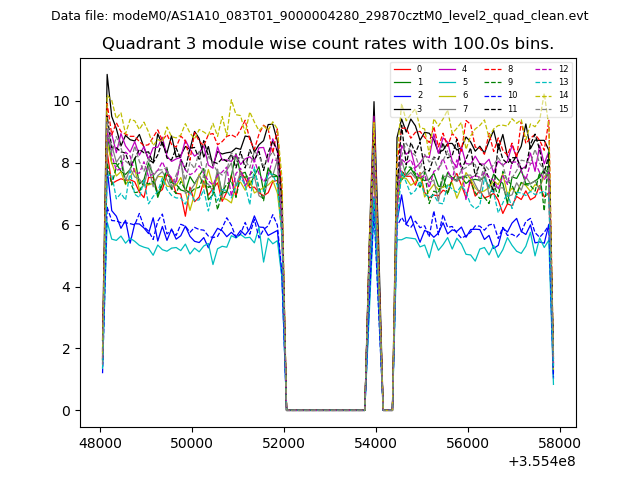
| Module-wise count rates for Quadrant C Data is divided into 100 sec bins |
 |
 |
| Module-wise count rates for Quadrant D Data is divided into 100 sec bins |
 |
 |
| Parameter | Plot |
|---|---|
| CZT HV Monitor | 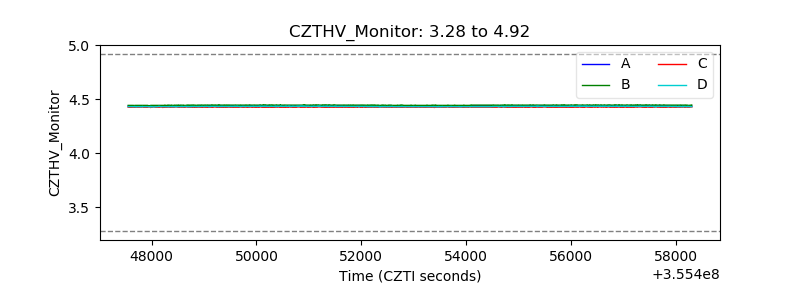 |
| D_VDD | 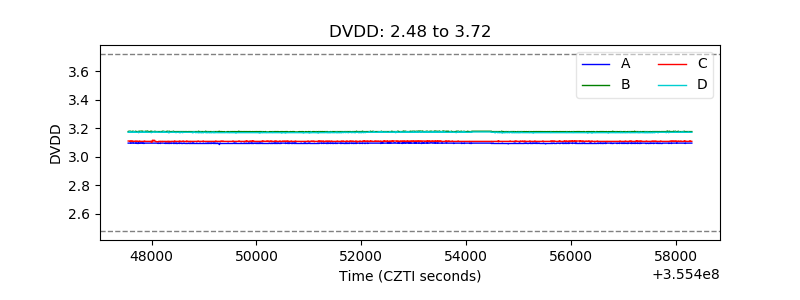 |
| Temperature 1 | 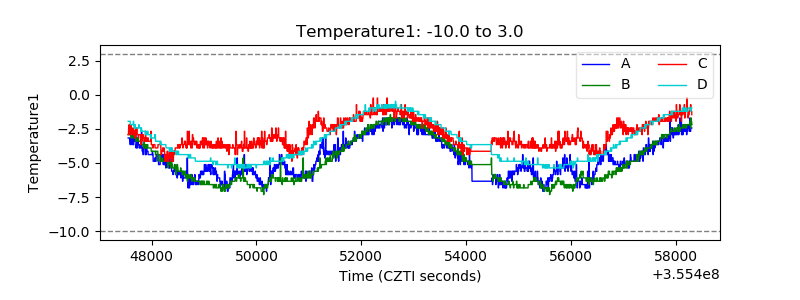 |
| Veto HV Monitor | 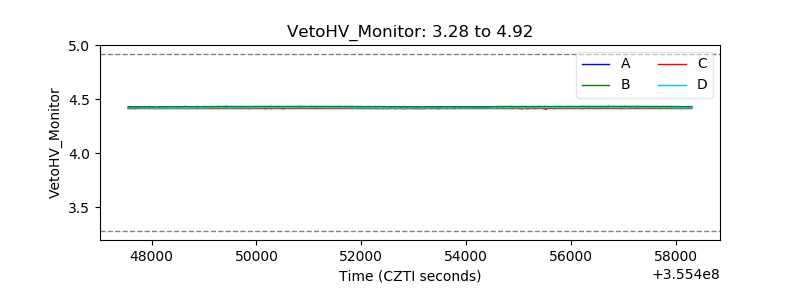 |
| Veto LLD | 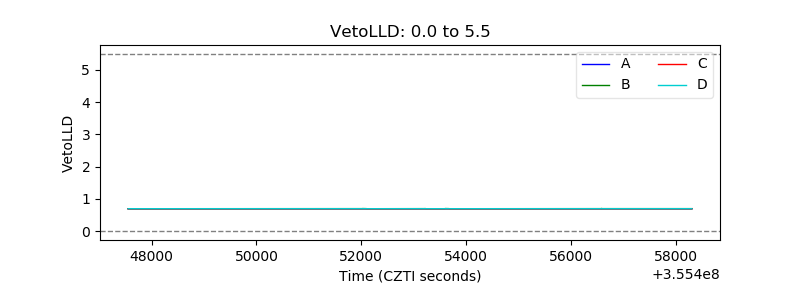 |
| Alpha Counter | 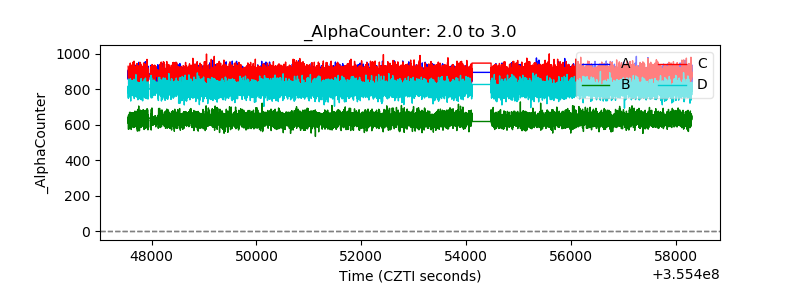 |
| _CPM_Rate | 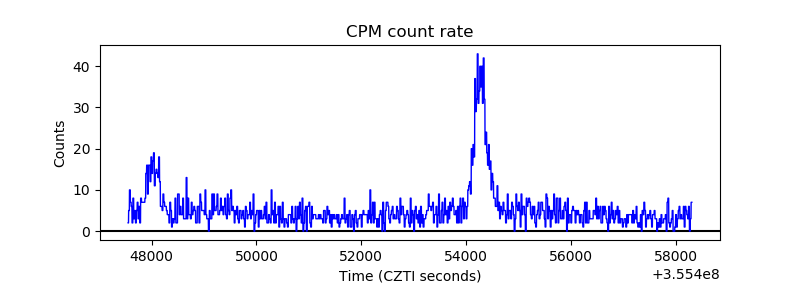 |
| CZT Counter |  |
| +2.5 Volts monitor |  |
| +5 Volts monitor | 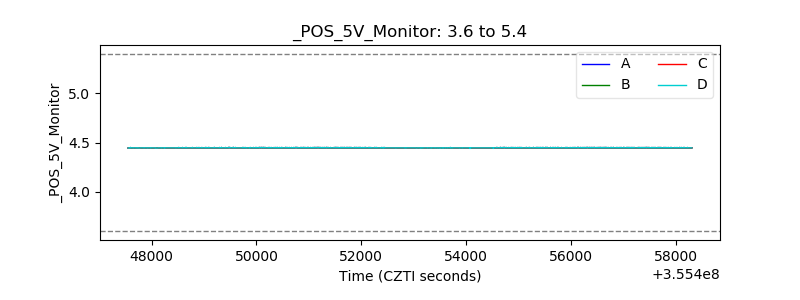 |
| _ROLL_ROT | 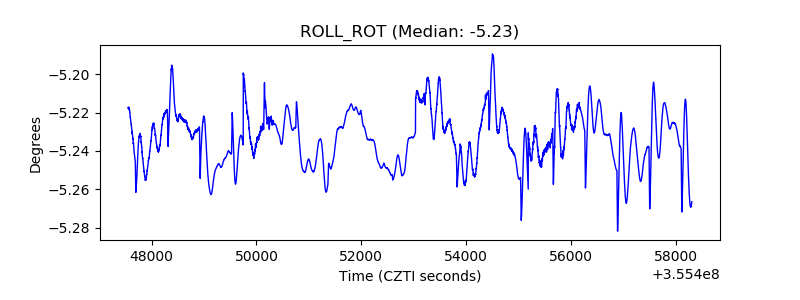 |
| _Roll_DEC |  |
| _Roll_RA |  |
| Veto Counter | 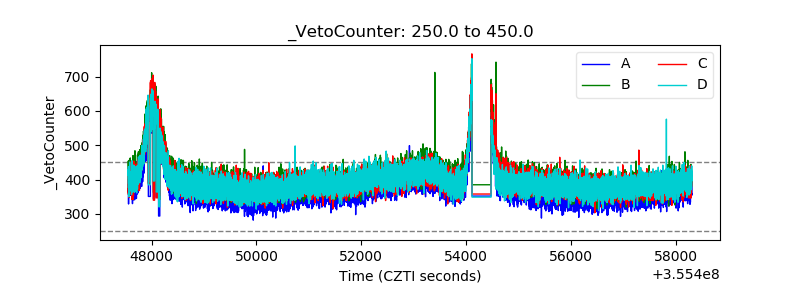 |