| Param | Original file | Final file |
|---|---|---|
| Filename | modeM0/AS1A10_102T10_9000004282_29870cztM0_level2.evt | modeM0/AS1A10_102T10_9000004282_29870cztM0_level2_quad_clean.evt |
| Size (bytes) | 626,207,040 | 94,919,040 |
| Size | 597.2 MB | 90.5 MB |
| Events in quadrant A | 3,461,963 | 610,711 |
| Events in quadrant B | 5,545,150 | 607,025 |
| Events in quadrant C | 5,488,469 | 575,378 |
| Events in quadrant D | 3,971,317 | 569,133 |
| Mode SS | |||
|---|---|---|---|
| Quadrant | BADHDUFLAG | Total packets | Discarded packets |
| A | 0 | 150 | 0 |
| B | 0 | 150 | 0 |
| C | 0 | 150 | 0 |
| D | 0 | 150 | 0 |
| Mode M9 | |||
|---|---|---|---|
| Quadrant | BADHDUFLAG | Total packets | Discarded packets |
| A | 0 | 14 | 0 |
| B | 0 | 14 | 0 |
| C | 0 | 14 | 0 |
| D | 0 | 14 | 0 |
| Mode M0 | |||
|---|---|---|---|
| Quadrant | BADHDUFLAG | Total packets | Discarded packets |
| A | 0 | 15003 | 3 |
| B | 0 | 22128 | 2 |
| C | 0 | 21557 | 2 |
| D | 0 | 16547 | 2 |
| Quadrant | Total seconds | Saturated seconds | Saturation percentage |
|---|---|---|---|
| A | 7363 | 69 | 0.937118% |
| B | 7363 | 126 | 1.711259% |
| C | 7363 | 250 | 3.395355% |
| D | 7363 | 127 | 1.724840% |
Noise dominated data is calculated using 1-second bins in cleaned event files. If a bin has >2000 counts, and if more than 50% of those come from <1% of pixels, then it is considered to be noise-dominated and hence unusable.
| Quadrant | # 1 sec bins | Bins with >0 counts | Bins with >2000 counts | High rate bins dominated by noise | Noise dominated (total time) | Noise dominated (detector-on time) | Marked lightcurve |
|---|---|---|---|---|---|---|---|
| A | 8688 | 7365 | 1 | 1 | 0.01% | 0.01% | 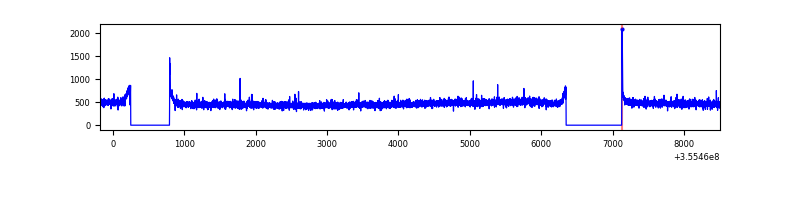 |
| B | 8688 | 7365 | 0 | 0 | 0.00% | 0.00% | 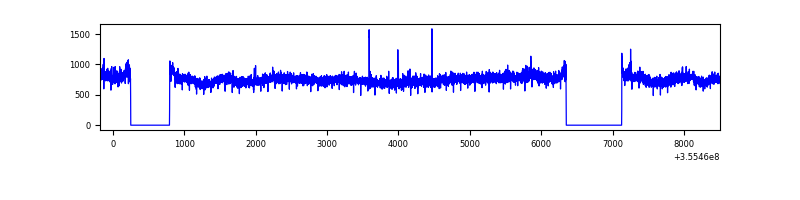 |
| C | 8688 | 7365 | 36 | 36 | 0.41% | 0.49% | 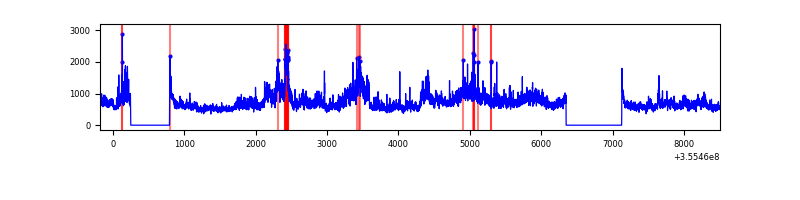 |
| D | 8688 | 7365 | 72 | 72 | 0.83% | 0.98% | 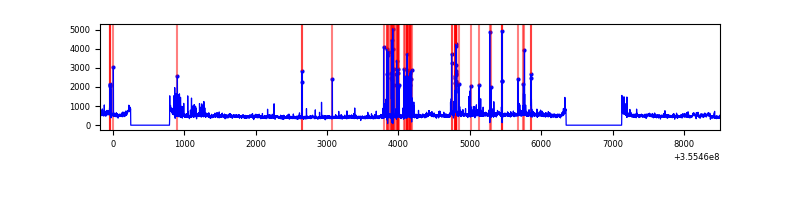 |
Top three noisy pixels from each quadrant. If the there are fewer than three noisy pixels in the level2.evt file, extra rows are filled as -1
| Pixel properties | Quadrant properties | ||||||
|---|---|---|---|---|---|---|---|
| Quadrant | DetID | PixID | Counts | Sigma | Mean | Median | Sigma |
| A | 8 | 192 | 19588 | 104.19 | 892 | 874 | 179.6 |
| A | 13 | 254 | 12017 | 62.04 | 892 | 874 | 179.6 |
| A | 3 | 137 | 9024 | 45.37 | 892 | 874 | 179.6 |
| B | 6 | 159 | 2046412 | 12039.98 | 883 | 860 | 169.9 |
| B | 12 | 111 | 21385 | 120.81 | 883 | 860 | 169.9 |
| B | 11 | 111 | 19604 | 110.33 | 883 | 860 | 169.9 |
| C | 3 | 233 | 1965430 | 9954.89 | 849 | 854 | 197.3 |
| C | 14 | 238 | 136576 | 687.73 | 849 | 854 | 197.3 |
| C | 10 | 22 | 53308 | 265.79 | 849 | 854 | 197.3 |
| D | 8 | 195 | 267005 | 1299.19 | 856 | 835 | 204.9 |
| D | 7 | 80 | 192673 | 936.37 | 856 | 835 | 204.9 |
| D | 13 | 104 | 110096 | 533.31 | 856 | 835 | 204.9 |
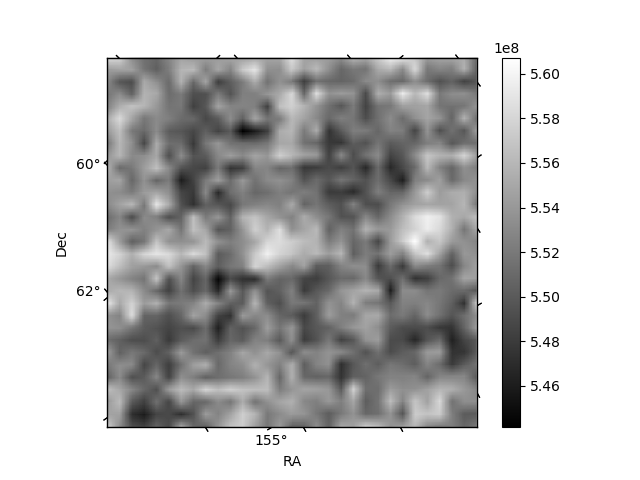
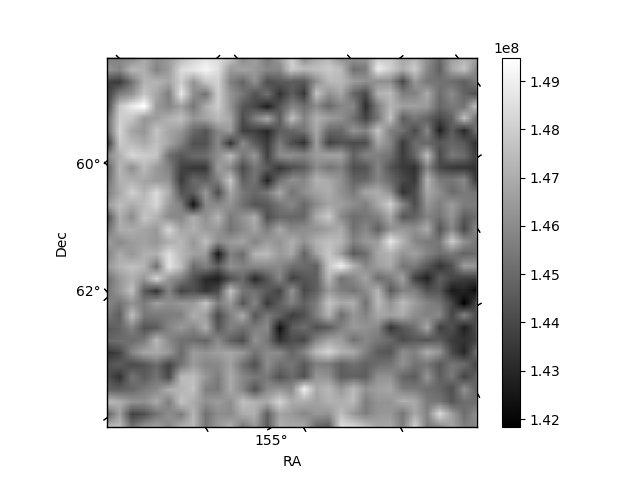
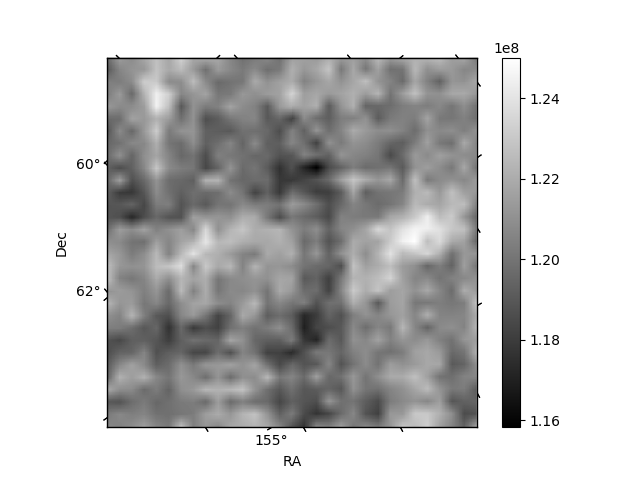
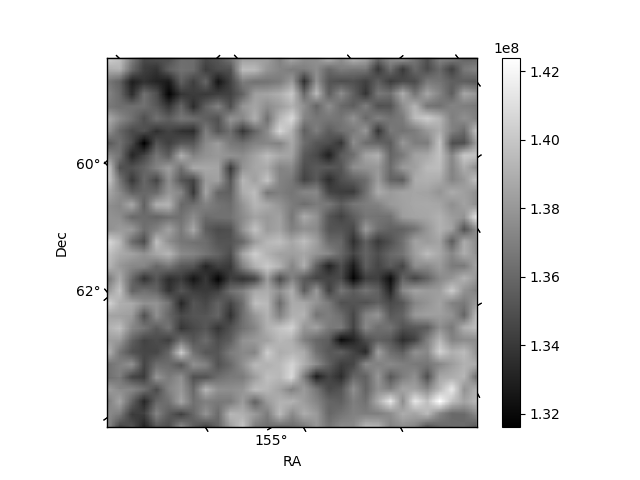
Histogram calculated using DETX and DETY for each event in the final _common_clean file
| Quadrant A | 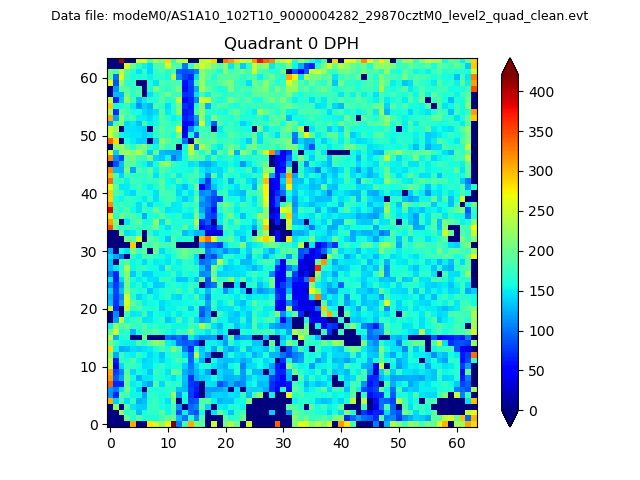 |
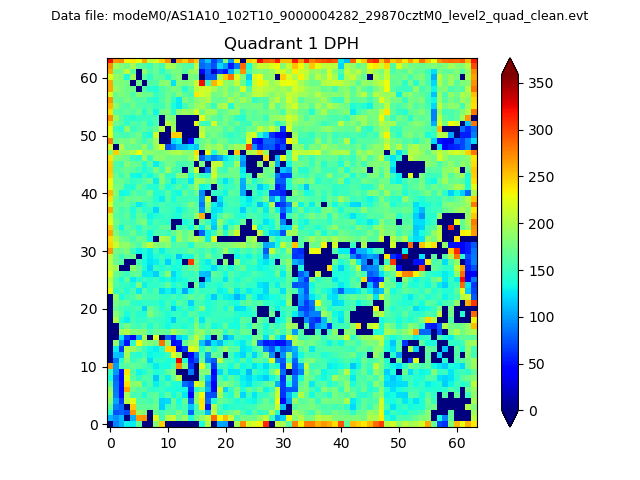 |
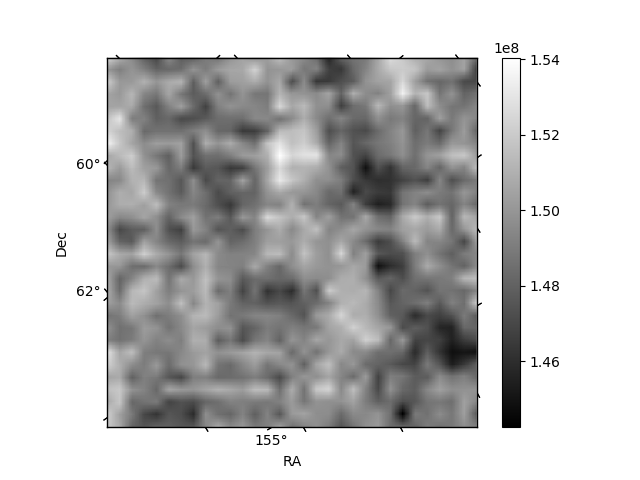
Quadrant B |
|---|---|---|---|
| Quadrant D | 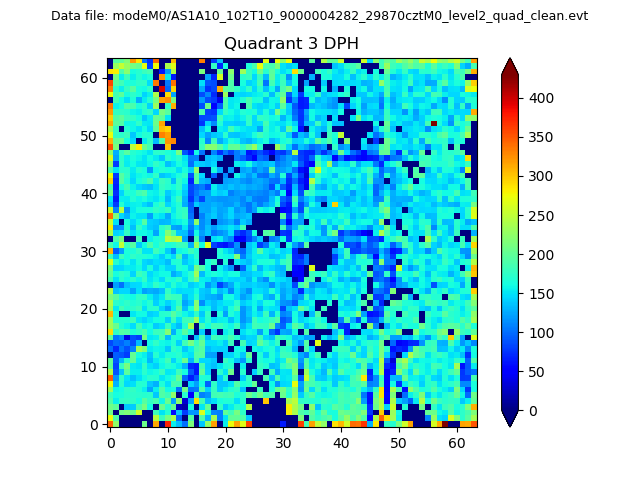 |
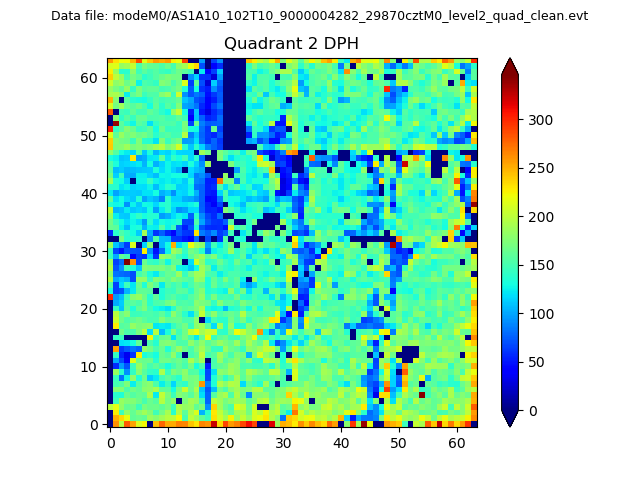 |
Quadrant C |
| Plot type | Count rate plots | Images |
|---|---|---|
| Comparison with Poisson distribution Blue bars denote a histogram of data divided into 1 sec bins. Red curve is a Poisson curve with rate = median count rate of data. |
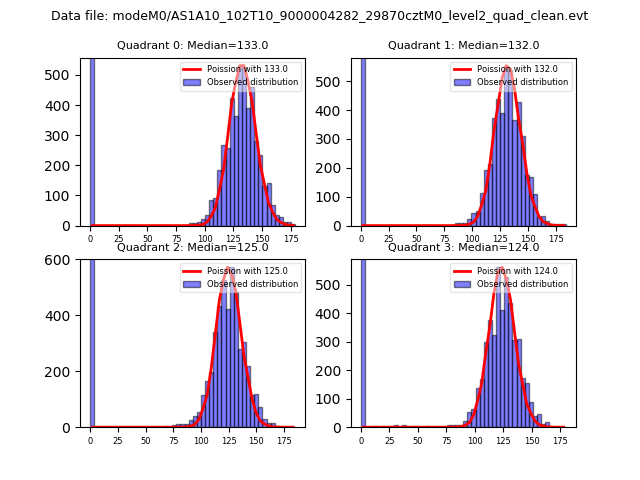 |
 |
| Quadrant-wise count rates Data is divided into 100 sec bins |
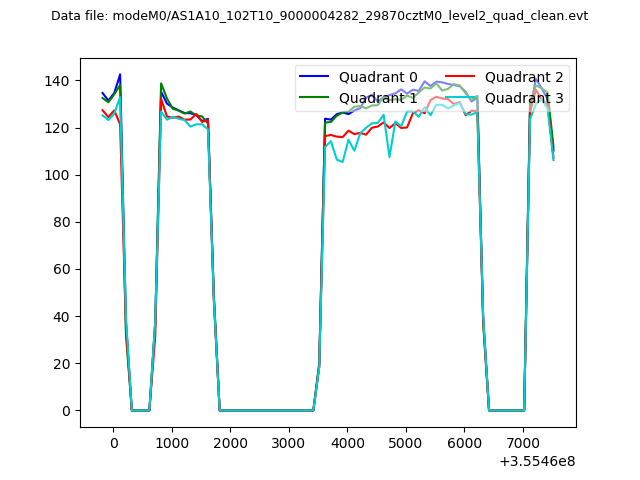 |
|
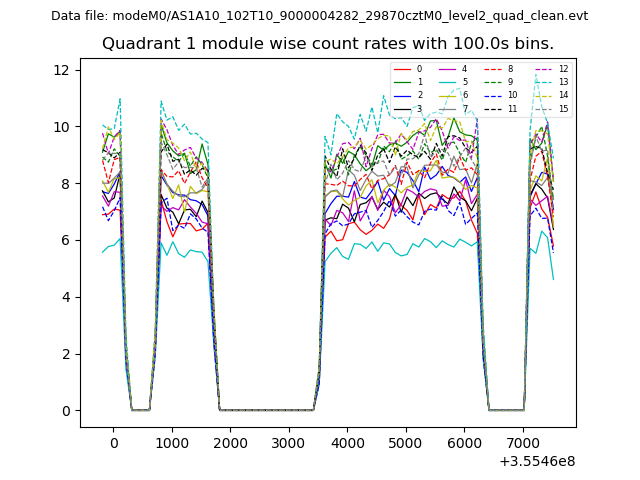
| Module-wise count rates for Quadrant A Data is divided into 100 sec bins |
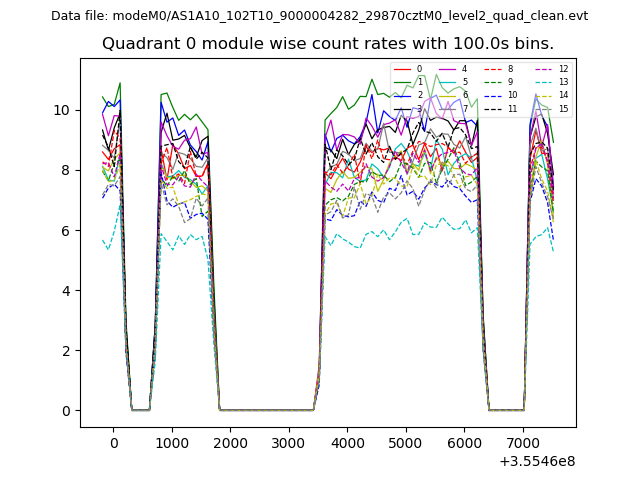 |
 |
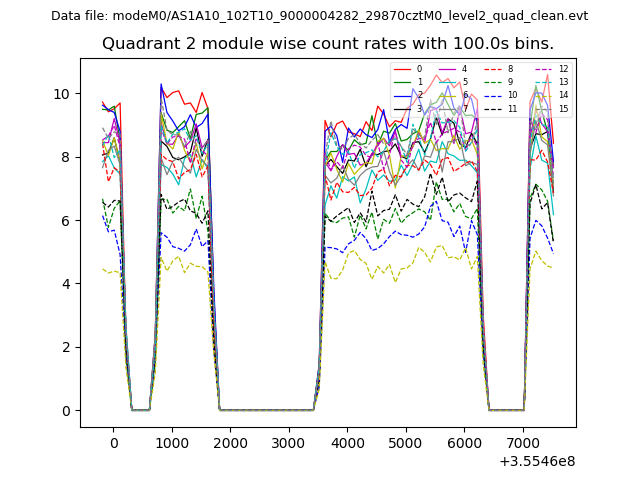
| Module-wise count rates for Quadrant B Data is divided into 100 sec bins |
 |
 |
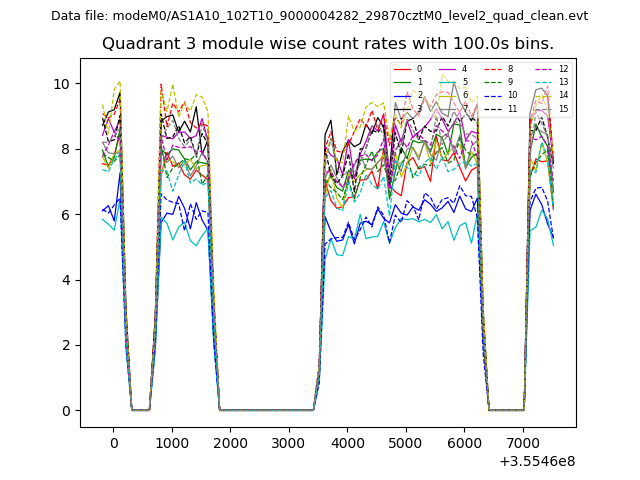
| Module-wise count rates for Quadrant C Data is divided into 100 sec bins |
 |
 |
| Module-wise count rates for Quadrant D Data is divided into 100 sec bins |
 |
 |
| Parameter | Plot |
|---|---|
| CZT HV Monitor |  |
| D_VDD | 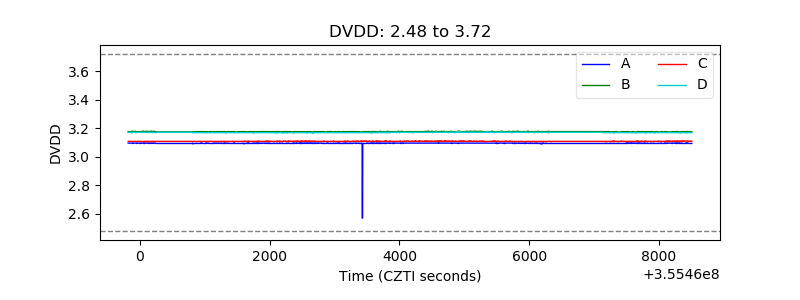 |
| Temperature 1 | 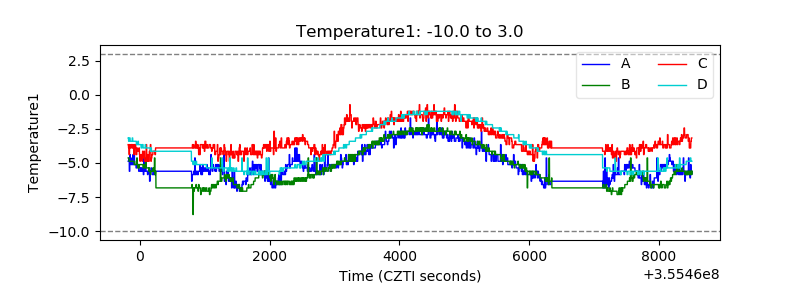 |
| Veto HV Monitor | 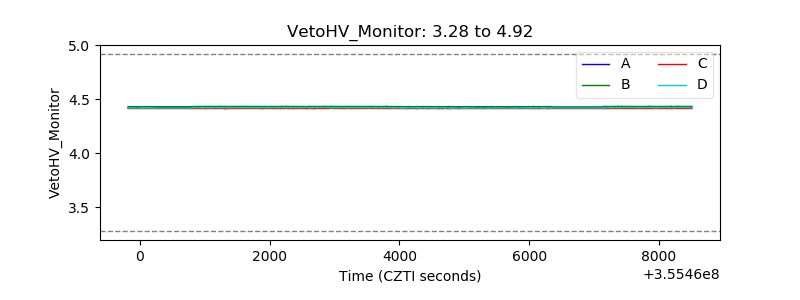 |
| Veto LLD | 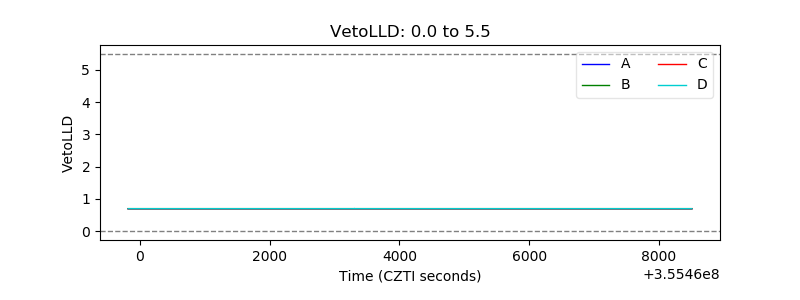 |
| Alpha Counter | 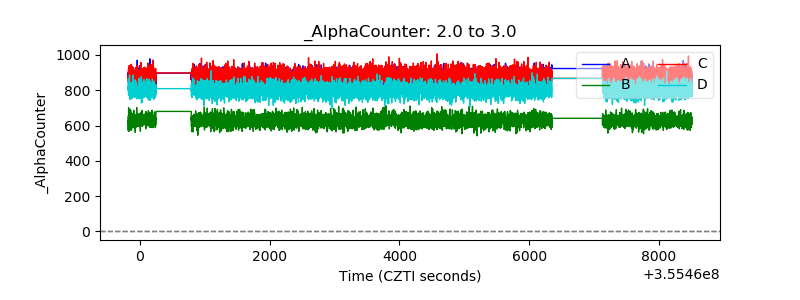 |
| _CPM_Rate | 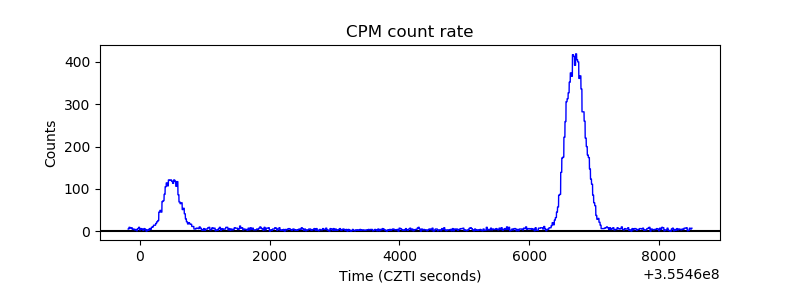 |
| CZT Counter | 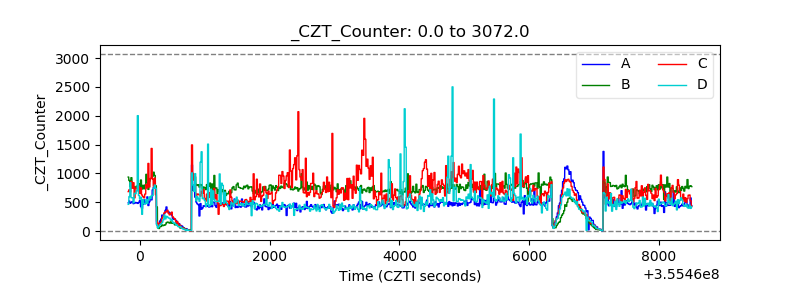 |
| +2.5 Volts monitor |  |
| +5 Volts monitor | 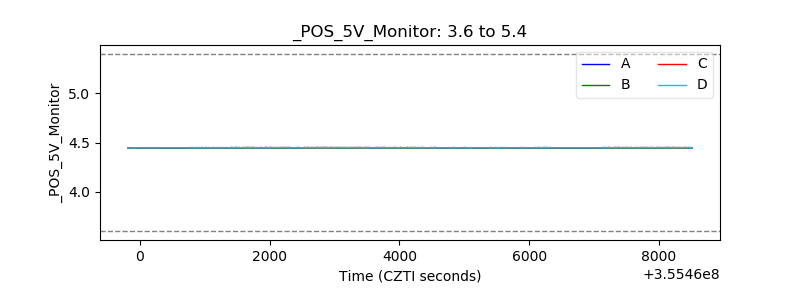 |
| _ROLL_ROT | 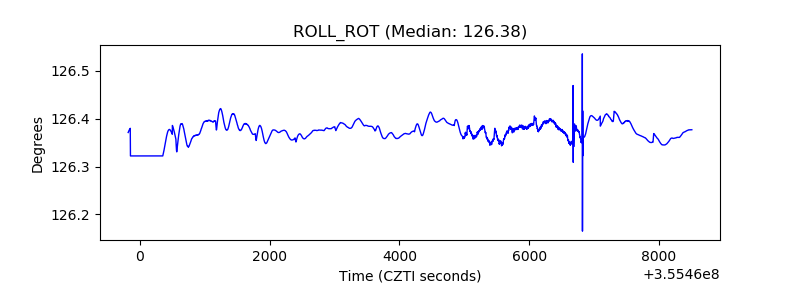 |
| _Roll_DEC | 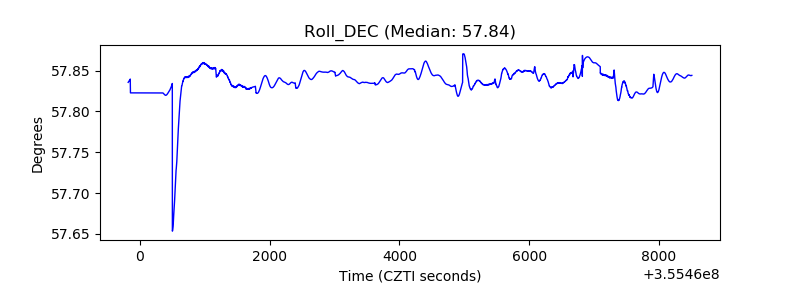 |
| _Roll_RA | 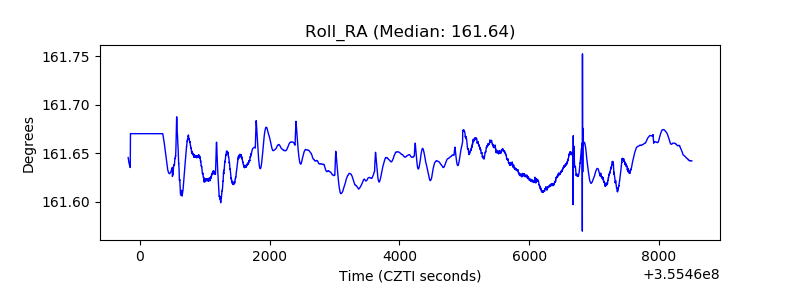 |
| Veto Counter | 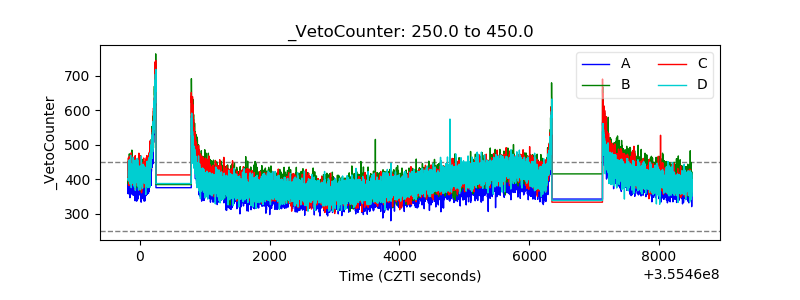 |