| Param | Original file | Final file |
|---|---|---|
| Filename | modeM0/AS1A10_102T10_9000004282_29872cztM0_level2.evt | modeM0/AS1A10_102T10_9000004282_29872cztM0_level2_quad_clean.evt |
| Size (bytes) | 552,208,320 | 75,559,680 |
| Size | 526.6 MB | 72.1 MB |
| Events in quadrant A | 3,388,375 | 471,818 |
| Events in quadrant B | 5,320,666 | 466,030 |
| Events in quadrant C | 3,990,860 | 441,484 |
| Events in quadrant D | 3,565,771 | 437,138 |
| Mode SS | |||
|---|---|---|---|
| Quadrant | BADHDUFLAG | Total packets | Discarded packets |
| A | 0 | 138 | 0 |
| B | 0 | 138 | 0 |
| C | 0 | 138 | 0 |
| D | 0 | 138 | 0 |
| Mode M9 | |||
|---|---|---|---|
| Quadrant | BADHDUFLAG | Total packets | Discarded packets |
| A | 0 | 11 | 0 |
| B | 0 | 11 | 0 |
| C | 0 | 11 | 0 |
| D | 0 | 11 | 0 |
| Mode M0 | |||
|---|---|---|---|
| Quadrant | BADHDUFLAG | Total packets | Discarded packets |
| A | 0 | 14219 | 2 |
| B | 0 | 20481 | 2 |
| C | 0 | 16080 | 2 |
| D | 0 | 14650 | 2 |
| Quadrant | Total seconds | Saturated seconds | Saturation percentage |
|---|---|---|---|
| A | 6761 | 36 | 0.532466% |
| B | 6762 | 112 | 1.656315% |
| C | 6762 | 82 | 1.212659% |
| D | 6762 | 31 | 0.458444% |
Noise dominated data is calculated using 1-second bins in cleaned event files. If a bin has >2000 counts, and if more than 50% of those come from <1% of pixels, then it is considered to be noise-dominated and hence unusable.
| Quadrant | # 1 sec bins | Bins with >0 counts | Bins with >2000 counts | High rate bins dominated by noise | Noise dominated (total time) | Noise dominated (detector-on time) | Marked lightcurve |
|---|---|---|---|---|---|---|---|
| A | 7871 | 6762 | 1 | 1 | 0.01% | 0.01% | 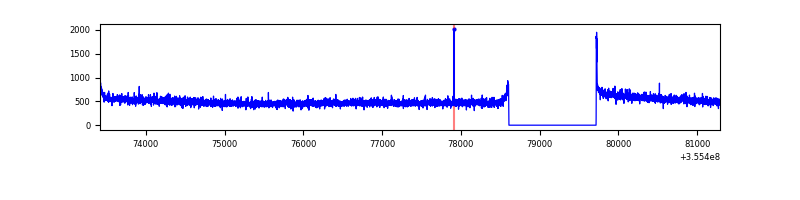 |
| B | 7872 | 6763 | 0 | 0 | 0.00% | 0.00% | 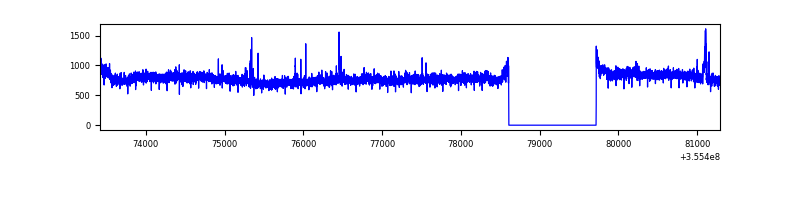 |
| C | 7872 | 6763 | 0 | 0 | 0.00% | 0.00% |  |
| D | 7872 | 6763 | 12 | 12 | 0.15% | 0.18% | 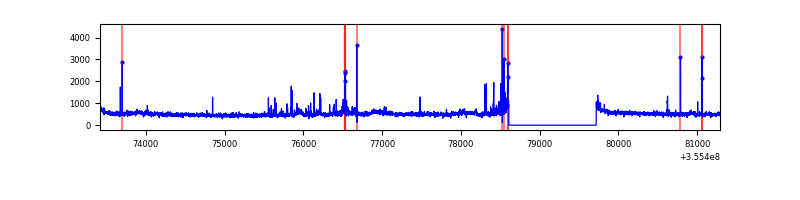 |
Top three noisy pixels from each quadrant. If the there are fewer than three noisy pixels in the level2.evt file, extra rows are filled as -1
| Pixel properties | Quadrant properties | ||||||
|---|---|---|---|---|---|---|---|
| Quadrant | DetID | PixID | Counts | Sigma | Mean | Median | Sigma |
| A | 8 | 192 | 11918 | 64.26 | 873 | 854 | 172.2 |
| A | 13 | 254 | 11910 | 64.21 | 873 | 854 | 172.2 |
| A | 3 | 137 | 8366 | 43.63 | 873 | 854 | 172.2 |
| B | 6 | 159 | 1882942 | 11427.08 | 860 | 838 | 164.7 |
| B | 0 | 190 | 50936 | 304.17 | 860 | 838 | 164.7 |
| B | 12 | 111 | 20008 | 116.39 | 860 | 838 | 164.7 |
| C | 3 | 233 | 643152 | 3375.37 | 819 | 823 | 190.3 |
| C | 14 | 238 | 134990 | 705.03 | 819 | 823 | 190.3 |
| C | 2 | 114 | 15737 | 78.37 | 819 | 823 | 190.3 |
| D | 8 | 195 | 249525 | 1276.72 | 831 | 810 | 194.8 |
| D | 2 | 250 | 81354 | 413.45 | 831 | 810 | 194.8 |
| D | 7 | 238 | 45093 | 227.32 | 831 | 810 | 194.8 |
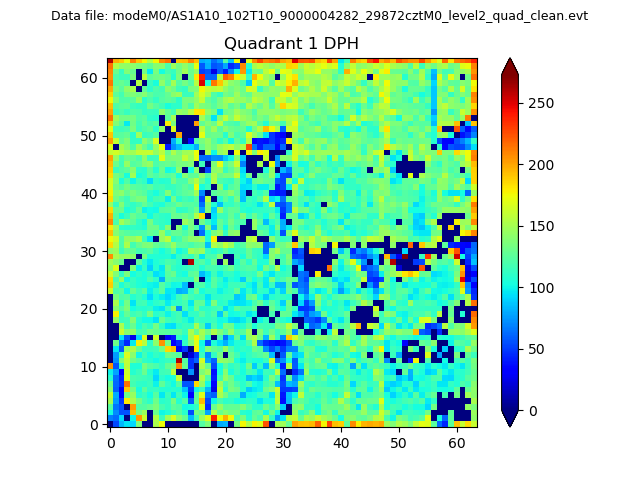
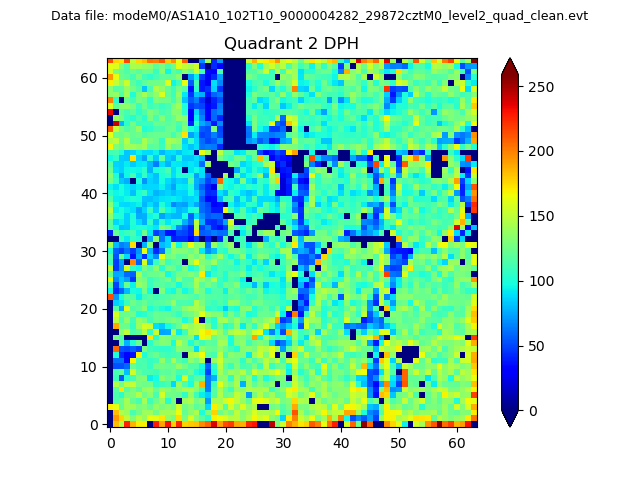
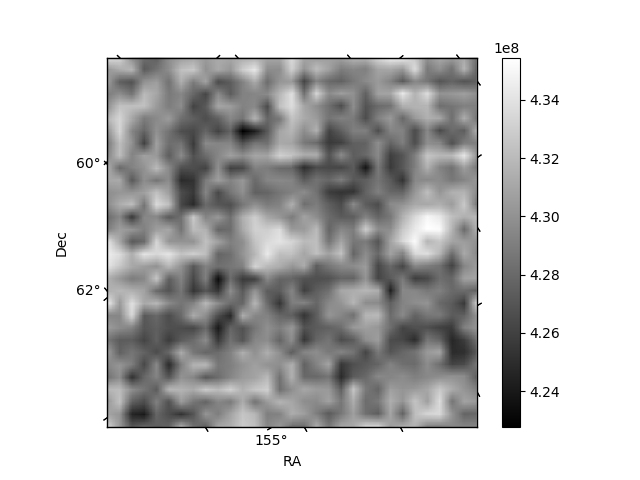
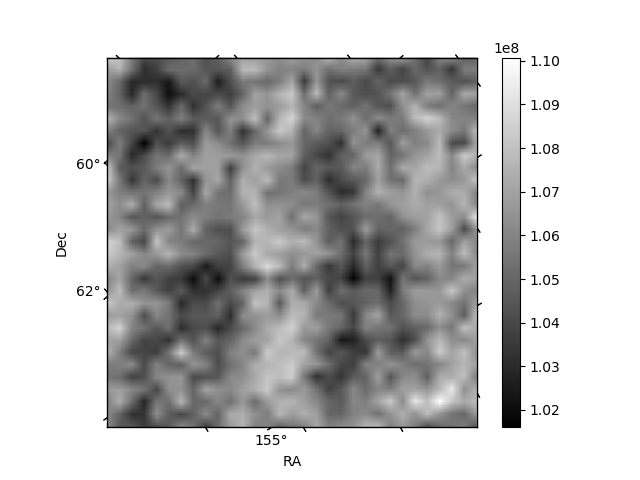
Histogram calculated using DETX and DETY for each event in the final _common_clean file
| Quadrant A | 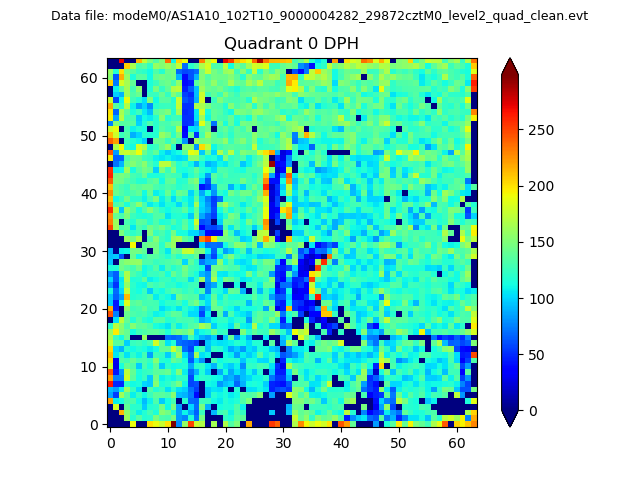 |
 |
Quadrant B |
|---|---|---|---|
| Quadrant D | 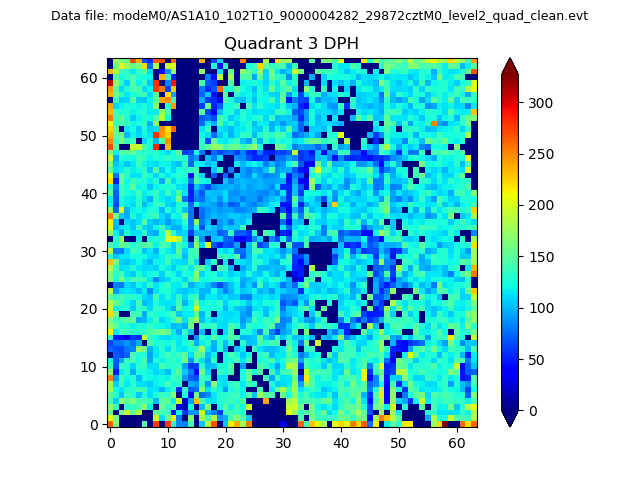 |
 |
Quadrant C |
| Plot type | Count rate plots | Images |
|---|---|---|
| Comparison with Poisson distribution Blue bars denote a histogram of data divided into 1 sec bins. Red curve is a Poisson curve with rate = median count rate of data. |
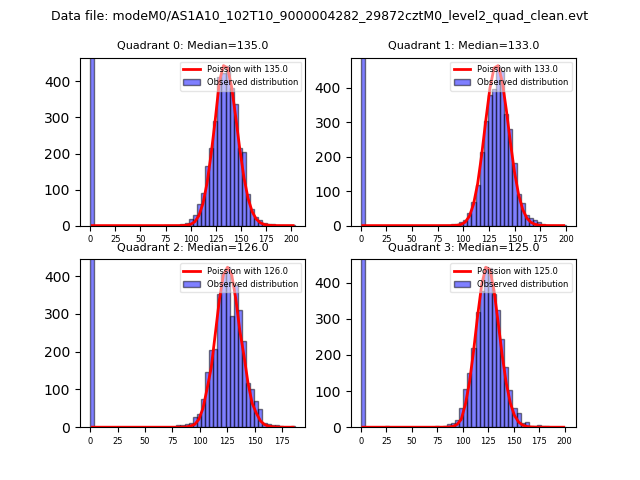 |
 |
| Quadrant-wise count rates Data is divided into 100 sec bins |
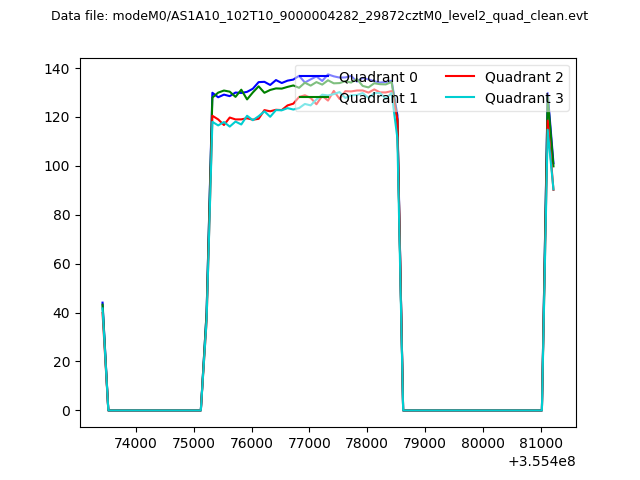 |
|
| Module-wise count rates for Quadrant A Data is divided into 100 sec bins |
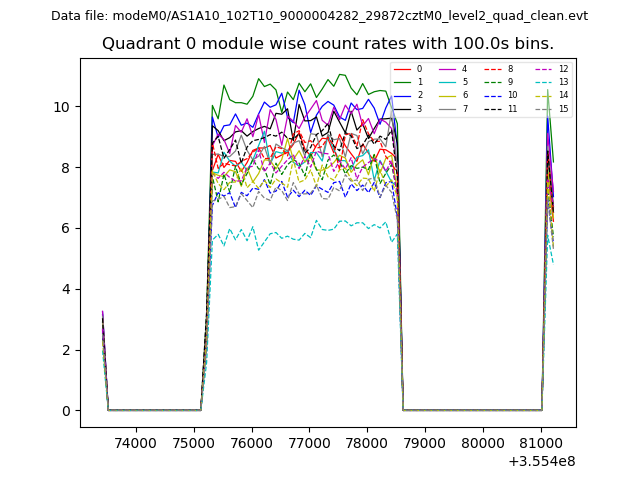 |
 |
| Module-wise count rates for Quadrant B Data is divided into 100 sec bins |
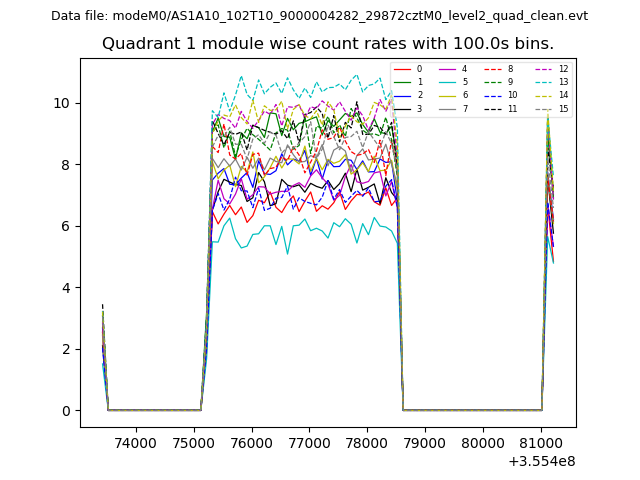 |
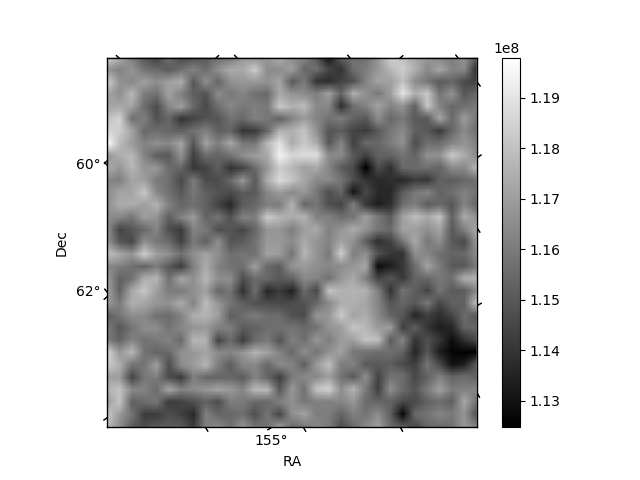 |
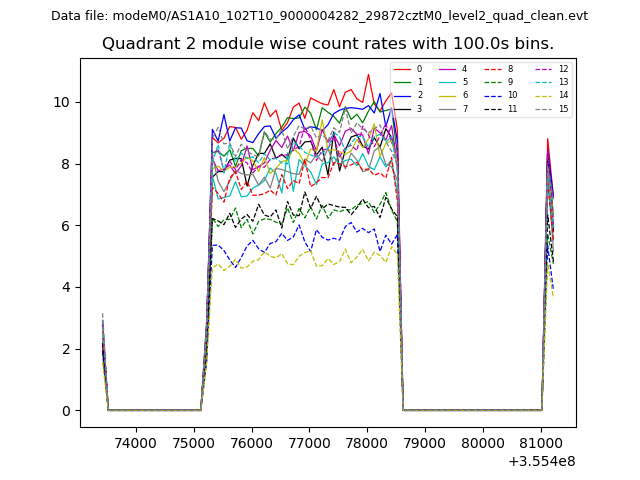
| Module-wise count rates for Quadrant C Data is divided into 100 sec bins |
 |
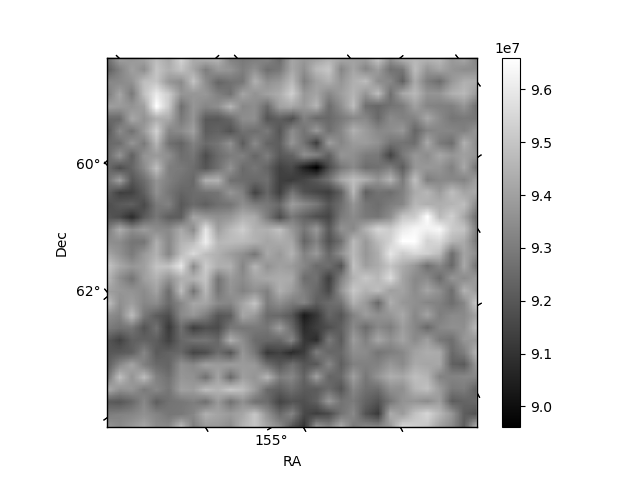 |
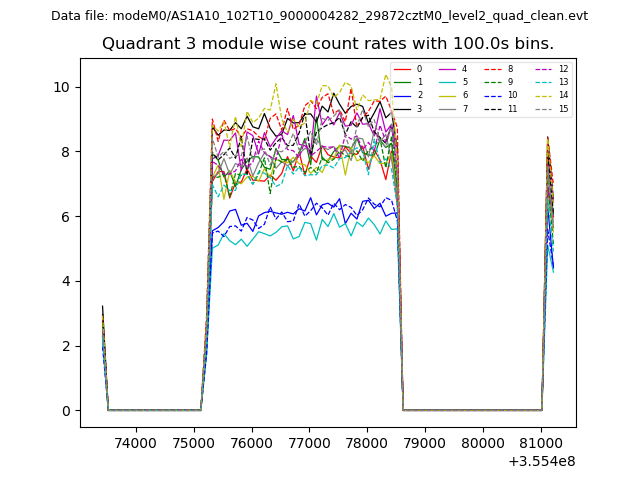
| Module-wise count rates for Quadrant D Data is divided into 100 sec bins |
 |
 |
| Parameter | Plot |
|---|---|
| CZT HV Monitor | 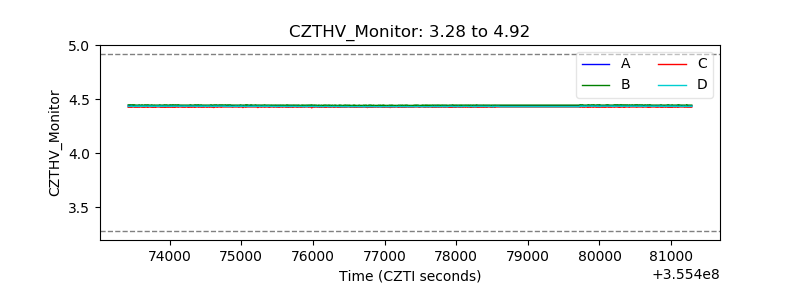 |
| D_VDD | 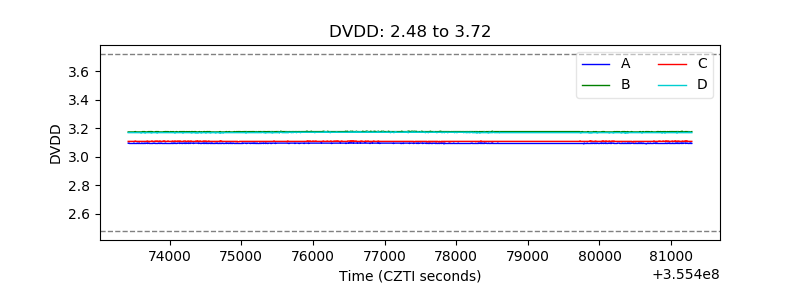 |
| Temperature 1 | 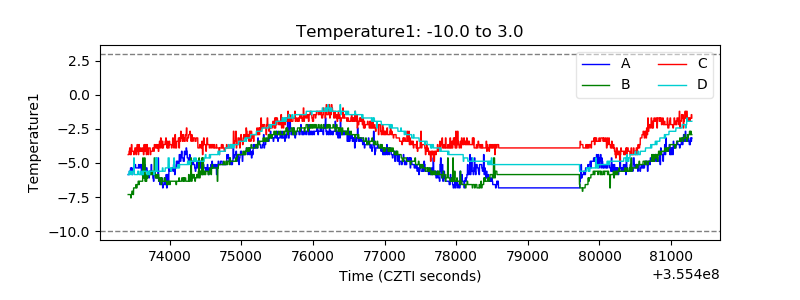 |
| Veto HV Monitor | 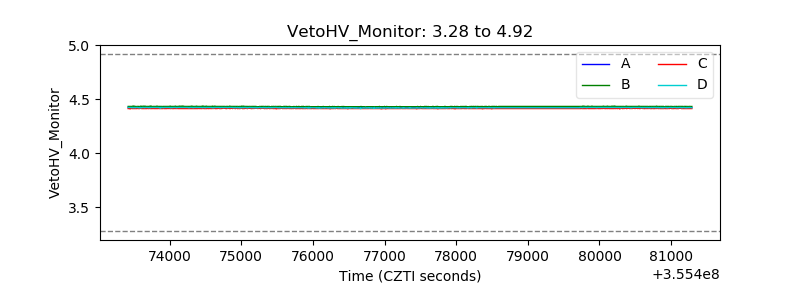 |
| Veto LLD | 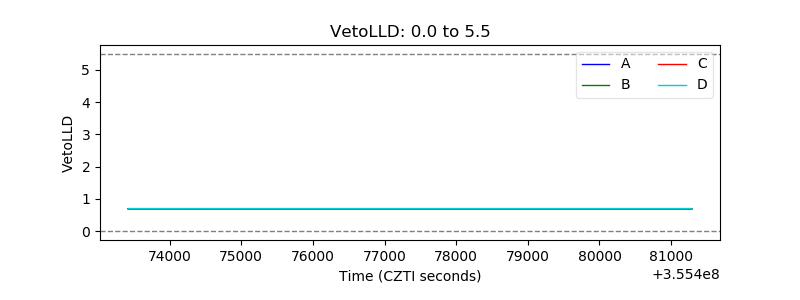 |
| Alpha Counter | 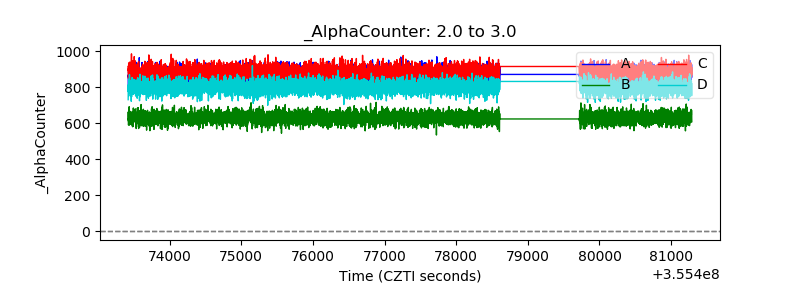 |
| _CPM_Rate | 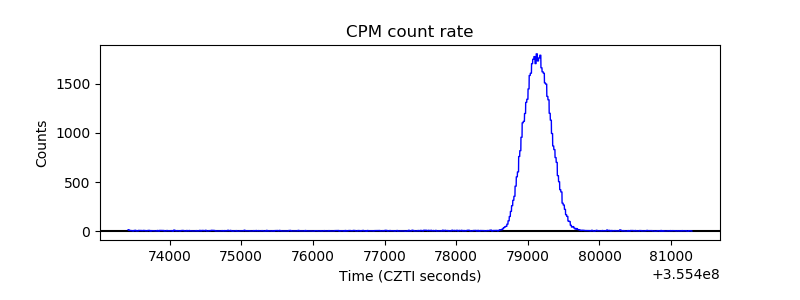 |
| CZT Counter | 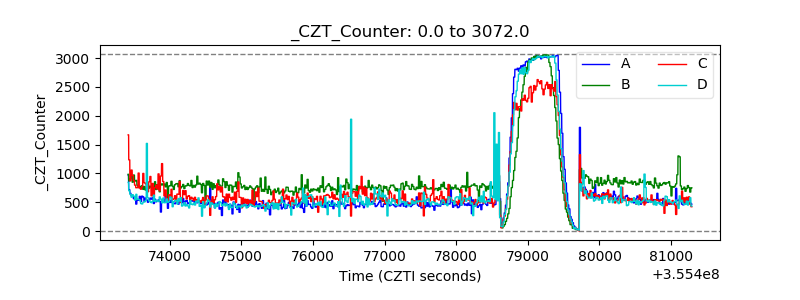 |
| +2.5 Volts monitor |  |
| +5 Volts monitor |  |
| _ROLL_ROT | 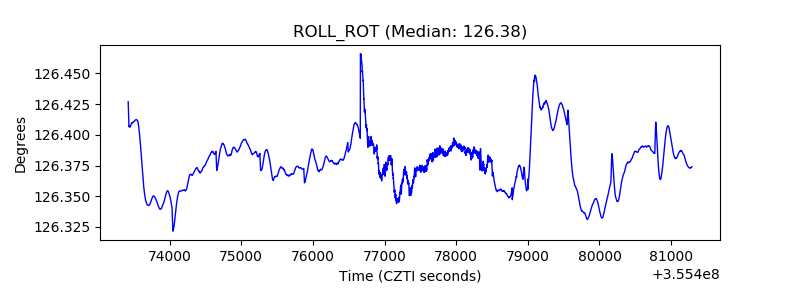 |
| _Roll_DEC | 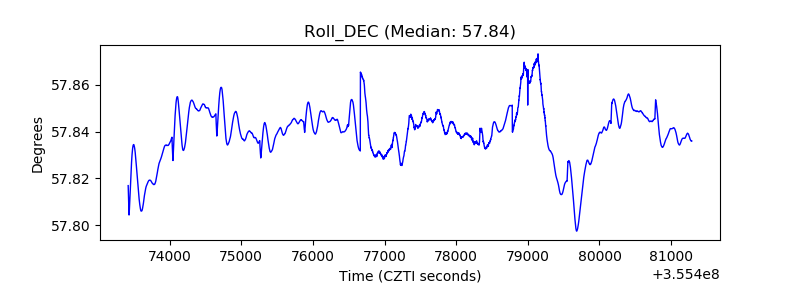 |
| _Roll_RA | 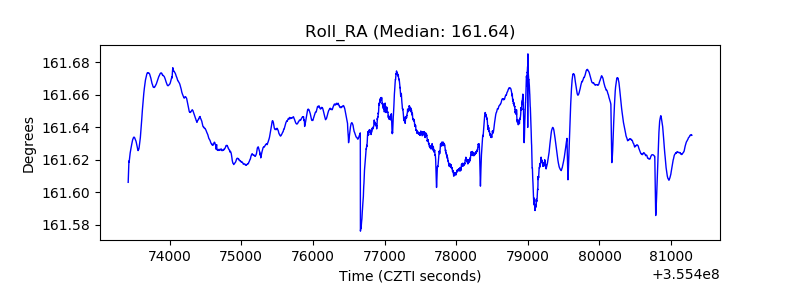 |
| Veto Counter | 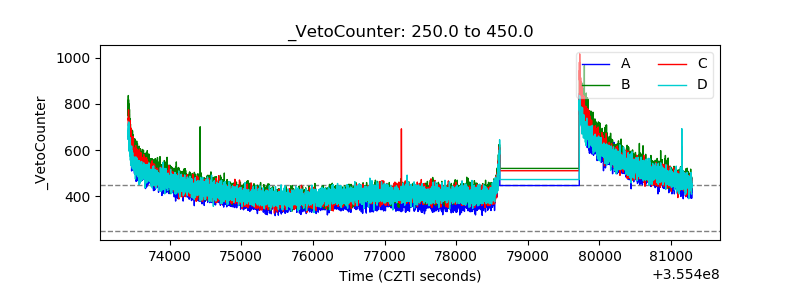 |