| Param | Original file | Final file |
|---|---|---|
| Filename | modeM0/AS1A10_102T10_9000004282_29874cztM0_level2.evt | modeM0/AS1A10_102T10_9000004282_29874cztM0_level2_quad_clean.evt |
| Size (bytes) | 552,337,920 | 92,871,360 |
| Size | 526.8 MB | 88.6 MB |
| Events in quadrant A | 3,562,367 | 612,919 |
| Events in quadrant B | 5,418,528 | 603,684 |
| Events in quadrant C | 3,650,497 | 571,266 |
| Events in quadrant D | 3,646,390 | 561,358 |
| Mode SS | |||
|---|---|---|---|
| Quadrant | BADHDUFLAG | Total packets | Discarded packets |
| A | 0 | 134 | 0 |
| B | 0 | 134 | 0 |
| C | 0 | 134 | 0 |
| D | 0 | 134 | 0 |
| Mode M9 | |||
|---|---|---|---|
| Quadrant | BADHDUFLAG | Total packets | Discarded packets |
| A | 0 | 16 | 0 |
| B | 0 | 17 | 0 |
| C | 0 | 17 | 0 |
| D | 0 | 17 | 0 |
| Mode M0 | |||
|---|---|---|---|
| Quadrant | BADHDUFLAG | Total packets | Discarded packets |
| A | 0 | 14786 | 2 |
| B | 0 | 20506 | 2 |
| C | 0 | 14945 | 2 |
| D | 0 | 14839 | 2 |
| Quadrant | Total seconds | Saturated seconds | Saturation percentage |
|---|---|---|---|
| A | 6647 | 81 | 1.218595% |
| B | 6647 | 146 | 2.196480% |
| C | 6647 | 110 | 1.654882% |
| D | 6647 | 65 | 0.977885% |
Noise dominated data is calculated using 1-second bins in cleaned event files. If a bin has >2000 counts, and if more than 50% of those come from <1% of pixels, then it is considered to be noise-dominated and hence unusable.
| Quadrant | # 1 sec bins | Bins with >0 counts | Bins with >2000 counts | High rate bins dominated by noise | Noise dominated (total time) | Noise dominated (detector-on time) | Marked lightcurve |
|---|---|---|---|---|---|---|---|
| A | 7832 | 6648 | 2 | 2 | 0.03% | 0.03% | 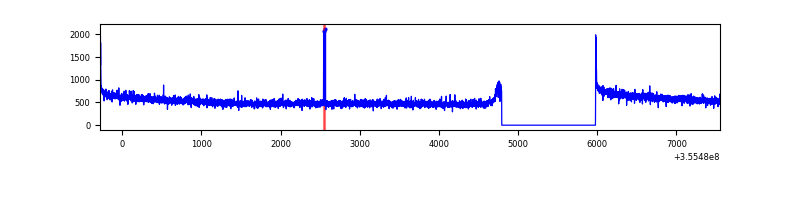 |
| B | 7832 | 6648 | 0 | 0 | 0.00% | 0.00% | 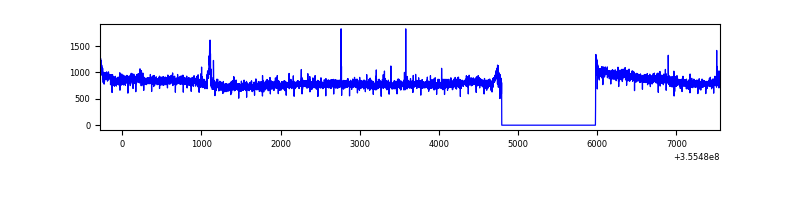 |
| C | 7832 | 6648 | 0 | 0 | 0.00% | 0.00% | 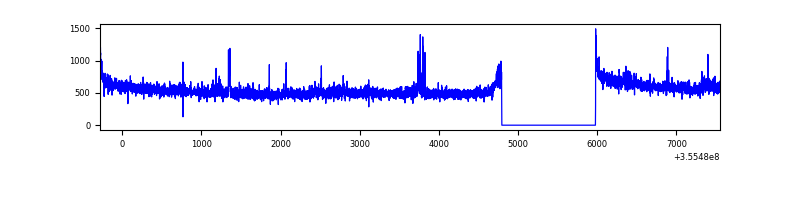 |
| D | 7832 | 6648 | 7 | 7 | 0.09% | 0.11% | 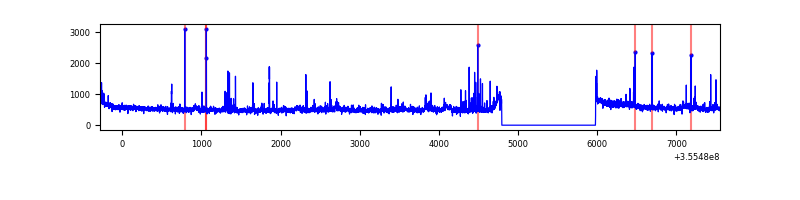 |
Top three noisy pixels from each quadrant. If the there are fewer than three noisy pixels in the level2.evt file, extra rows are filled as -1
| Pixel properties | Quadrant properties | ||||||
|---|---|---|---|---|---|---|---|
| Quadrant | DetID | PixID | Counts | Sigma | Mean | Median | Sigma |
| A | 8 | 192 | 23459 | 125.37 | 915 | 897 | 180.0 |
| A | 13 | 254 | 11848 | 60.85 | 915 | 897 | 180.0 |
| A | 5 | 168 | 8657 | 43.12 | 915 | 897 | 180.0 |
| B | 6 | 159 | 1872564 | 11174.95 | 891 | 871 | 167.5 |
| B | 0 | 190 | 37620 | 219.41 | 891 | 871 | 167.5 |
| B | 12 | 111 | 19694 | 112.38 | 891 | 871 | 167.5 |
| C | 3 | 233 | 157282 | 804.76 | 851 | 857 | 194.4 |
| C | 14 | 238 | 140261 | 717.19 | 851 | 857 | 194.4 |
| C | 10 | 22 | 23301 | 115.47 | 851 | 857 | 194.4 |
| D | 8 | 195 | 192825 | 945.35 | 869 | 848 | 203.1 |
| D | 2 | 250 | 84326 | 411.07 | 869 | 848 | 203.1 |
| D | 13 | 153 | 34897 | 167.67 | 869 | 848 | 203.1 |
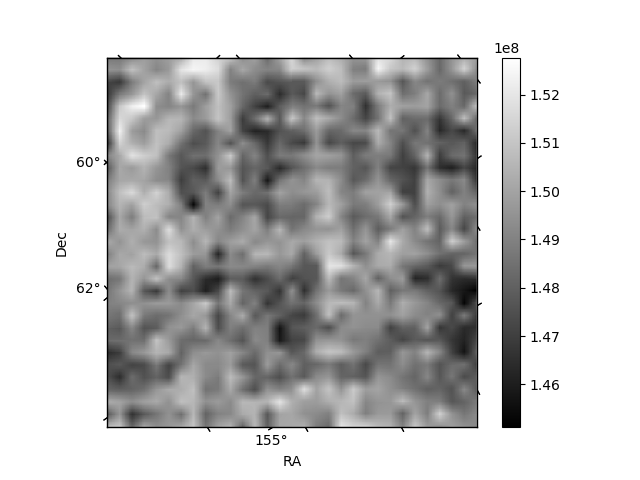
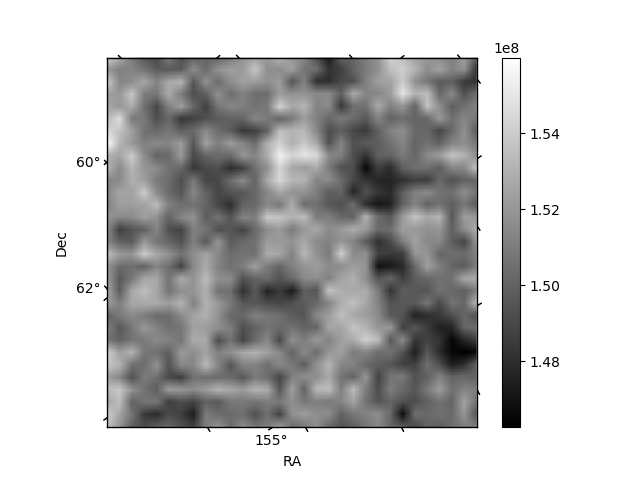
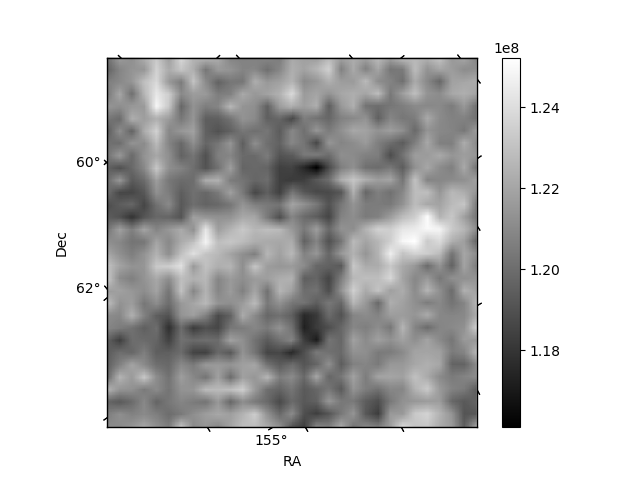
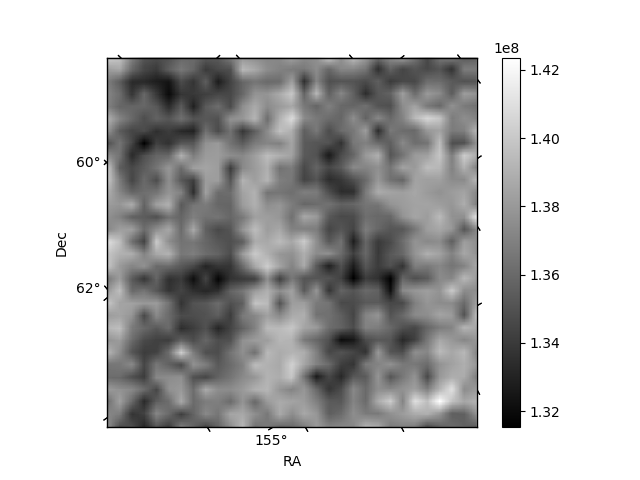
Histogram calculated using DETX and DETY for each event in the final _common_clean file
| Quadrant A |  |
 |
Quadrant B |
|---|---|---|---|
| Quadrant D | 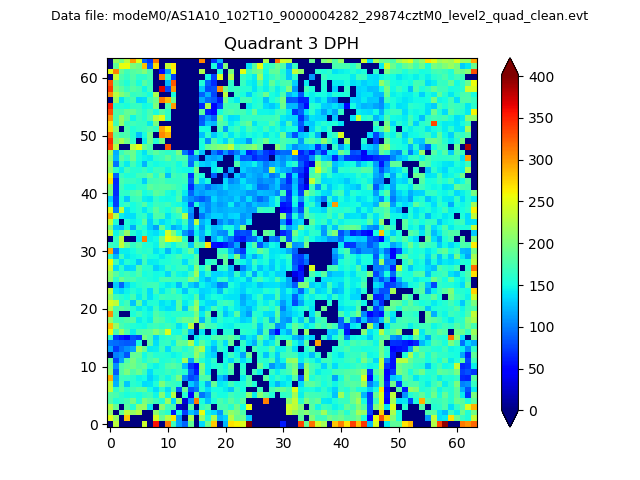 |
 |
Quadrant C |
| Plot type | Count rate plots | Images |
|---|---|---|
| Comparison with Poisson distribution Blue bars denote a histogram of data divided into 1 sec bins. Red curve is a Poisson curve with rate = median count rate of data. |
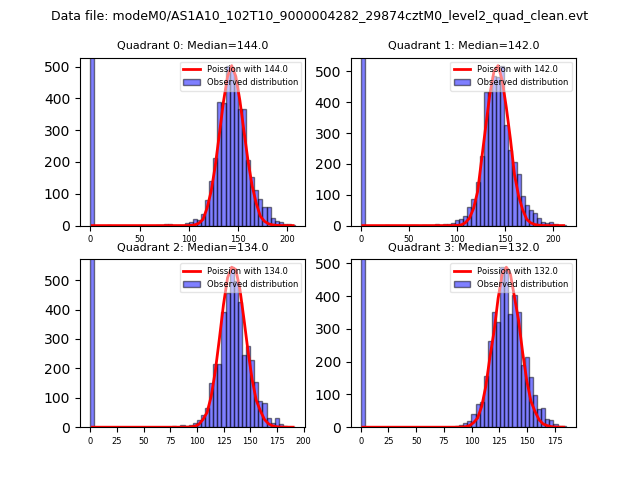 |
 |
| Quadrant-wise count rates Data is divided into 100 sec bins |
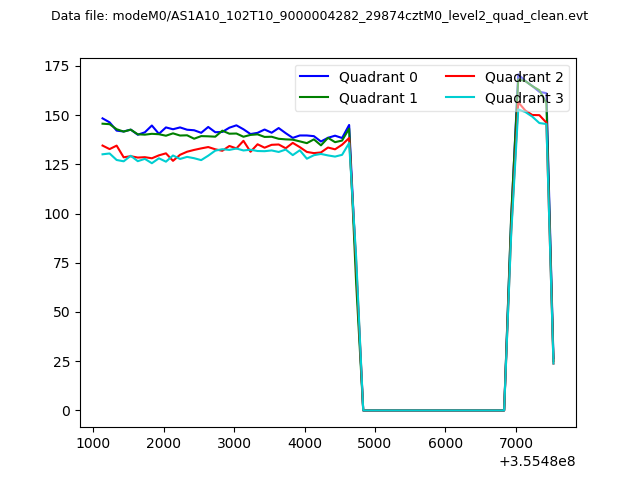 |
|
| Module-wise count rates for Quadrant A Data is divided into 100 sec bins |
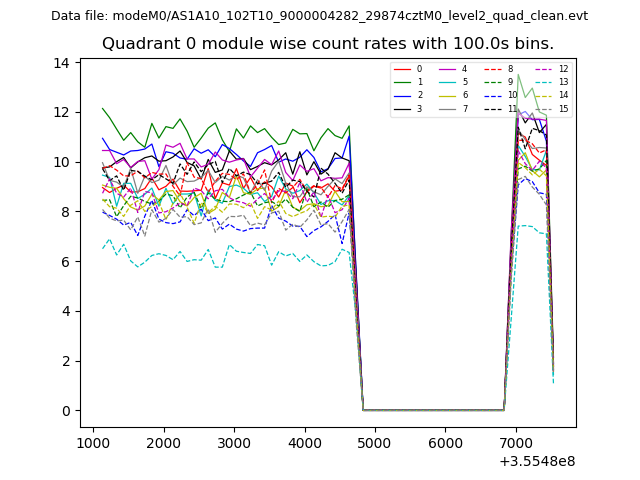 |
 |
| Module-wise count rates for Quadrant B Data is divided into 100 sec bins |
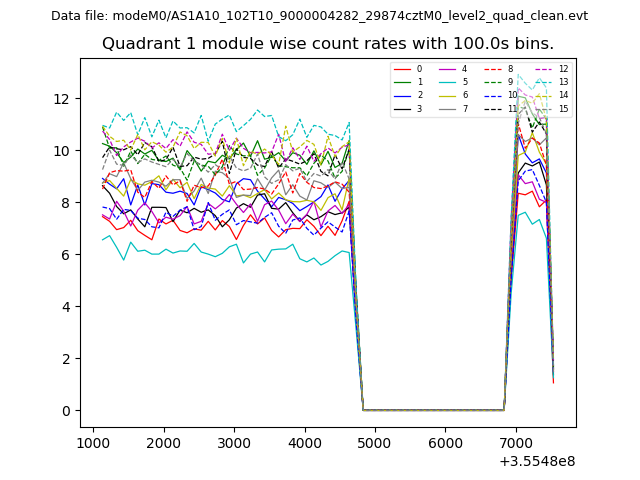 |
 |
| Module-wise count rates for Quadrant C Data is divided into 100 sec bins |
 |
 |
| Module-wise count rates for Quadrant D Data is divided into 100 sec bins |
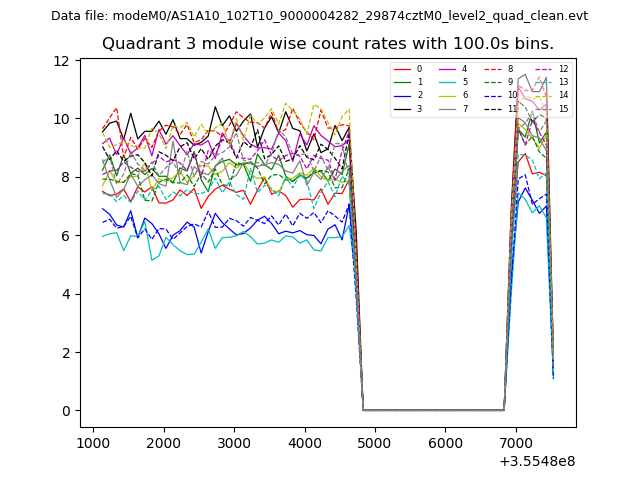 |
 |
| Parameter | Plot |
|---|---|
| CZT HV Monitor |  |
| D_VDD | 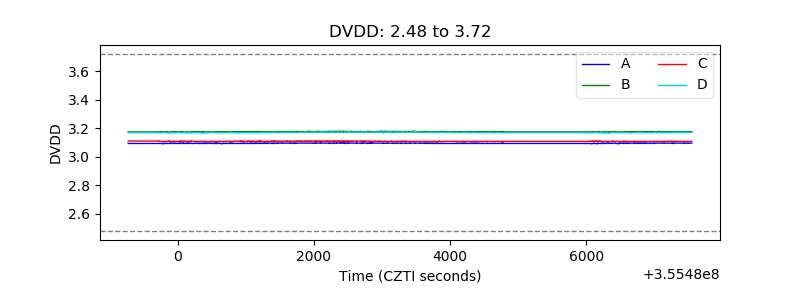 |
| Temperature 1 | 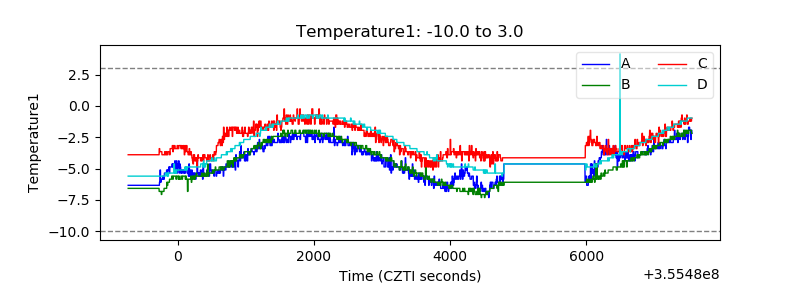 |
| Veto HV Monitor | 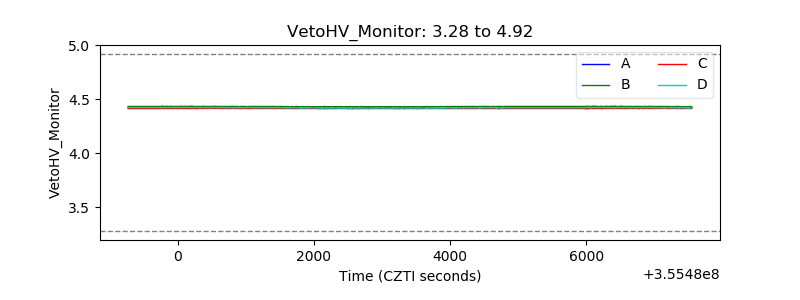 |
| Veto LLD | 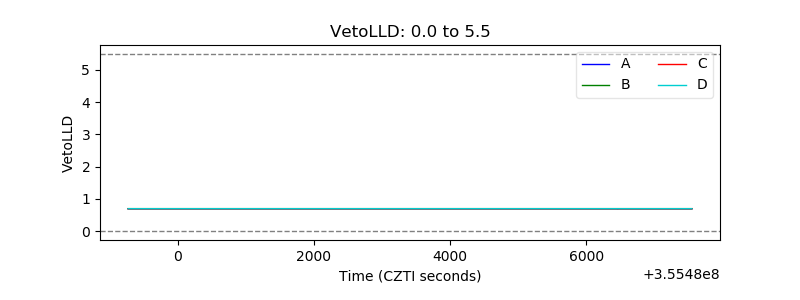 |
| Alpha Counter | 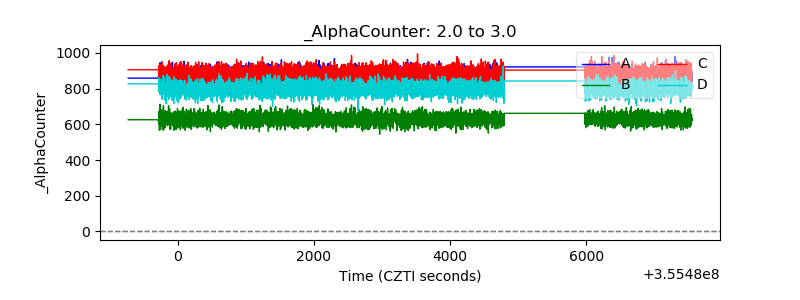 |
| _CPM_Rate | 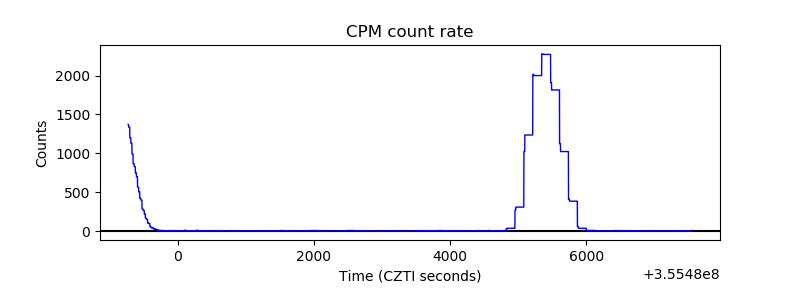 |
| CZT Counter | 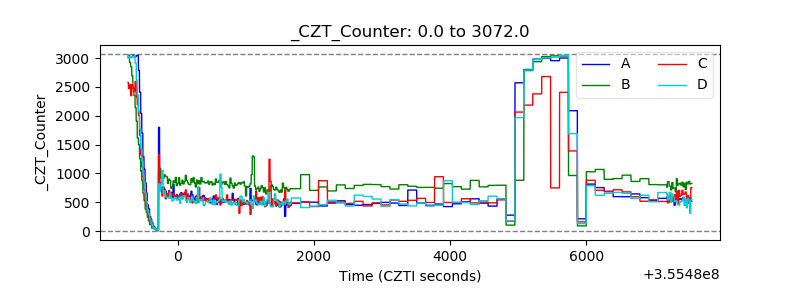 |
| +2.5 Volts monitor |  |
| +5 Volts monitor |  |
| _ROLL_ROT | 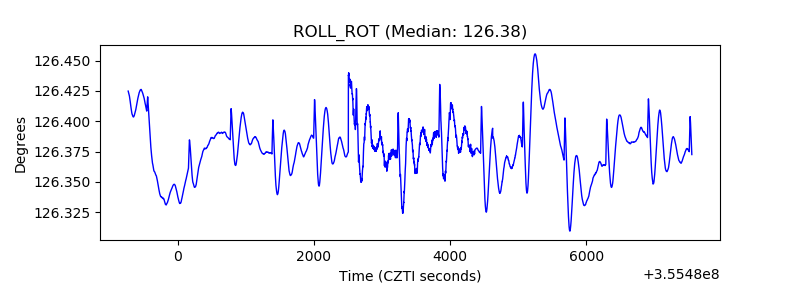 |
| _Roll_DEC | 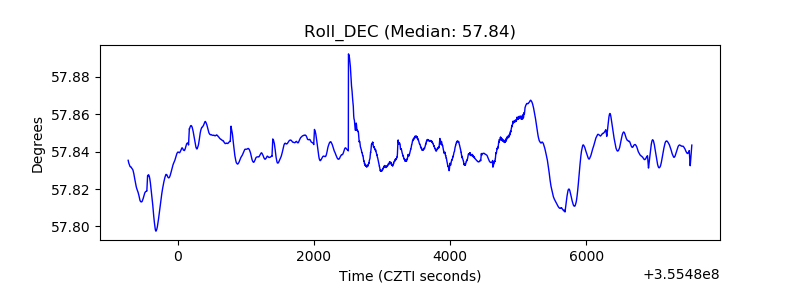 |
| _Roll_RA | 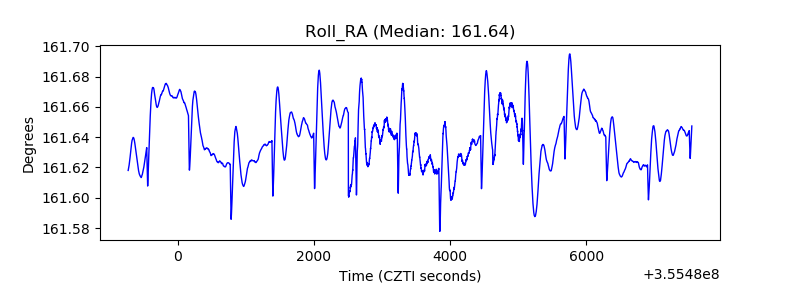 |
| Veto Counter | 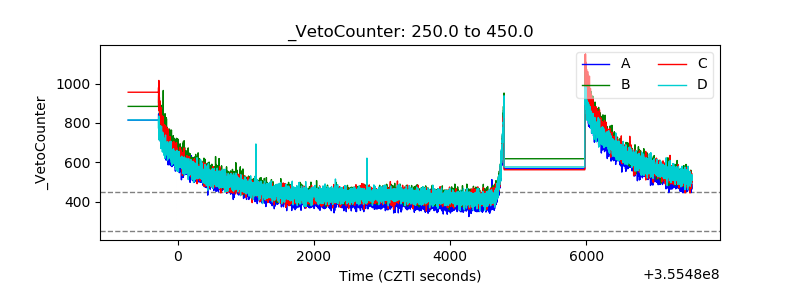 |