| Param | Original file | Final file |
|---|---|---|
| Filename | modeM0/AS1A10_102T10_9000004282_29879cztM0_level2.evt | modeM0/AS1A10_102T10_9000004282_29879cztM0_level2_quad_clean.evt |
| Size (bytes) | 655,349,760 | 105,730,560 |
| Size | 625.0 MB | 100.8 MB |
| Events in quadrant A | 3,370,776 | 708,292 |
| Events in quadrant B | 5,366,353 | 702,328 |
| Events in quadrant C | 6,390,407 | 651,335 |
| Events in quadrant D | 4,257,643 | 663,172 |
| Mode SS | |||
|---|---|---|---|
| Quadrant | BADHDUFLAG | Total packets | Discarded packets |
| A | 0 | 140 | 0 |
| B | 0 | 140 | 0 |
| C | 0 | 140 | 0 |
| D | 0 | 140 | 0 |
| Mode M9 | |||
|---|---|---|---|
| Quadrant | BADHDUFLAG | Total packets | Discarded packets |
| A | 0 | 10 | 0 |
| B | 0 | 11 | 0 |
| C | 0 | 11 | 0 |
| D | 0 | 11 | 0 |
| Mode M0 | |||
|---|---|---|---|
| Quadrant | BADHDUFLAG | Total packets | Discarded packets |
| A | 0 | 14382 | 2 |
| B | 0 | 20704 | 3 |
| C | 0 | 23956 | 2 |
| D | 0 | 17114 | 2 |
| Quadrant | Total seconds | Saturated seconds | Saturation percentage |
|---|---|---|---|
| A | 6841 | 63 | 0.920918% |
| B | 6840 | 130 | 1.900585% |
| C | 6840 | 447 | 6.535088% |
| D | 6840 | 130 | 1.900585% |
Noise dominated data is calculated using 1-second bins in cleaned event files. If a bin has >2000 counts, and if more than 50% of those come from <1% of pixels, then it is considered to be noise-dominated and hence unusable.
| Quadrant | # 1 sec bins | Bins with >0 counts | Bins with >2000 counts | High rate bins dominated by noise | Noise dominated (total time) | Noise dominated (detector-on time) | Marked lightcurve |
|---|---|---|---|---|---|---|---|
| A | 7686 | 6842 | 1 | 1 | 0.01% | 0.01% | 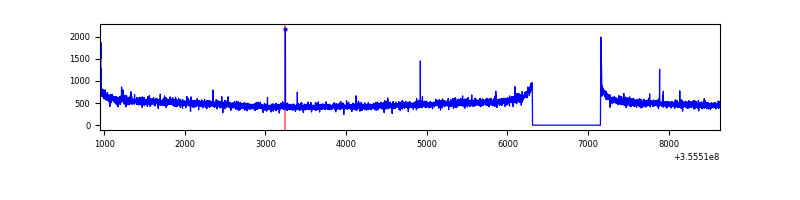 |
| B | 7685 | 6841 | 0 | 0 | 0.00% | 0.00% | 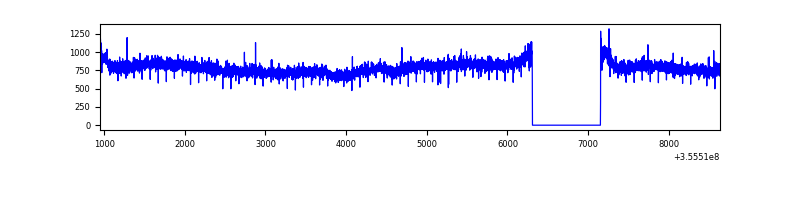 |
| C | 7685 | 6841 | 41 | 41 | 0.53% | 0.60% | 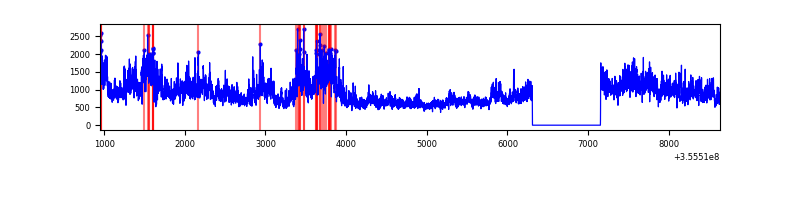 |
| D | 7685 | 6841 | 89 | 89 | 1.16% | 1.30% | 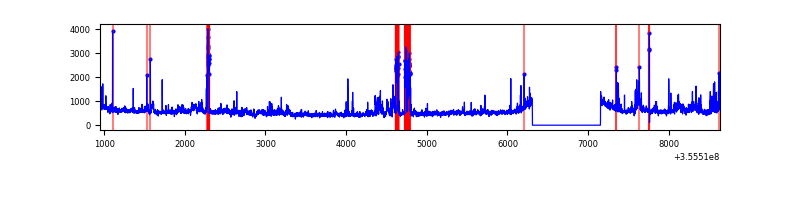 |
Top three noisy pixels from each quadrant. If the there are fewer than three noisy pixels in the level2.evt file, extra rows are filled as -1
| Pixel properties | Quadrant properties | ||||||
|---|---|---|---|---|---|---|---|
| Quadrant | DetID | PixID | Counts | Sigma | Mean | Median | Sigma |
| A | 8 | 192 | 29941 | 169.22 | 862 | 846 | 171.9 |
| A | 13 | 254 | 12666 | 68.74 | 862 | 846 | 171.9 |
| A | 3 | 137 | 8260 | 43.12 | 862 | 846 | 171.9 |
| B | 6 | 159 | 2034695 | 12765.82 | 848 | 827 | 159.3 |
| B | 12 | 111 | 19226 | 115.48 | 848 | 827 | 159.3 |
| B | 11 | 111 | 17544 | 104.93 | 848 | 827 | 159.3 |
| C | 3 | 233 | 3048098 | 15999.29 | 817 | 823 | 190.5 |
| C | 14 | 238 | 134466 | 701.67 | 817 | 823 | 190.5 |
| C | 2 | 114 | 16114 | 80.28 | 817 | 823 | 190.5 |
| D | 8 | 195 | 395903 | 2005.33 | 838 | 817 | 197.0 |
| D | 7 | 80 | 343754 | 1740.64 | 838 | 817 | 197.0 |
| D | 7 | 238 | 111568 | 562.14 | 838 | 817 | 197.0 |
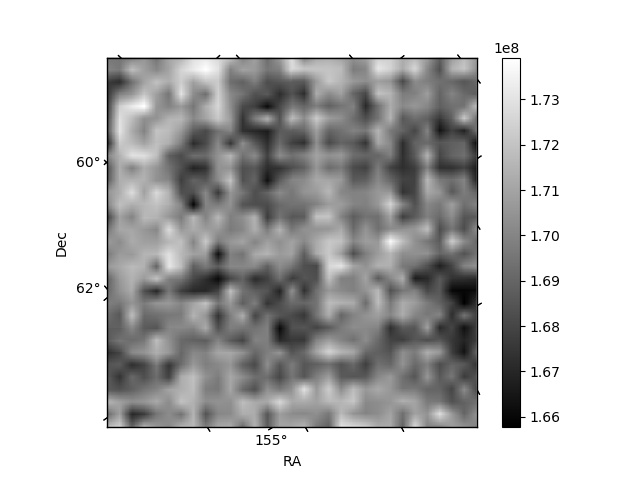
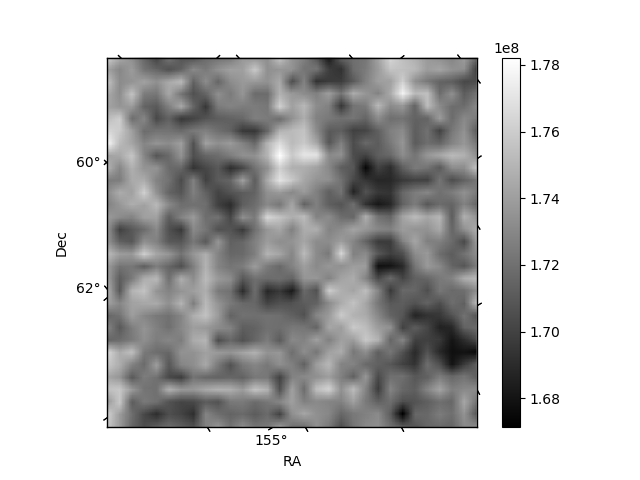
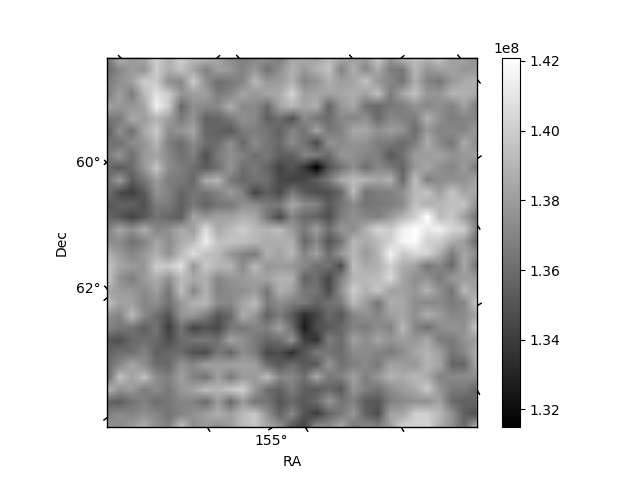
Histogram calculated using DETX and DETY for each event in the final _common_clean file
| Quadrant A | 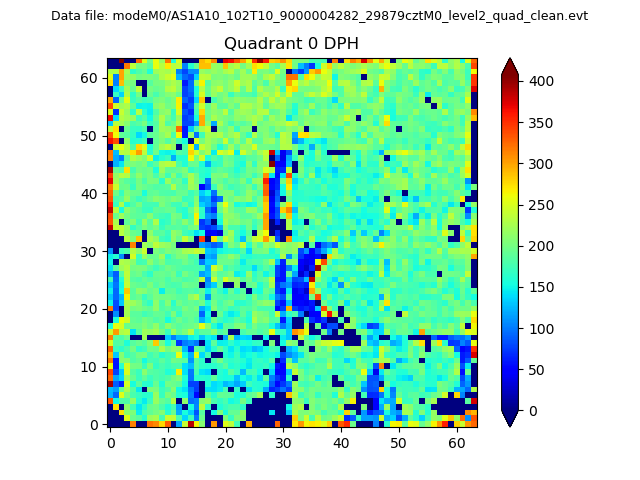 |
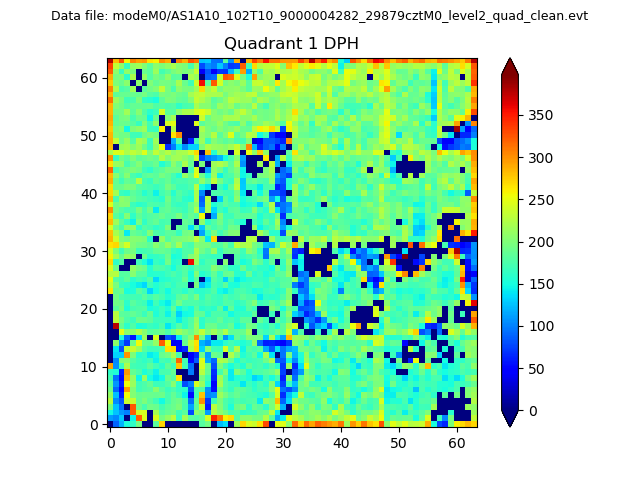 |
Quadrant B |
|---|---|---|---|
| Quadrant D |  |
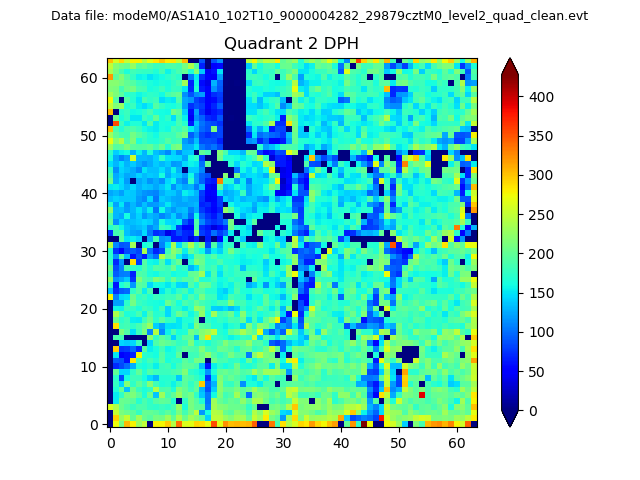 |
Quadrant C |
| Plot type | Count rate plots | Images |
|---|---|---|
| Comparison with Poisson distribution Blue bars denote a histogram of data divided into 1 sec bins. Red curve is a Poisson curve with rate = median count rate of data. |
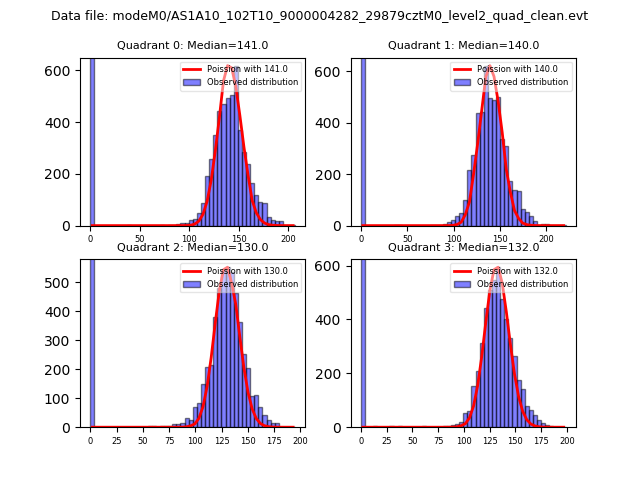 |
 |
| Quadrant-wise count rates Data is divided into 100 sec bins |
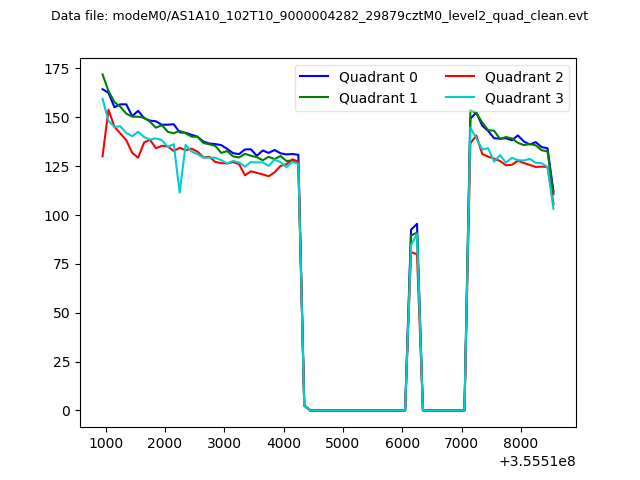 |
|
| Module-wise count rates for Quadrant A Data is divided into 100 sec bins |
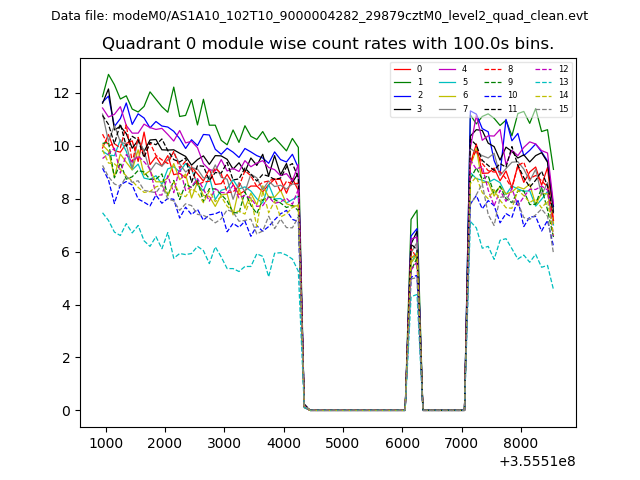 |
 |
| Module-wise count rates for Quadrant B Data is divided into 100 sec bins |
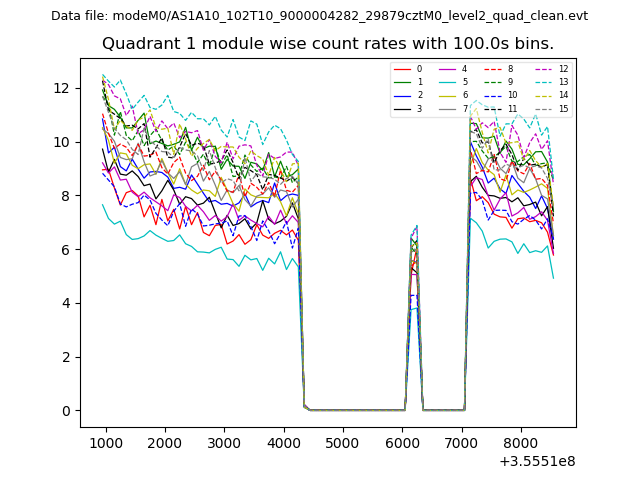 |
 |
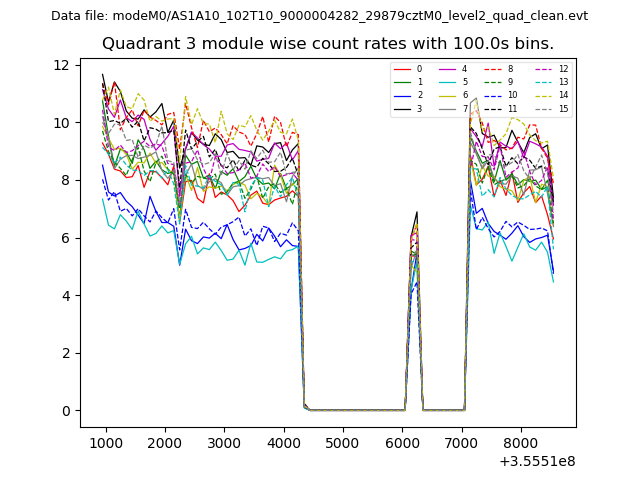
| Module-wise count rates for Quadrant C Data is divided into 100 sec bins |
 |
 |
| Module-wise count rates for Quadrant D Data is divided into 100 sec bins |
 |
 |
| Parameter | Plot |
|---|---|
| CZT HV Monitor | 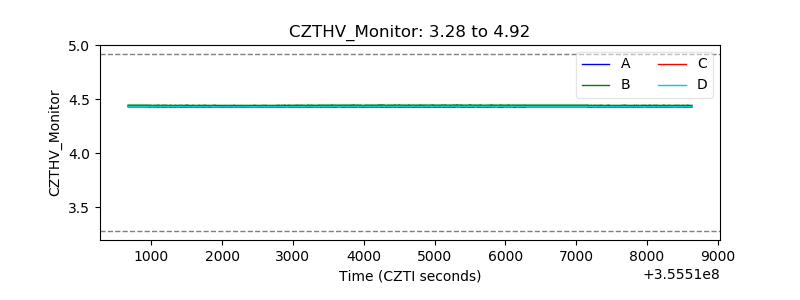 |
| D_VDD | 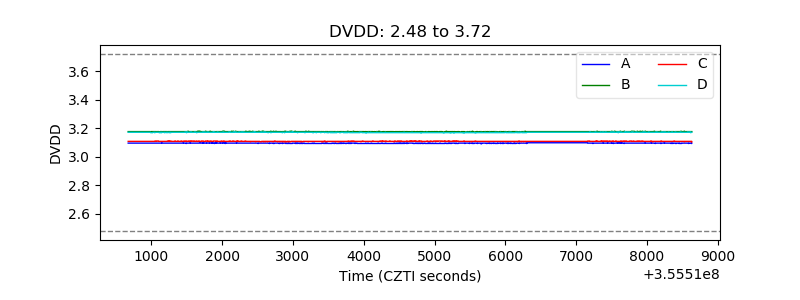 |
| Temperature 1 | 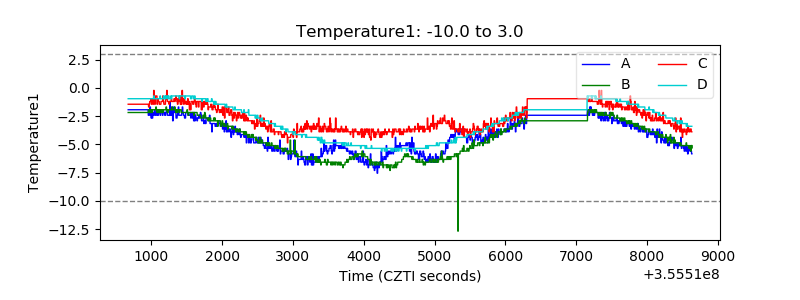 |
| Veto HV Monitor | 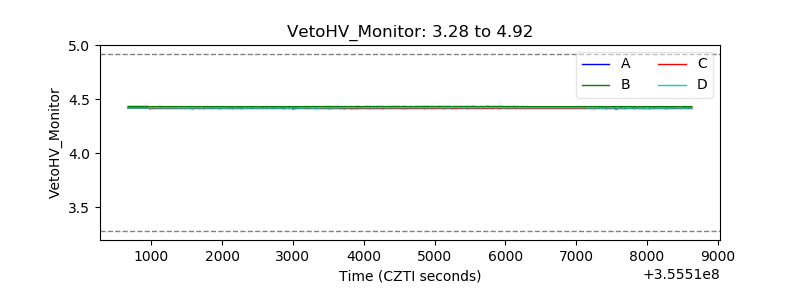 |
| Veto LLD | 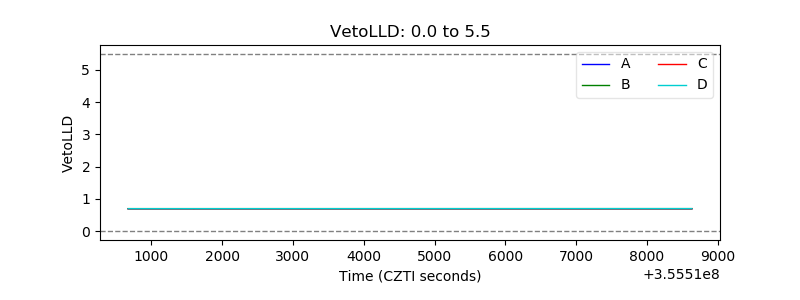 |
| Alpha Counter | 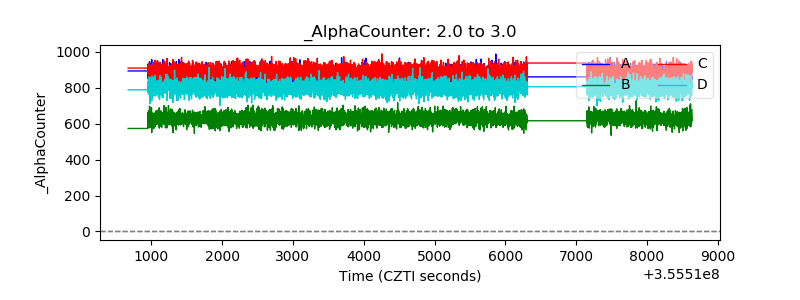 |
| _CPM_Rate | 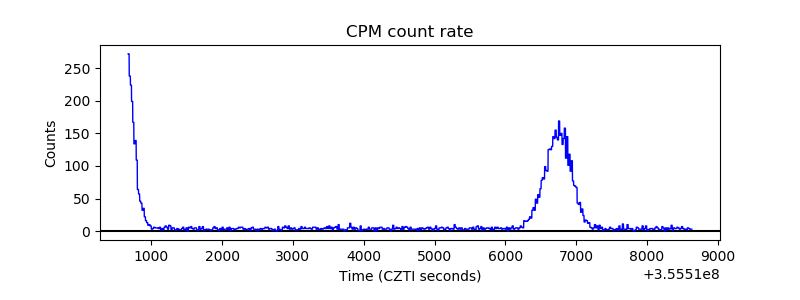 |
| CZT Counter | 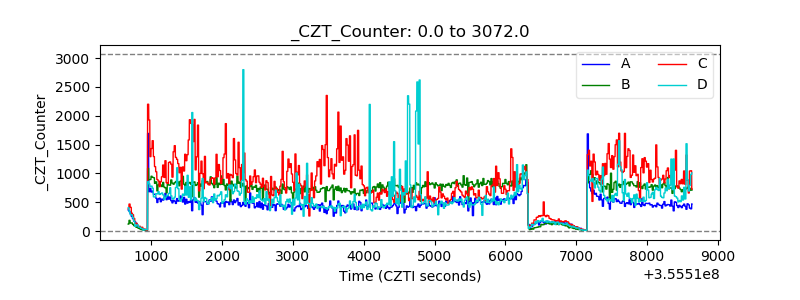 |
| +2.5 Volts monitor |  |
| +5 Volts monitor | 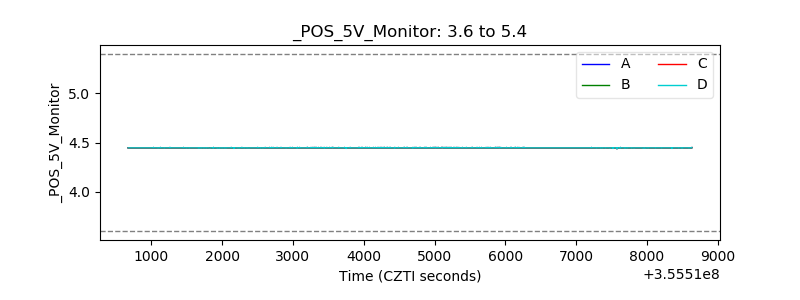 |
| _ROLL_ROT | 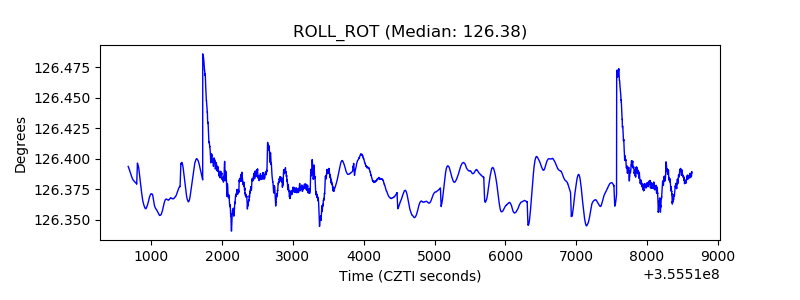 |
| _Roll_DEC | 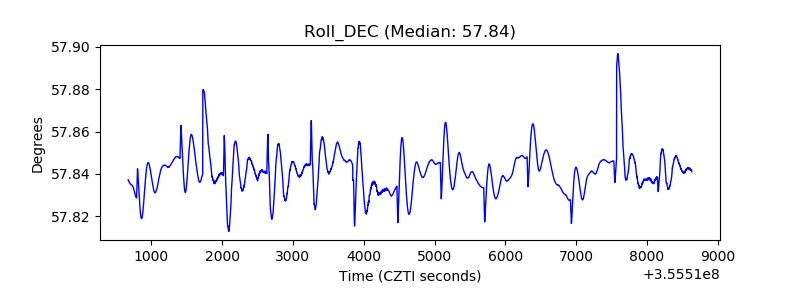 |
| _Roll_RA | 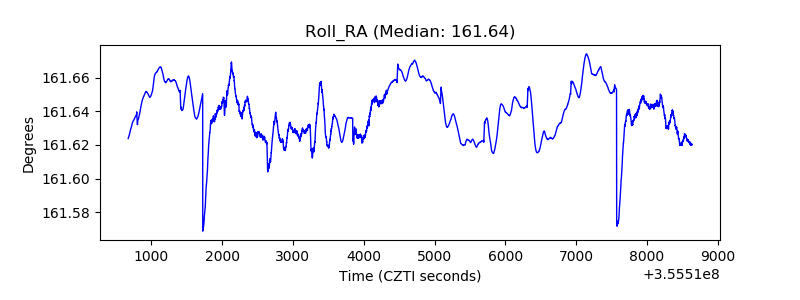 |
| Veto Counter | 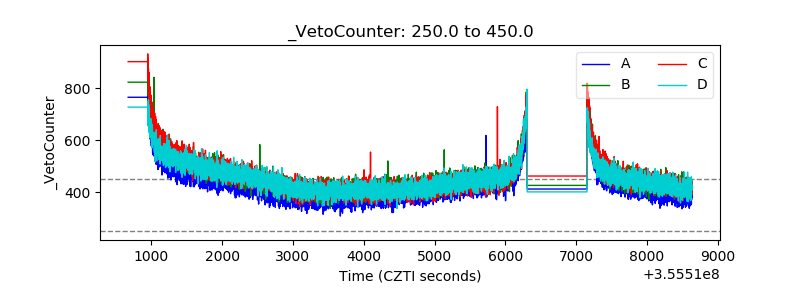 |