| Param | Original file | Final file |
|---|---|---|
| Filename | modeM0/AS1A10_102T10_9000004282_29884cztM0_level2.evt | modeM0/AS1A10_102T10_9000004282_29884cztM0_level2_quad_clean.evt |
| Size (bytes) | 550,002,240 | 80,478,720 |
| Size | 524.5 MB | 76.8 MB |
| Events in quadrant A | 2,731,895 | 528,755 |
| Events in quadrant B | 4,408,604 | 524,060 |
| Events in quadrant C | 5,917,976 | 478,583 |
| Events in quadrant D | 3,203,575 | 497,583 |
| Mode SS | |||
|---|---|---|---|
| Quadrant | BADHDUFLAG | Total packets | Discarded packets |
| A | 0 | 120 | 0 |
| B | 0 | 120 | 0 |
| C | 0 | 120 | 0 |
| D | 0 | 120 | 0 |
| Mode M9 | |||
|---|---|---|---|
| Quadrant | BADHDUFLAG | Total packets | Discarded packets |
| A | 0 | 2 | 0 |
| B | 0 | 2 | 0 |
| C | 0 | 2 | 0 |
| D | 0 | 2 | 0 |
| Mode M0 | |||
|---|---|---|---|
| Quadrant | BADHDUFLAG | Total packets | Discarded packets |
| A | 0 | 12000 | 2 |
| B | 0 | 17600 | 2 |
| C | 0 | 21630 | 2 |
| D | 0 | 13496 | 2 |
| Quadrant | Total seconds | Saturated seconds | Saturation percentage |
|---|---|---|---|
| A | 5831 | 44 | 0.754588% |
| B | 5832 | 96 | 1.646091% |
| C | 5832 | 567 | 9.722222% |
| D | 5832 | 53 | 0.908779% |
Noise dominated data is calculated using 1-second bins in cleaned event files. If a bin has >2000 counts, and if more than 50% of those come from <1% of pixels, then it is considered to be noise-dominated and hence unusable.
| Quadrant | # 1 sec bins | Bins with >0 counts | Bins with >2000 counts | High rate bins dominated by noise | Noise dominated (total time) | Noise dominated (detector-on time) | Marked lightcurve |
|---|---|---|---|---|---|---|---|
| A | 6091 | 5834 | 0 | 0 | 0.00% | 0.00% | 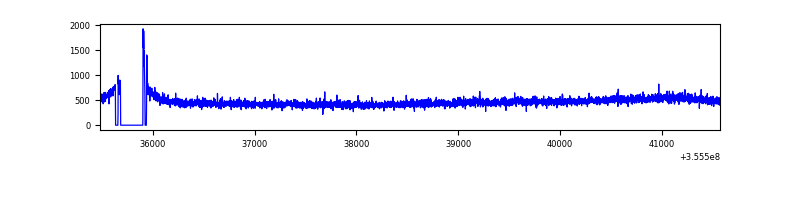 |
| B | 6092 | 5835 | 1 | 1 | 0.02% | 0.02% | 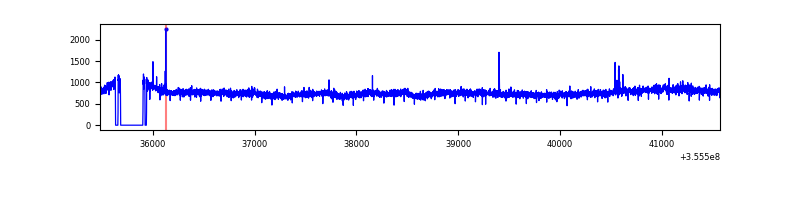 |
| C | 6092 | 5835 | 122 | 122 | 2.00% | 2.09% | 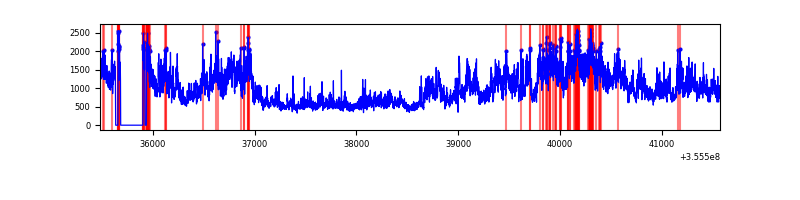 |
| D | 6092 | 5835 | 19 | 19 | 0.31% | 0.33% | 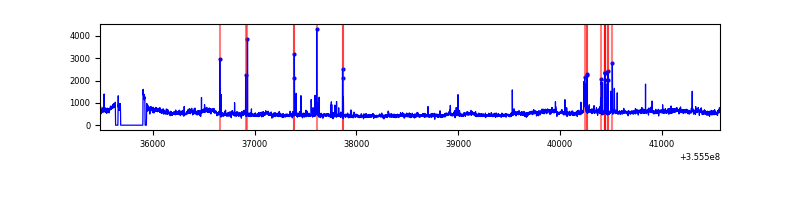 |
Top three noisy pixels from each quadrant. If the there are fewer than three noisy pixels in the level2.evt file, extra rows are filled as -1
| Pixel properties | Quadrant properties | ||||||
|---|---|---|---|---|---|---|---|
| Quadrant | DetID | PixID | Counts | Sigma | Mean | Median | Sigma |
| A | 8 | 192 | 20911 | 143.47 | 699 | 682 | 141.0 |
| A | 13 | 254 | 10554 | 70.01 | 699 | 682 | 141.0 |
| A | 1 | 113 | 10102 | 66.81 | 699 | 682 | 141.0 |
| B | 6 | 159 | 1675837 | 12542.2 | 691 | 673 | 133.6 |
| B | 12 | 111 | 16580 | 119.1 | 691 | 673 | 133.6 |
| B | 11 | 111 | 15040 | 107.57 | 691 | 673 | 133.6 |
| C | 3 | 233 | 3233671 | 21050.6 | 655 | 657 | 153.6 |
| C | 14 | 238 | 107146 | 693.36 | 655 | 657 | 153.6 |
| C | 2 | 114 | 13506 | 83.66 | 655 | 657 | 153.6 |
| D | 8 | 195 | 443448 | 2759.72 | 678 | 661 | 160.4 |
| D | 13 | 104 | 61194 | 377.28 | 678 | 661 | 160.4 |
| D | 2 | 250 | 47914 | 294.51 | 678 | 661 | 160.4 |
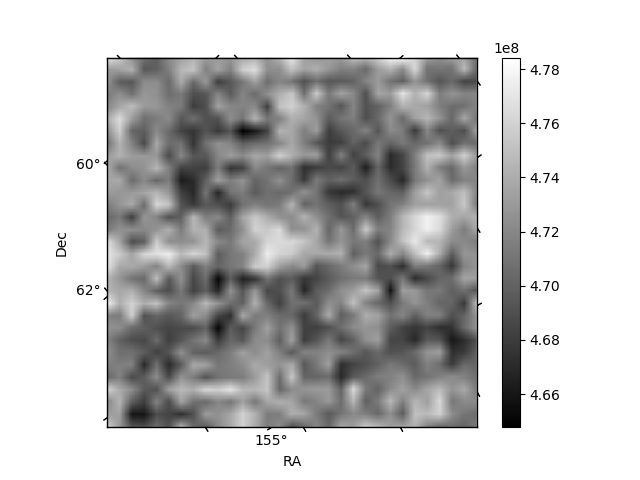
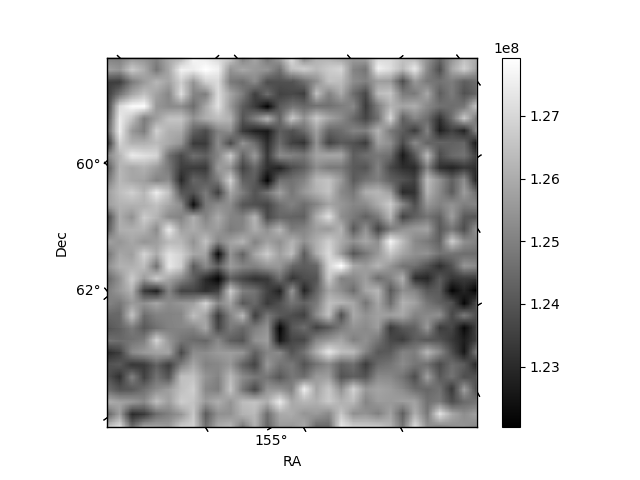
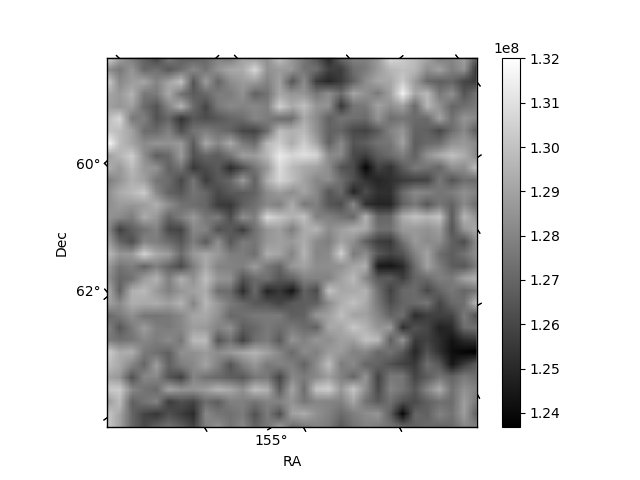
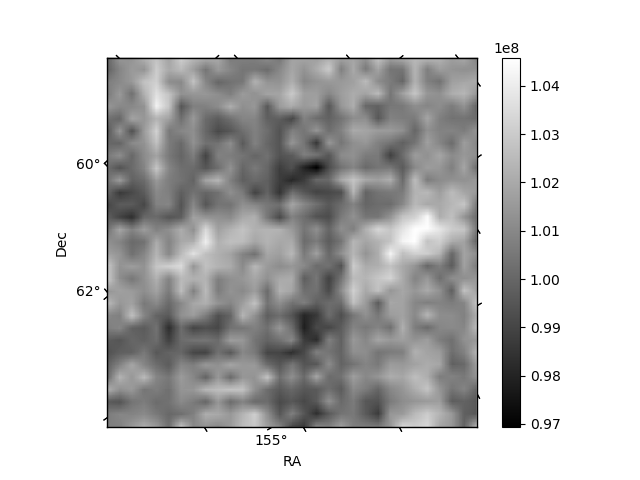
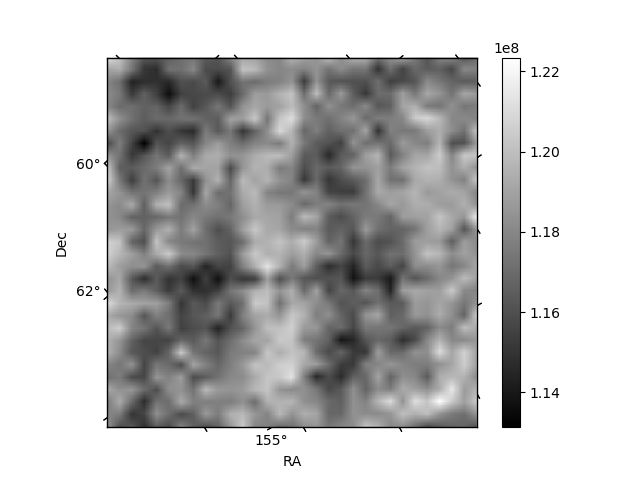
Histogram calculated using DETX and DETY for each event in the final _common_clean file
| Quadrant A | 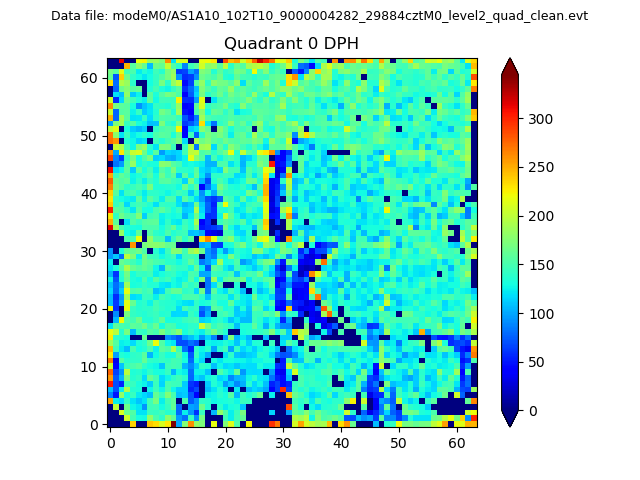 |
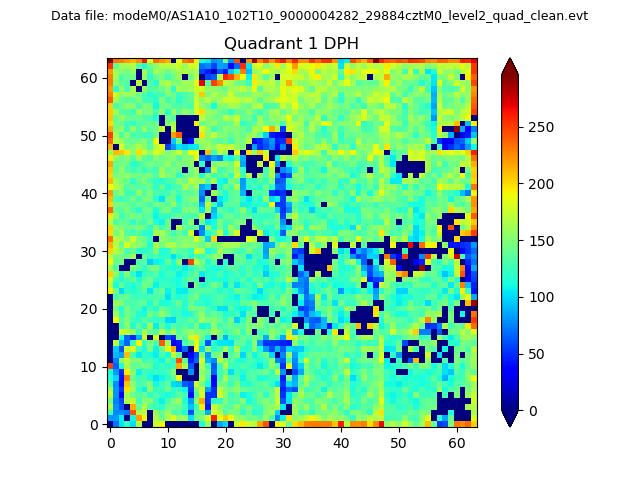 |
Quadrant B |
|---|---|---|---|
| Quadrant D | 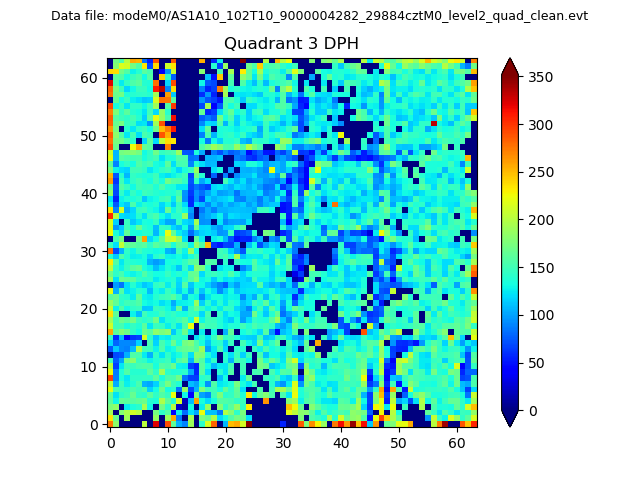 |
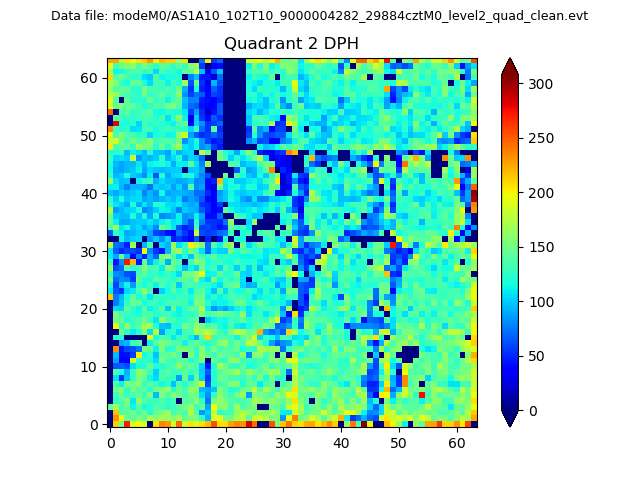 |
Quadrant C |
| Plot type | Count rate plots | Images |
|---|---|---|
| Comparison with Poisson distribution Blue bars denote a histogram of data divided into 1 sec bins. Red curve is a Poisson curve with rate = median count rate of data. |
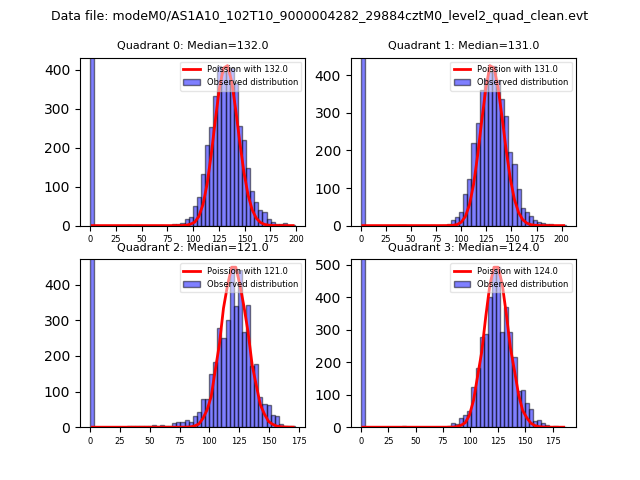 |
 |
| Quadrant-wise count rates Data is divided into 100 sec bins |
 |
|
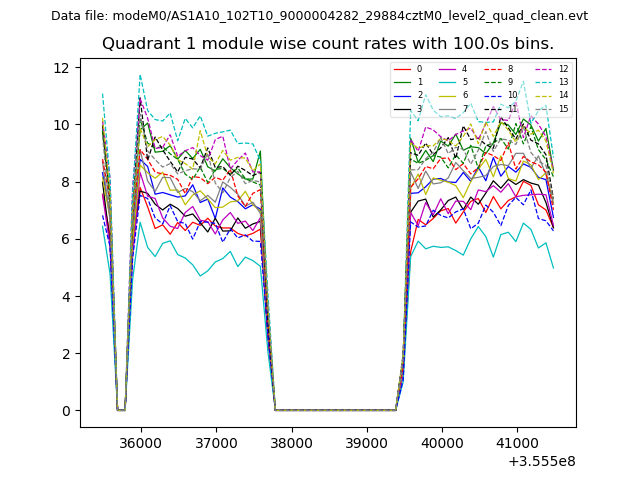
| Module-wise count rates for Quadrant A Data is divided into 100 sec bins |
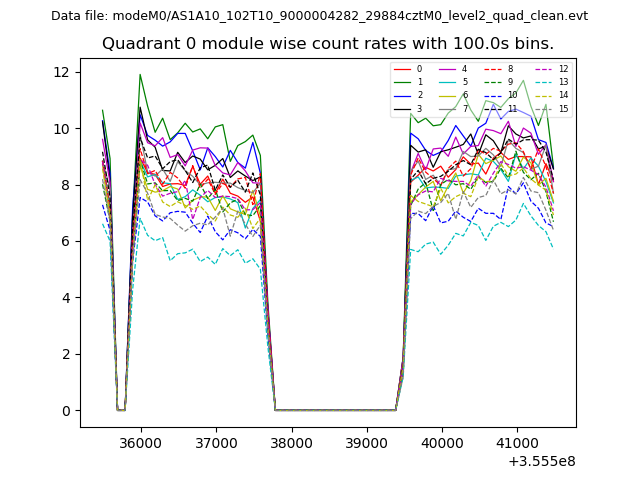 |
 |
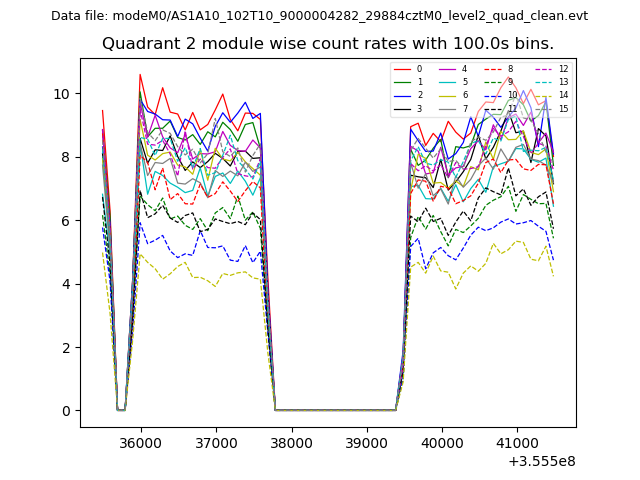
| Module-wise count rates for Quadrant B Data is divided into 100 sec bins |
 |
 |
| Module-wise count rates for Quadrant C Data is divided into 100 sec bins |
 |
 |
| Module-wise count rates for Quadrant D Data is divided into 100 sec bins |
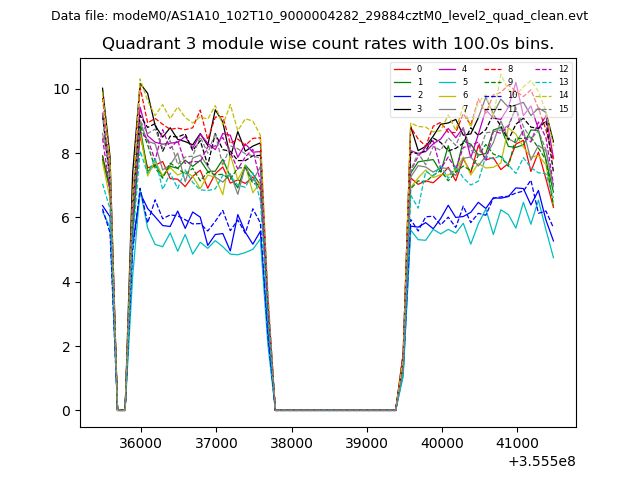 |
 |
| Parameter | Plot |
|---|---|
| CZT HV Monitor |  |
| D_VDD | 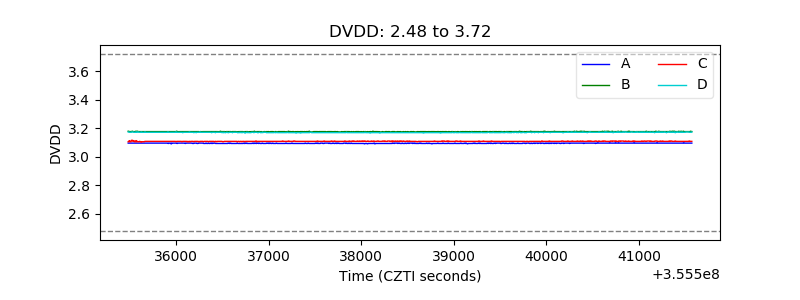 |
| Temperature 1 | 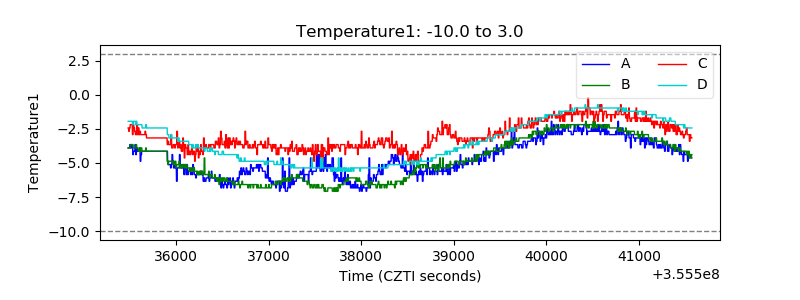 |
| Veto HV Monitor | 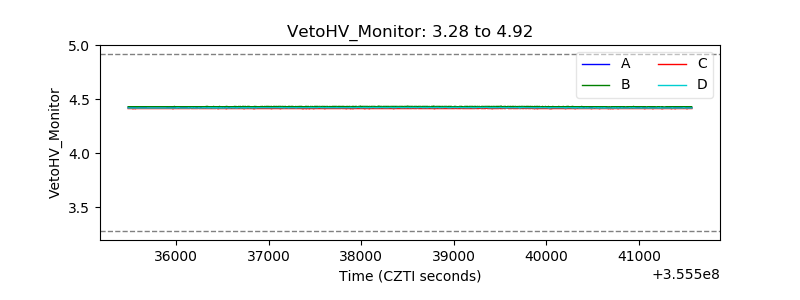 |
| Veto LLD | 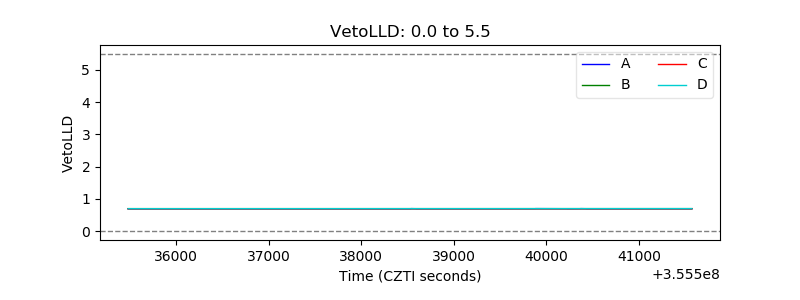 |
| Alpha Counter | 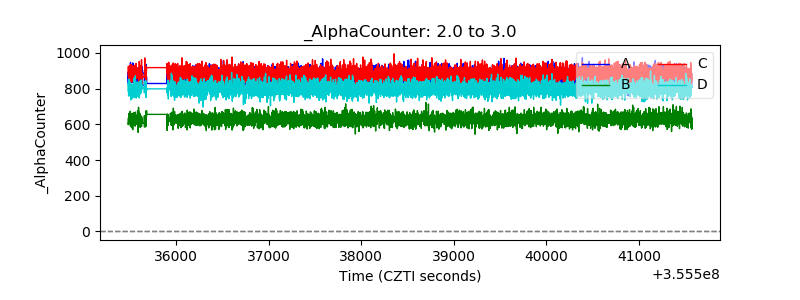 |
| _CPM_Rate | 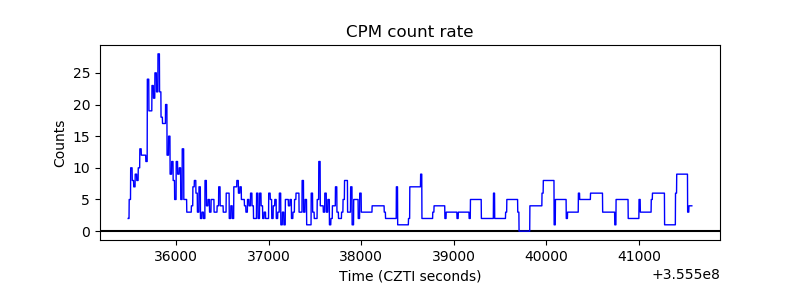 |
| CZT Counter | 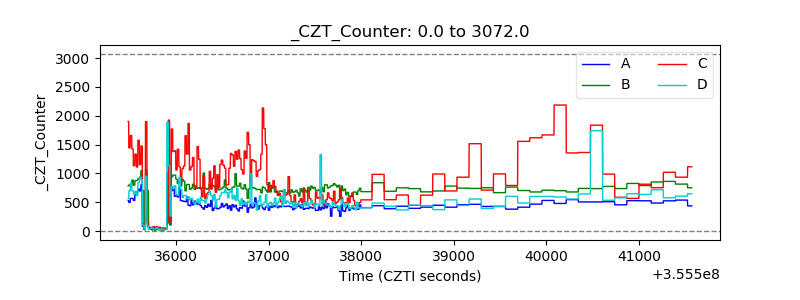 |
| +2.5 Volts monitor |  |
| +5 Volts monitor |  |
| _ROLL_ROT | 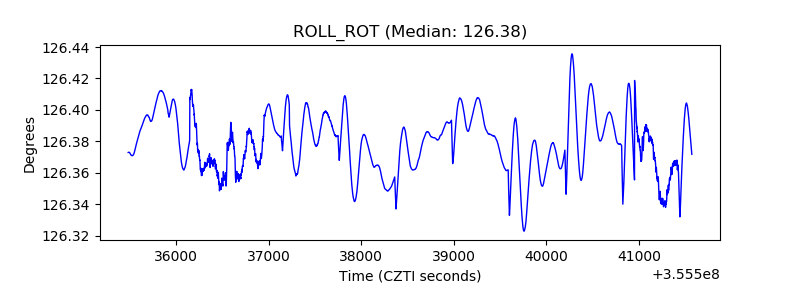 |
| _Roll_DEC | 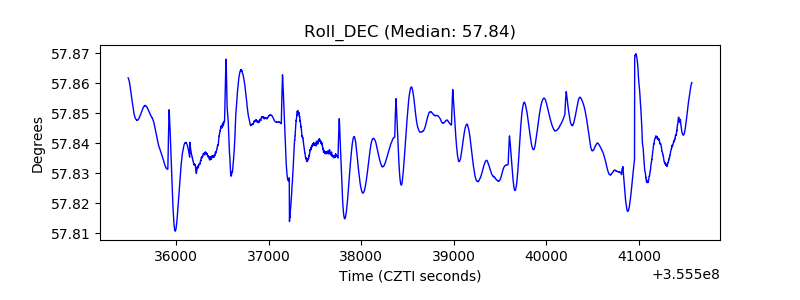 |
| _Roll_RA | 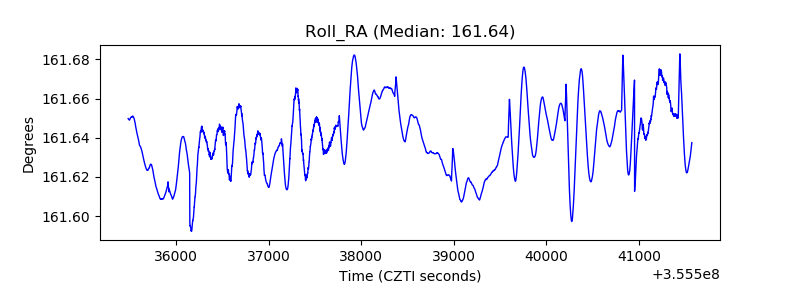 |
| Veto Counter | 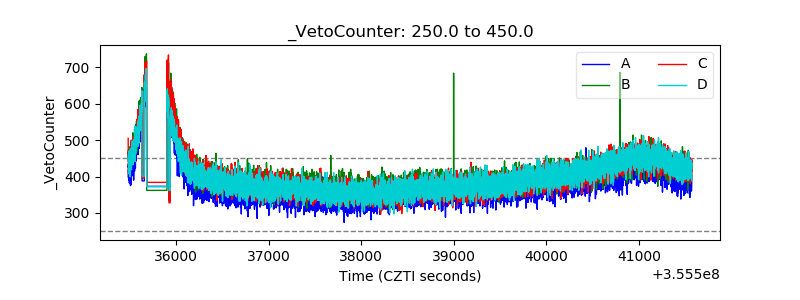 |