| Param | Original file | Final file |
|---|---|---|
| Filename | modeM0/AS1A10_102T10_9000004282_29900cztM0_level2.evt | modeM0/AS1A10_102T10_9000004282_29900cztM0_level2_quad_clean.evt |
| Size (bytes) | 123,883,200 | 30,628,800 |
| Size | 118.1 MB | 29.2 MB |
| Events in quadrant A | 751,817 | 208,796 |
| Events in quadrant B | 1,120,559 | 208,654 |
| Events in quadrant C | 1,023,951 | 199,966 |
| Events in quadrant D | 755,272 | 202,884 |
| Mode SS | |||
|---|---|---|---|
| Quadrant | BADHDUFLAG | Total packets | Discarded packets |
| A | 0 | 28 | 0 |
| B | 0 | 28 | 0 |
| C | 0 | 28 | 0 |
| D | 0 | 28 | 0 |
| Mode M9 | |||
|---|---|---|---|
| Quadrant | BADHDUFLAG | Total packets | Discarded packets |
| A | 0 | 3 | 0 |
| B | 0 | 4 | 0 |
| C | 0 | 4 | 0 |
| D | 0 | 4 | 0 |
| Mode M0 | |||
|---|---|---|---|
| Quadrant | BADHDUFLAG | Total packets | Discarded packets |
| A | 0 | 3016 | 1 |
| B | 0 | 4340 | 1 |
| C | 0 | 4073 | 1 |
| D | 0 | 3031 | 2 |
| Quadrant | Total seconds | Saturated seconds | Saturation percentage |
|---|---|---|---|
| A | 1440 | 20 | 1.388889% |
| B | 1440 | 26 | 1.805556% |
| C | 1440 | 46 | 3.194444% |
| D | 1439 | 2 | 0.138985% |
Noise dominated data is calculated using 1-second bins in cleaned event files. If a bin has >2000 counts, and if more than 50% of those come from <1% of pixels, then it is considered to be noise-dominated and hence unusable.
| Quadrant | # 1 sec bins | Bins with >0 counts | Bins with >2000 counts | High rate bins dominated by noise | Noise dominated (total time) | Noise dominated (detector-on time) | Marked lightcurve |
|---|---|---|---|---|---|---|---|
| A | 1440 | 1440 | 0 | 0 | 0.00% | 0.00% | 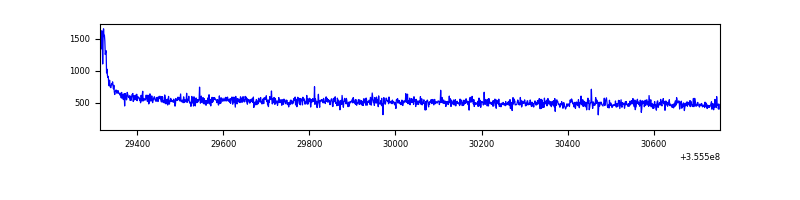 |
| B | 1440 | 1440 | 0 | 0 | 0.00% | 0.00% | 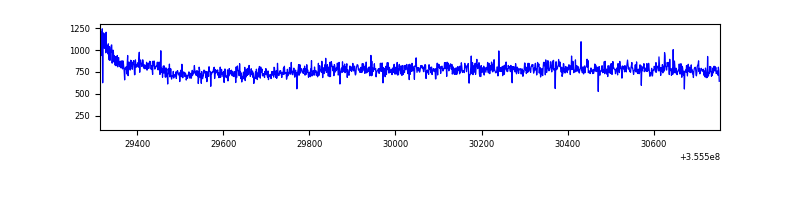 |
| C | 1440 | 1440 | 3 | 3 | 0.21% | 0.21% | 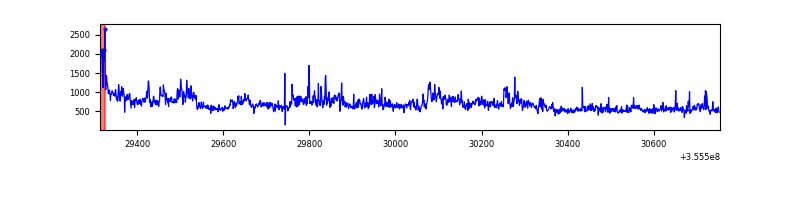 |
| D | 1439 | 1439 | 0 | 0 | 0.00% | 0.00% | 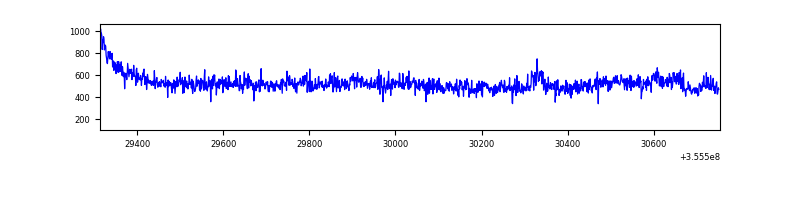 |
Top three noisy pixels from each quadrant. If the there are fewer than three noisy pixels in the level2.evt file, extra rows are filled as -1
| Pixel properties | Quadrant properties | ||||||
|---|---|---|---|---|---|---|---|
| Quadrant | DetID | PixID | Counts | Sigma | Mean | Median | Sigma |
| A | 8 | 192 | 13108 | 325.26 | 191 | 187 | 39.7 |
| A | 13 | 254 | 2412 | 56.01 | 191 | 187 | 39.7 |
| A | 3 | 137 | 1873 | 42.44 | 191 | 187 | 39.7 |
| B | 6 | 159 | 382554 | 10031.83 | 187 | 183 | 38.1 |
| B | 12 | 111 | 4528 | 113.99 | 187 | 183 | 38.1 |
| B | 11 | 111 | 4209 | 105.63 | 187 | 183 | 38.1 |
| C | 3 | 233 | 250613 | 5804.49 | 179 | 180 | 43.1 |
| C | 14 | 238 | 36980 | 852.94 | 179 | 180 | 43.1 |
| C | 15 | 208 | 21933 | 504.19 | 179 | 180 | 43.1 |
| D | 8 | 195 | 49294 | 1092.95 | 185 | 180 | 44.9 |
| D | 2 | 234 | 4393 | 93.75 | 185 | 180 | 44.9 |
| D | 7 | 223 | 4291 | 91.48 | 185 | 180 | 44.9 |
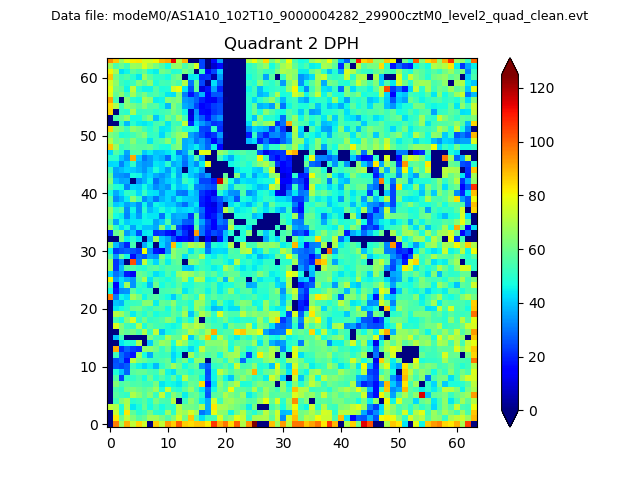
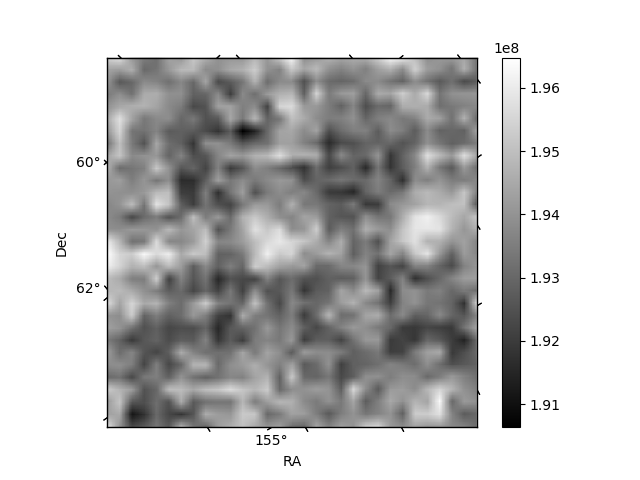
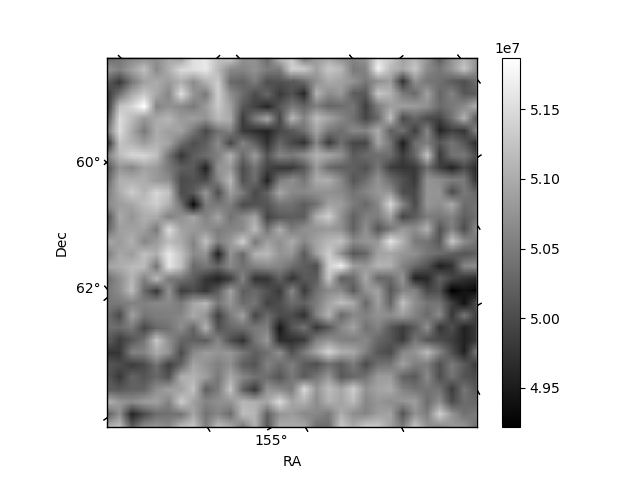
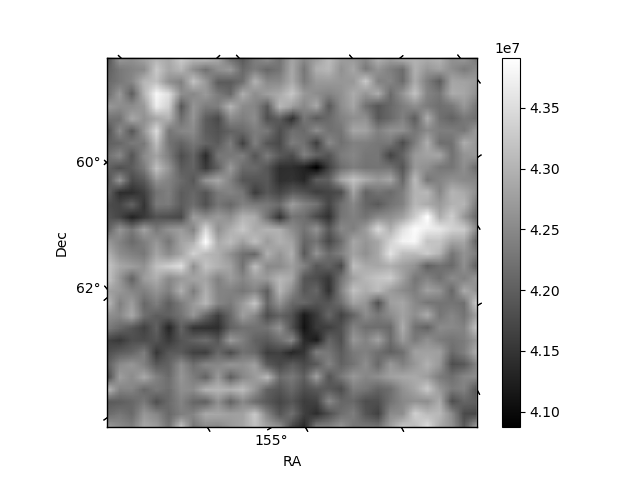
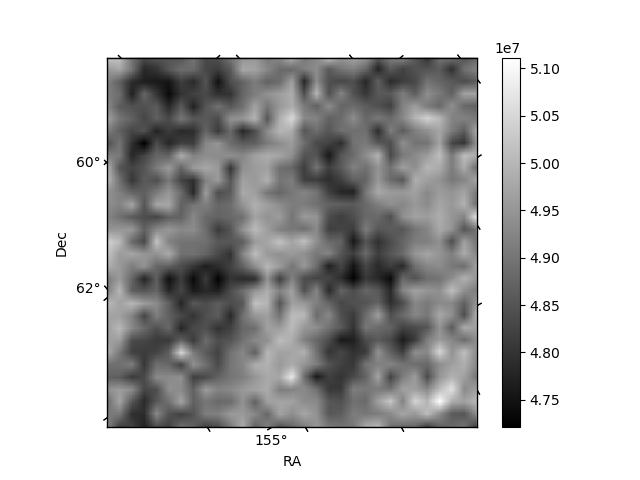
Histogram calculated using DETX and DETY for each event in the final _common_clean file
| Quadrant A | 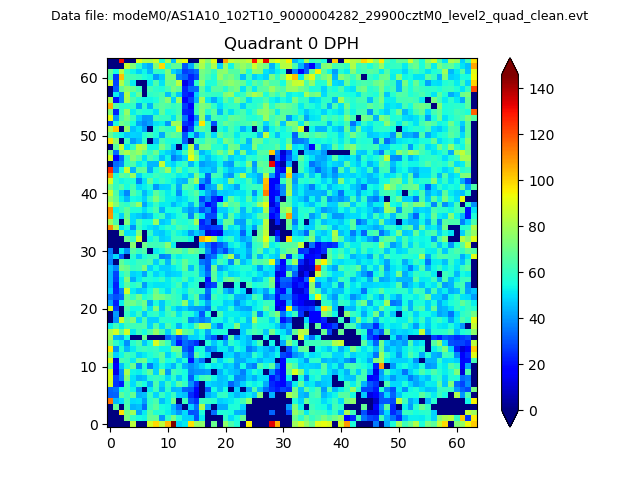 |
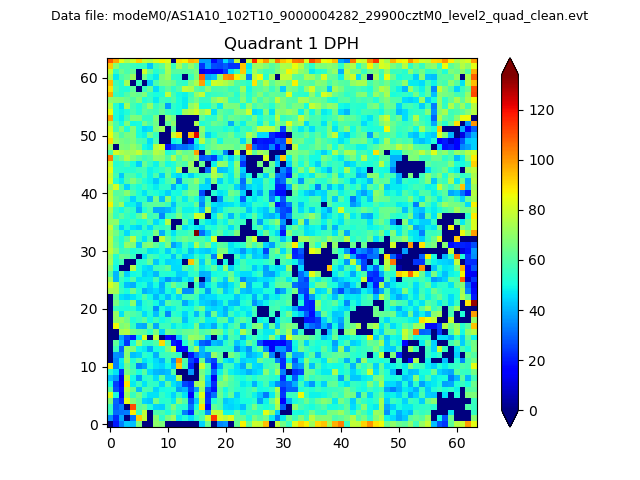 |
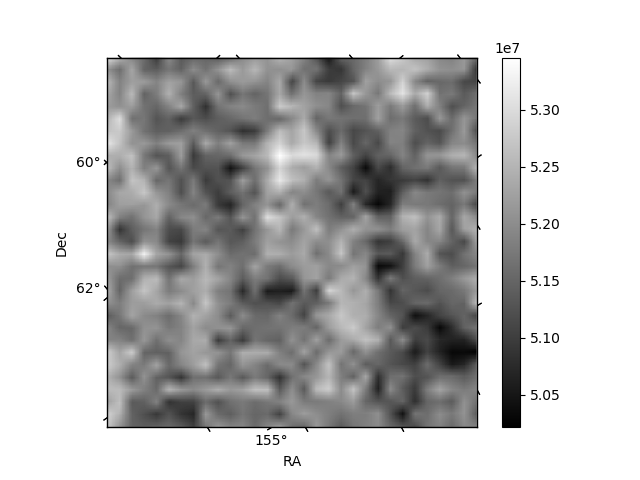
Quadrant B |
|---|---|---|---|
| Quadrant D | 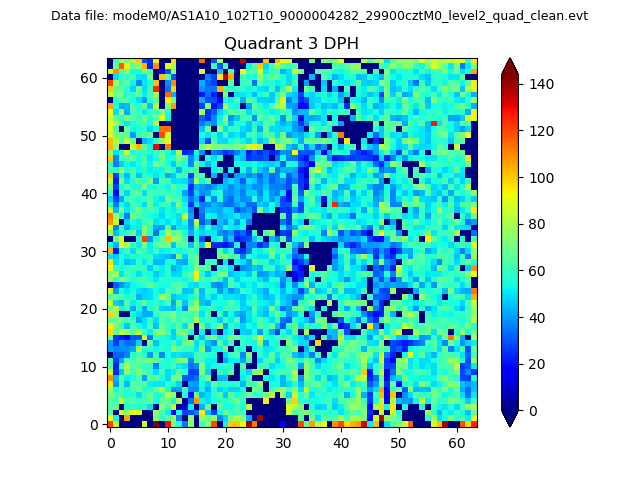 |
 |
Quadrant C |
| Plot type | Count rate plots | Images |
|---|---|---|
| Comparison with Poisson distribution Blue bars denote a histogram of data divided into 1 sec bins. Red curve is a Poisson curve with rate = median count rate of data. |
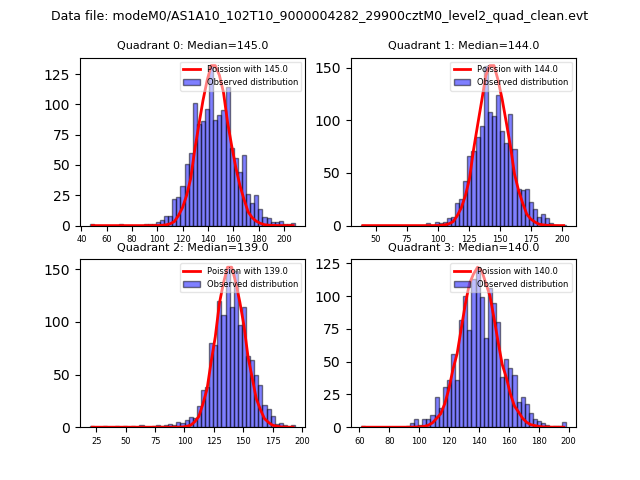 |
 |
| Quadrant-wise count rates Data is divided into 100 sec bins |
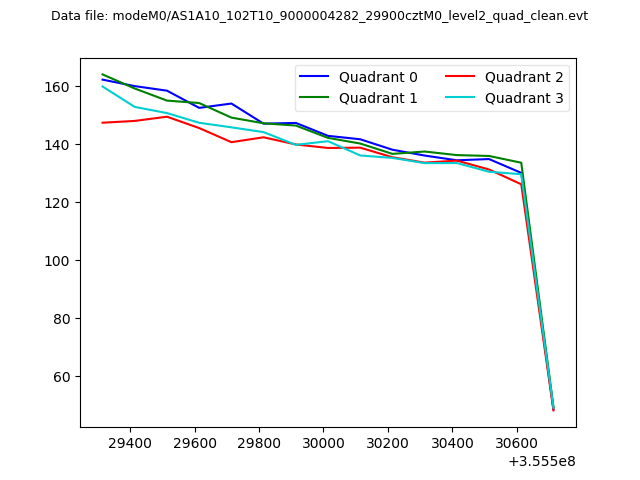 |
|
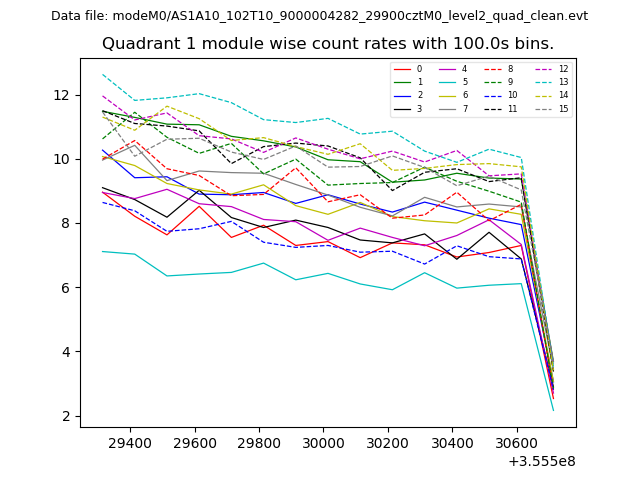
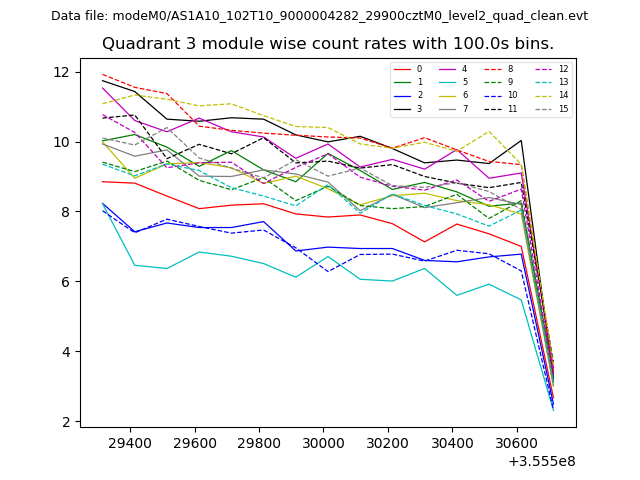
| Module-wise count rates for Quadrant A Data is divided into 100 sec bins |
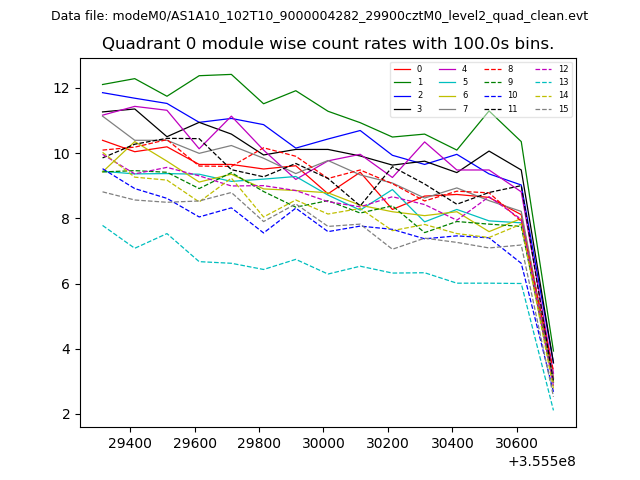 |
 |
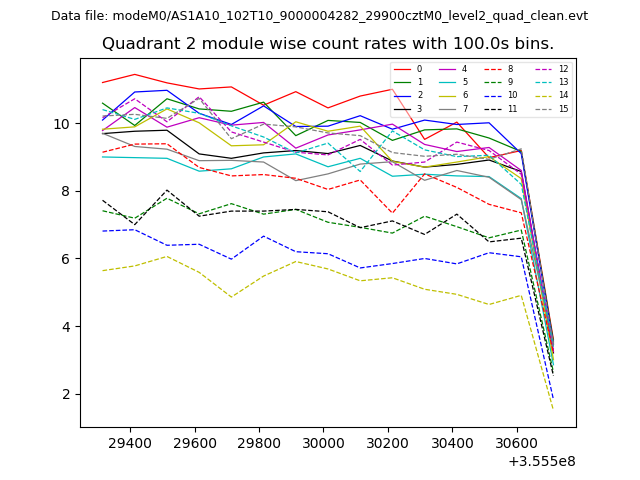
| Module-wise count rates for Quadrant B Data is divided into 100 sec bins |
 |
 |
| Module-wise count rates for Quadrant C Data is divided into 100 sec bins |
 |
 |
| Module-wise count rates for Quadrant D Data is divided into 100 sec bins |
 |
 |
| Parameter | Plot |
|---|---|
| CZT HV Monitor | 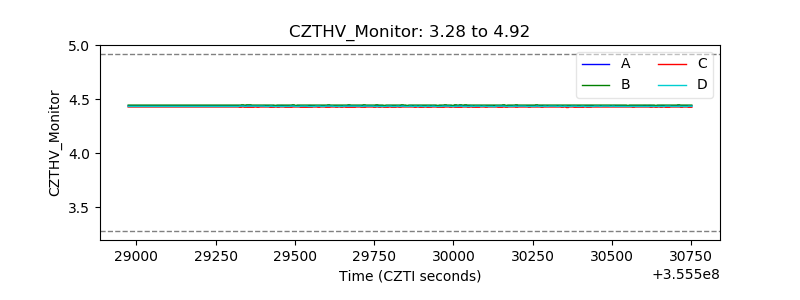 |
| D_VDD | 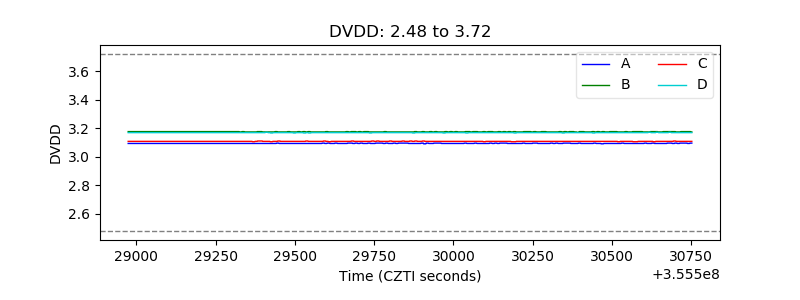 |
| Temperature 1 | 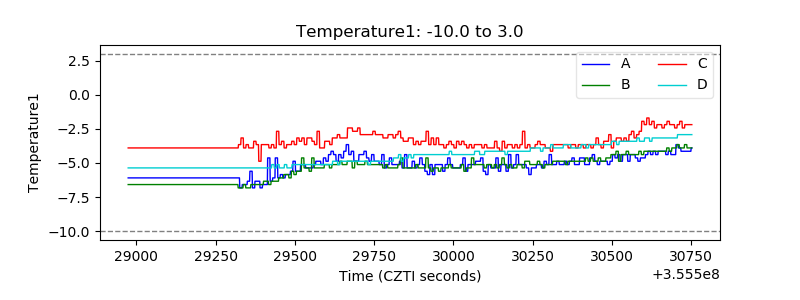 |
| Veto HV Monitor | 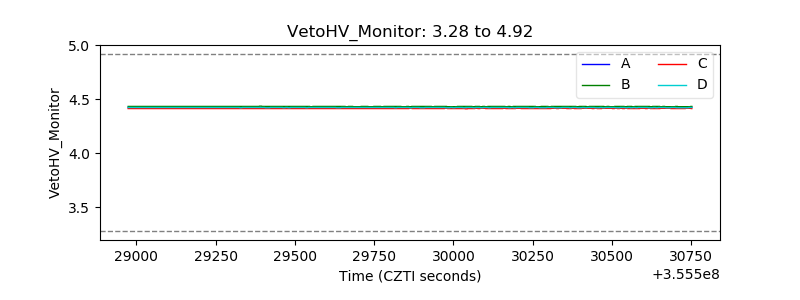 |
| Veto LLD | 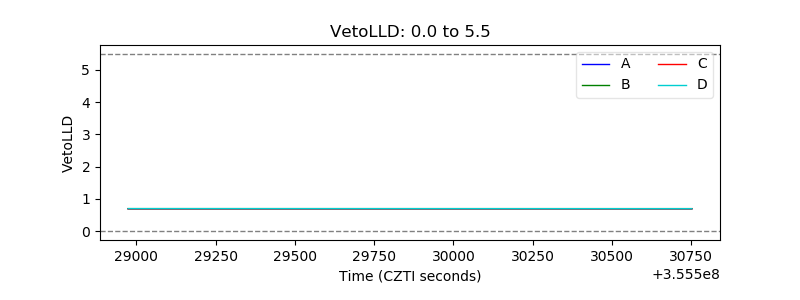 |
| Alpha Counter | 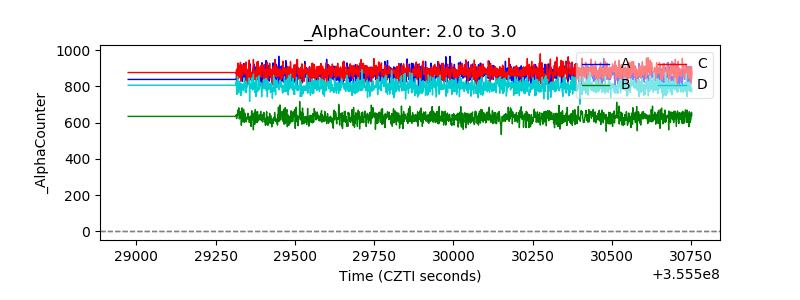 |
| _CPM_Rate | 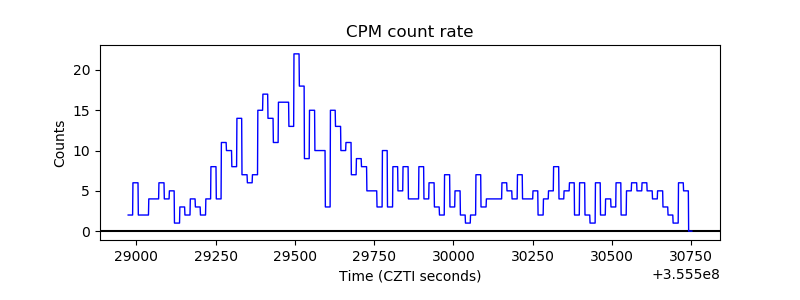 |
| CZT Counter | 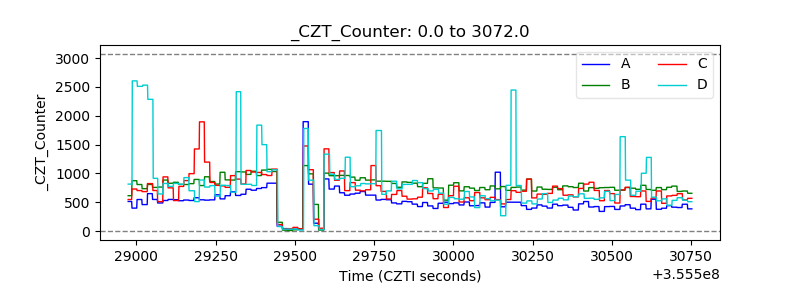 |
| +2.5 Volts monitor |  |
| +5 Volts monitor |  |
| _ROLL_ROT | 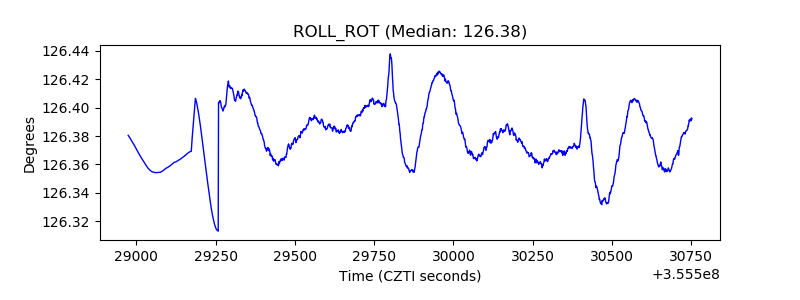 |
| _Roll_DEC | 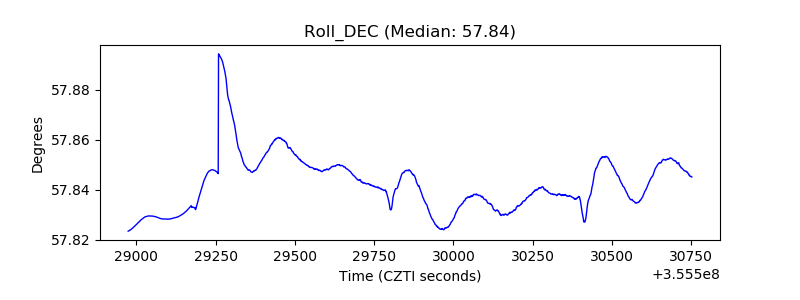 |
| _Roll_RA | 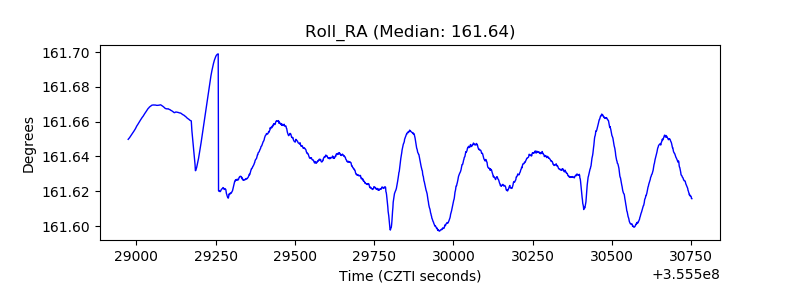 |
| Veto Counter | 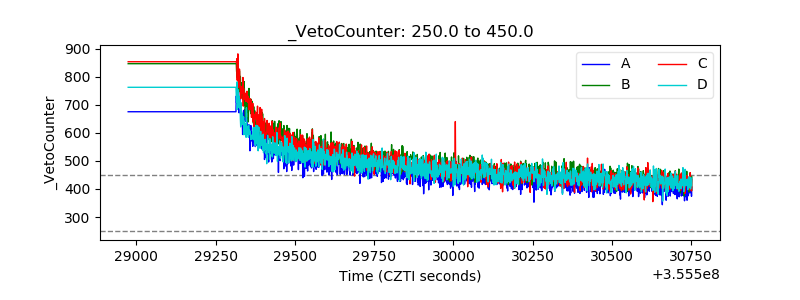 |