| Param | Original file | Final file |
|---|---|---|
| Filename | modeM0/AS1A10_102T10_9000004282_29902cztM0_level2.evt | modeM0/AS1A10_102T10_9000004282_29902cztM0_level2_quad_clean.evt |
| Size (bytes) | 600,641,280 | 103,613,760 |
| Size | 572.8 MB | 98.8 MB |
| Events in quadrant A | 3,428,976 | 691,259 |
| Events in quadrant B | 5,130,199 | 690,225 |
| Events in quadrant C | 4,689,658 | 659,264 |
| Events in quadrant D | 4,495,005 | 636,700 |
| Mode SS | |||
|---|---|---|---|
| Quadrant | BADHDUFLAG | Total packets | Discarded packets |
| A | 0 | 134 | 0 |
| B | 0 | 134 | 0 |
| C | 0 | 134 | 0 |
| D | 0 | 134 | 0 |
| Mode M9 | |||
|---|---|---|---|
| Quadrant | BADHDUFLAG | Total packets | Discarded packets |
| A | 0 | 11 | 0 |
| B | 0 | 11 | 0 |
| C | 0 | 11 | 0 |
| D | 0 | 11 | 0 |
| Mode M0 | |||
|---|---|---|---|
| Quadrant | BADHDUFLAG | Total packets | Discarded packets |
| A | 0 | 14110 | 2 |
| B | 0 | 19967 | 2 |
| C | 0 | 18524 | 2 |
| D | 0 | 17403 | 2 |
| Quadrant | Total seconds | Saturated seconds | Saturation percentage |
|---|---|---|---|
| A | 6601 | 96 | 1.454325% |
| B | 6602 | 111 | 1.681309% |
| C | 6602 | 302 | 4.574371% |
| D | 6602 | 386 | 5.846713% |
Noise dominated data is calculated using 1-second bins in cleaned event files. If a bin has >2000 counts, and if more than 50% of those come from <1% of pixels, then it is considered to be noise-dominated and hence unusable.
| Quadrant | # 1 sec bins | Bins with >0 counts | Bins with >2000 counts | High rate bins dominated by noise | Noise dominated (total time) | Noise dominated (detector-on time) | Marked lightcurve |
|---|---|---|---|---|---|---|---|
| A | 7646 | 6602 | 18 | 18 | 0.24% | 0.27% | 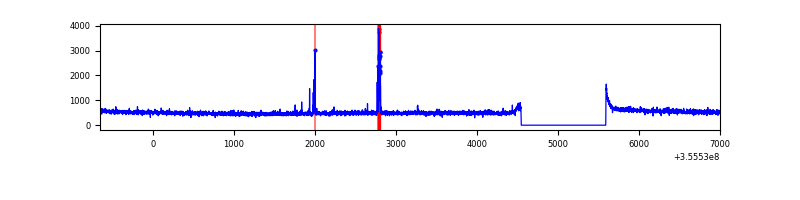 |
| B | 7647 | 6603 | 0 | 0 | 0.00% | 0.00% | 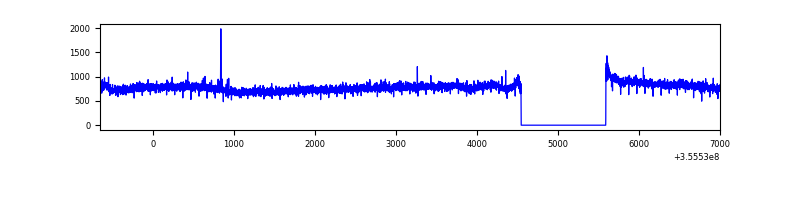 |
| C | 7647 | 6603 | 22 | 22 | 0.29% | 0.33% | 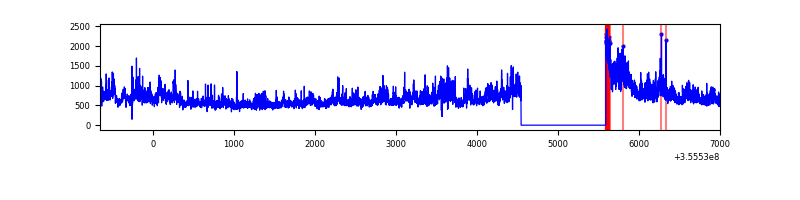 |
| D | 7647 | 6603 | 277 | 277 | 3.62% | 4.20% | 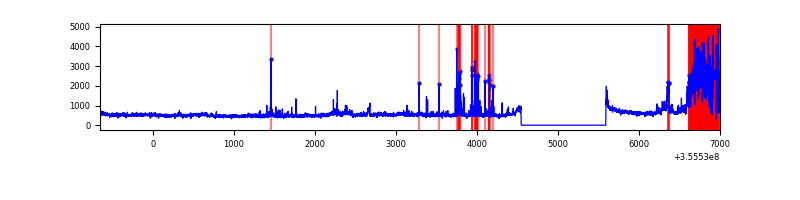 |
Top three noisy pixels from each quadrant. If the there are fewer than three noisy pixels in the level2.evt file, extra rows are filled as -1
| Pixel properties | Quadrant properties | ||||||
|---|---|---|---|---|---|---|---|
| Quadrant | DetID | PixID | Counts | Sigma | Mean | Median | Sigma |
| A | 15 | 174 | 86924 | 495.52 | 864 | 849 | 173.7 |
| A | 13 | 254 | 11424 | 60.88 | 864 | 849 | 173.7 |
| A | 8 | 192 | 10186 | 53.75 | 864 | 849 | 173.7 |
| B | 6 | 159 | 1787769 | 10952.0 | 849 | 828 | 163.2 |
| B | 12 | 111 | 20327 | 119.51 | 849 | 828 | 163.2 |
| B | 11 | 111 | 18548 | 108.6 | 849 | 828 | 163.2 |
| C | 3 | 233 | 1203901 | 6352.38 | 810 | 817 | 189.4 |
| C | 14 | 238 | 190647 | 1002.32 | 810 | 817 | 189.4 |
| C | 14 | 254 | 84272 | 440.65 | 810 | 817 | 189.4 |
| D | 7 | 238 | 902734 | 4621.66 | 818 | 796 | 195.2 |
| D | 8 | 195 | 270416 | 1381.57 | 818 | 796 | 195.2 |
| D | 2 | 250 | 130805 | 666.19 | 818 | 796 | 195.2 |
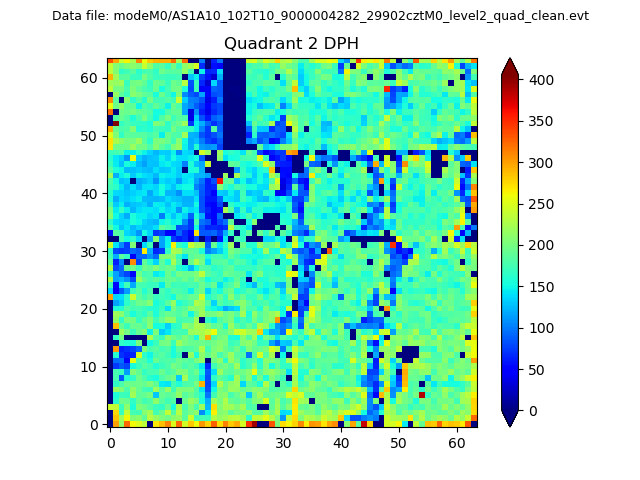
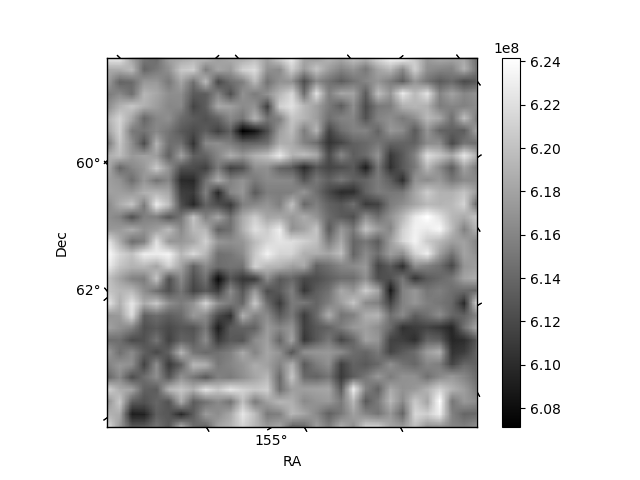
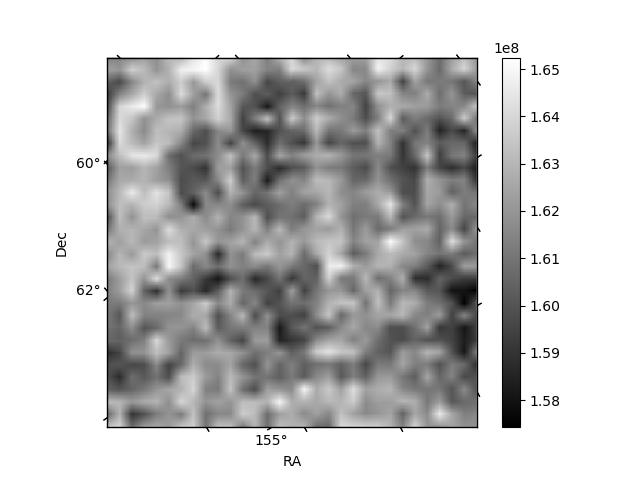
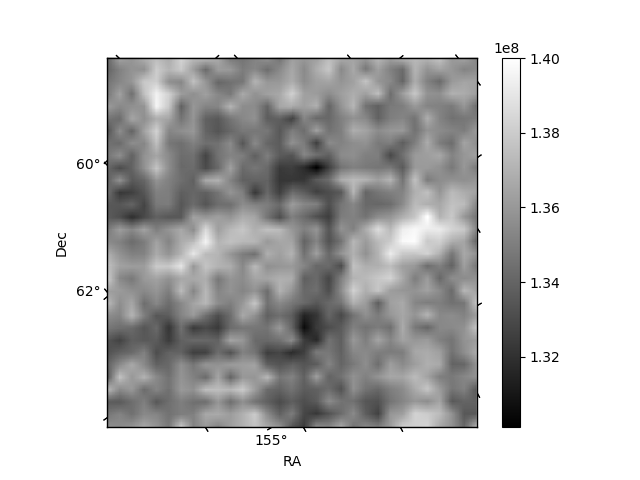
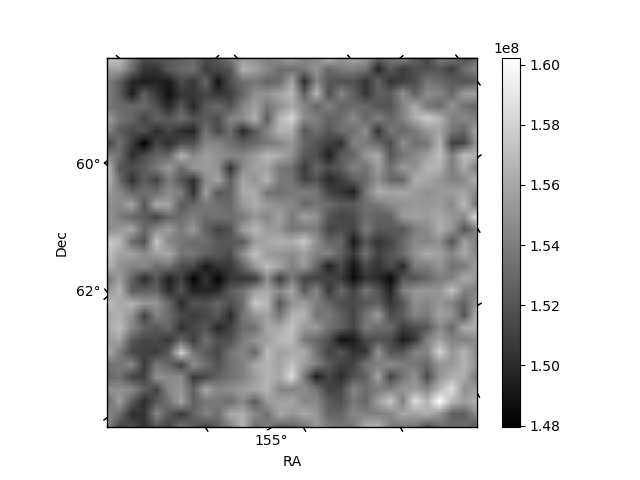
Histogram calculated using DETX and DETY for each event in the final _common_clean file
| Quadrant A | 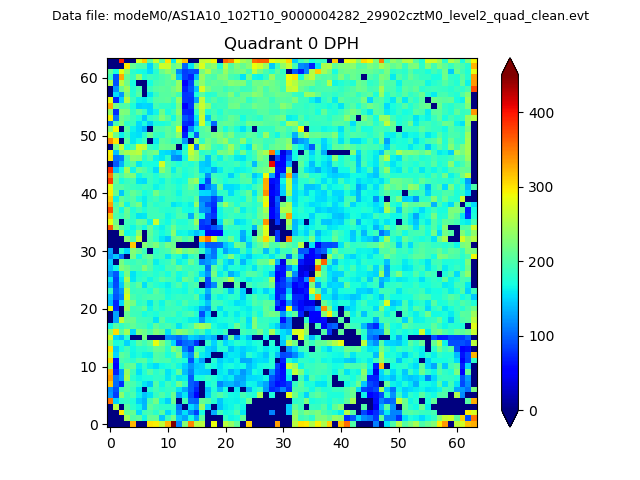 |
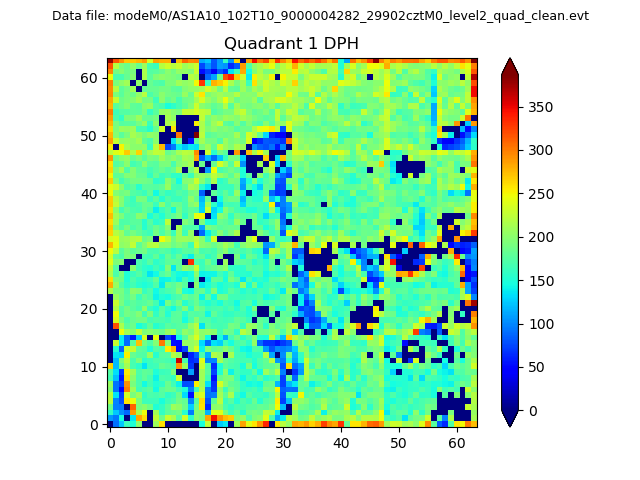 |
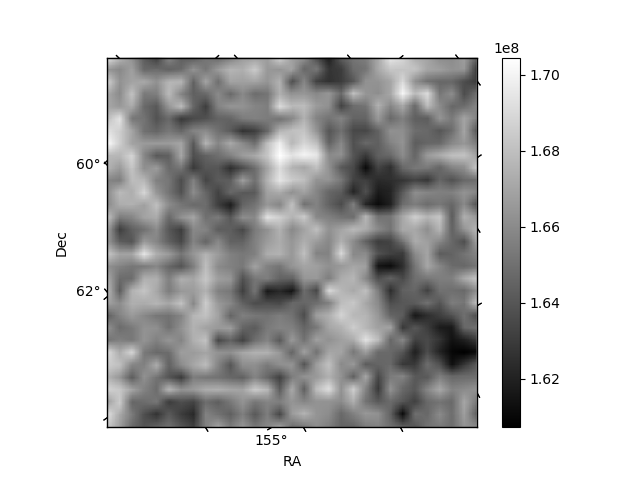
Quadrant B |
|---|---|---|---|
| Quadrant D | 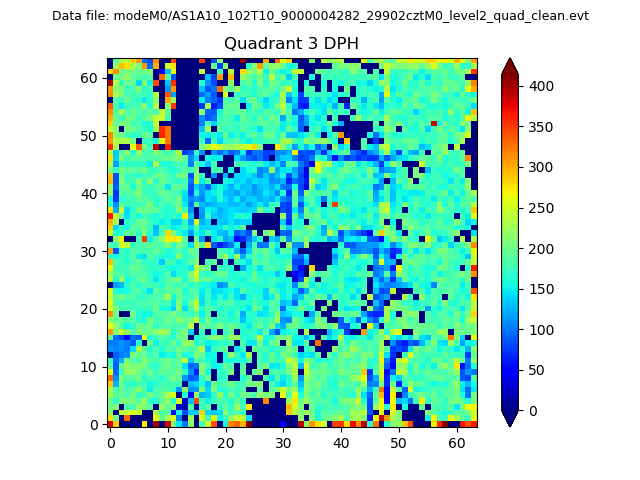 |
 |
Quadrant C |
| Plot type | Count rate plots | Images |
|---|---|---|
| Comparison with Poisson distribution Blue bars denote a histogram of data divided into 1 sec bins. Red curve is a Poisson curve with rate = median count rate of data. |
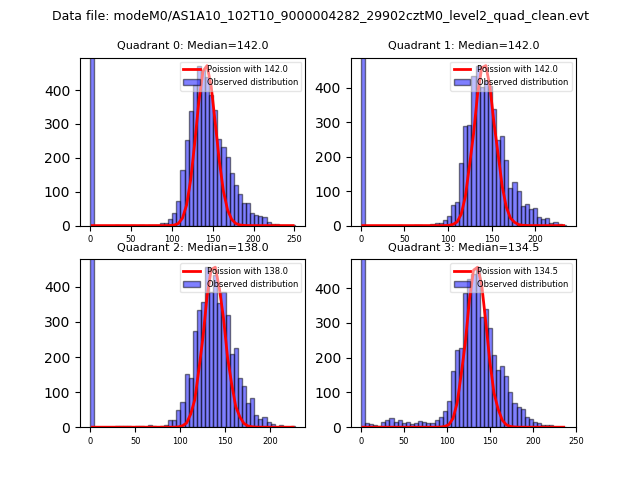 |
 |
| Quadrant-wise count rates Data is divided into 100 sec bins |
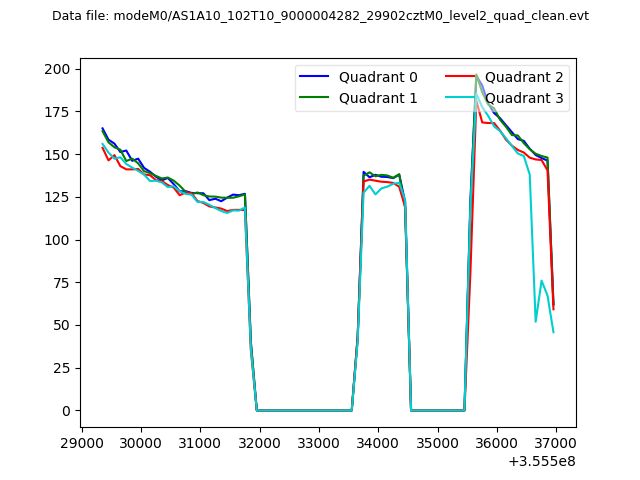 |
|
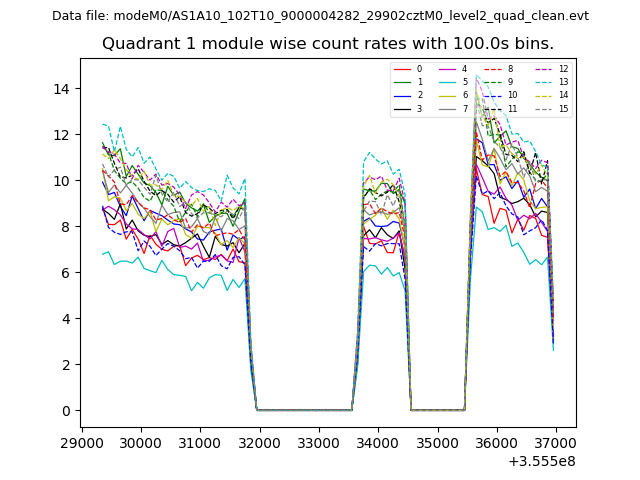
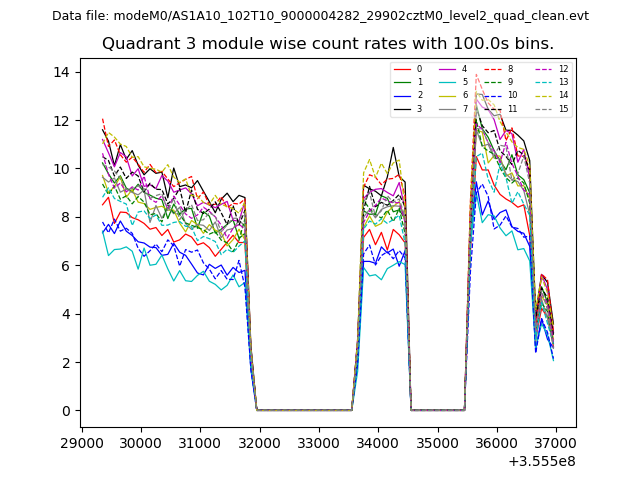
| Module-wise count rates for Quadrant A Data is divided into 100 sec bins |
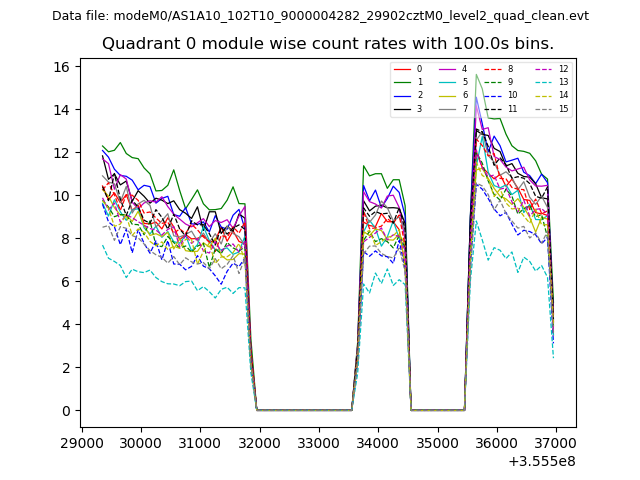 |
 |
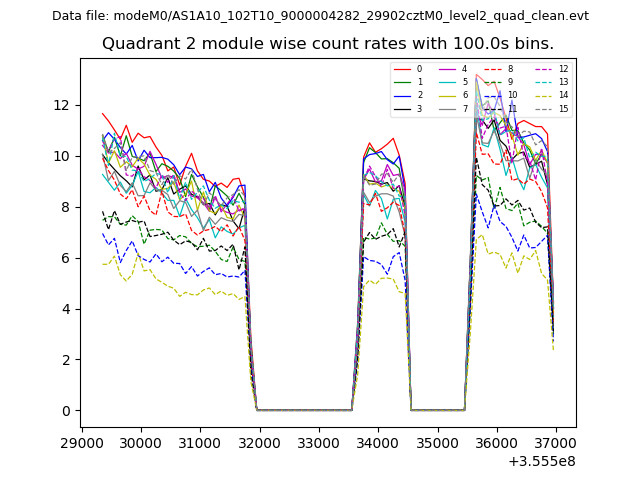
| Module-wise count rates for Quadrant B Data is divided into 100 sec bins |
 |
 |
| Module-wise count rates for Quadrant C Data is divided into 100 sec bins |
 |
 |
| Module-wise count rates for Quadrant D Data is divided into 100 sec bins |
 |
 |
| Parameter | Plot |
|---|---|
| CZT HV Monitor | 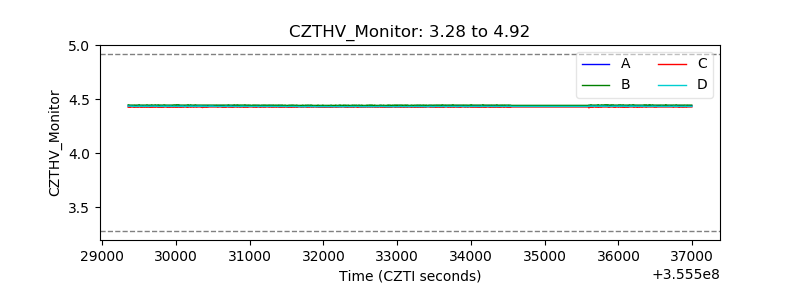 |
| D_VDD | 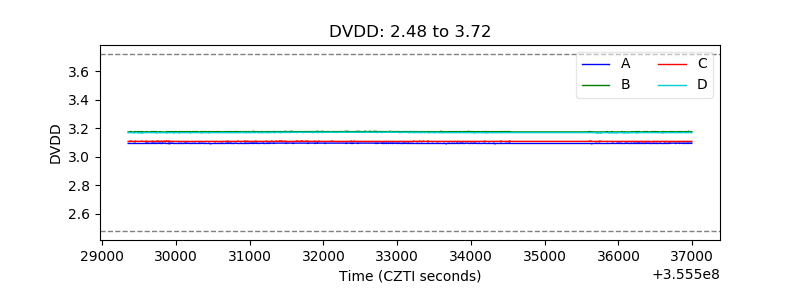 |
| Temperature 1 | 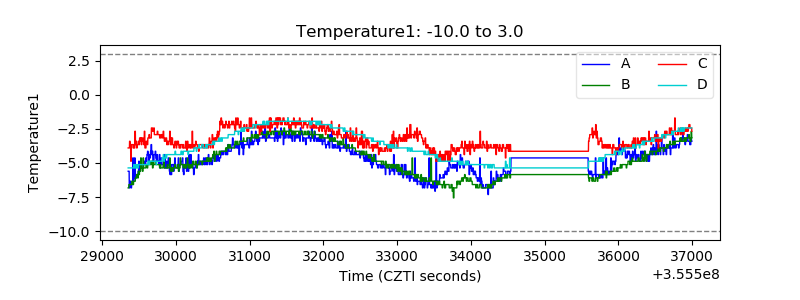 |
| Veto HV Monitor | 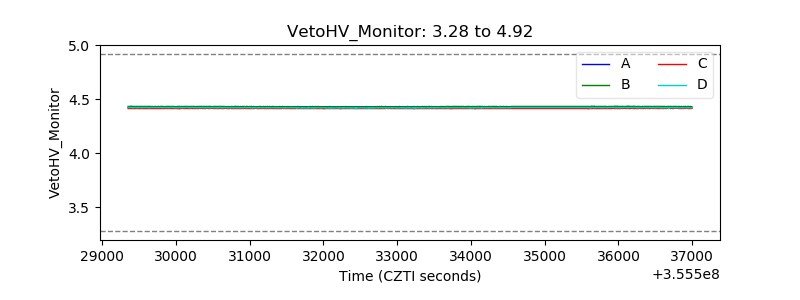 |
| Veto LLD |  |
| Alpha Counter | 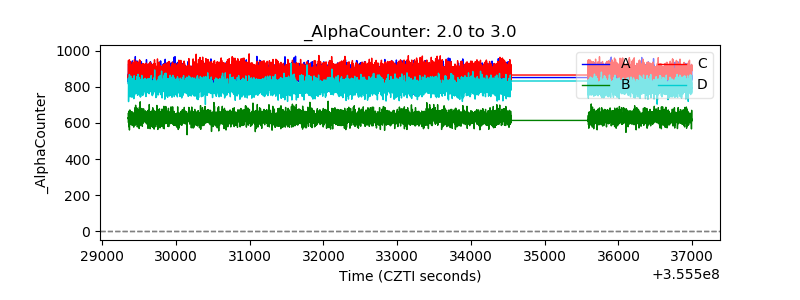 |
| _CPM_Rate | 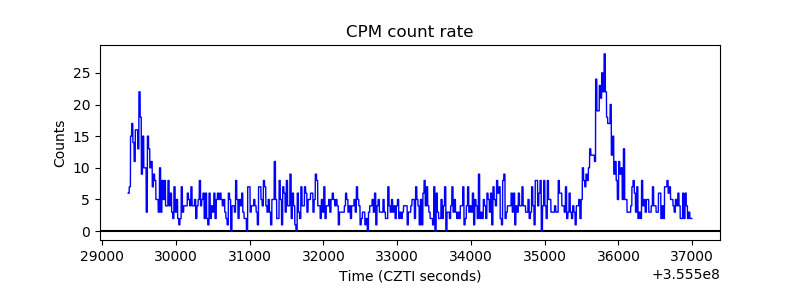 |
| CZT Counter | 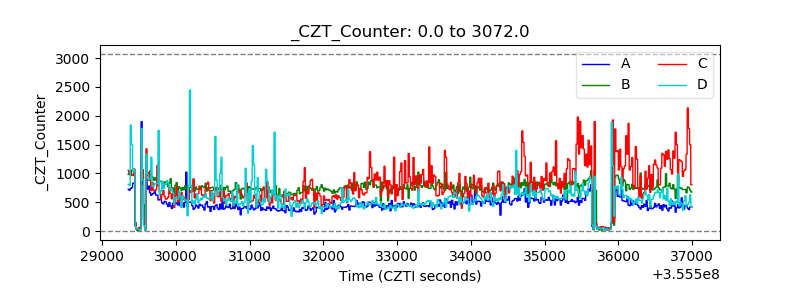 |
| +2.5 Volts monitor |  |
| +5 Volts monitor |  |
| _ROLL_ROT | 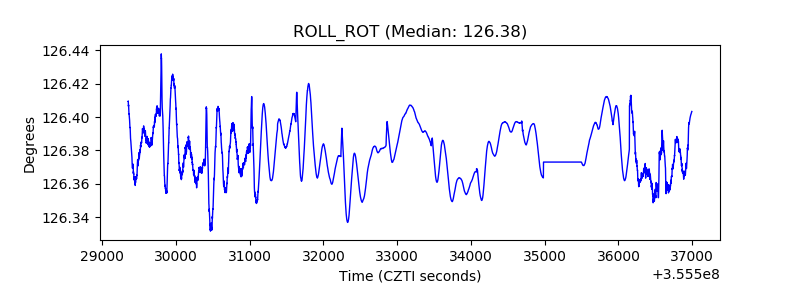 |
| _Roll_DEC | 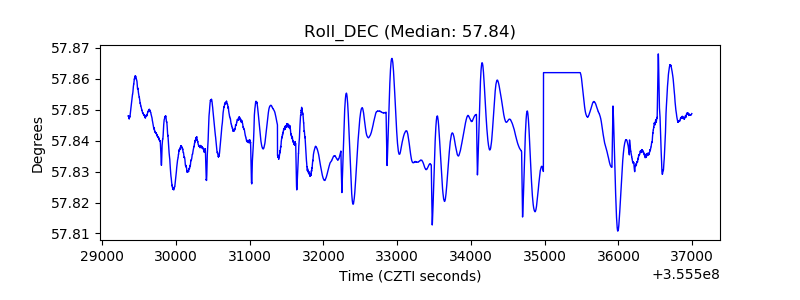 |
| _Roll_RA | 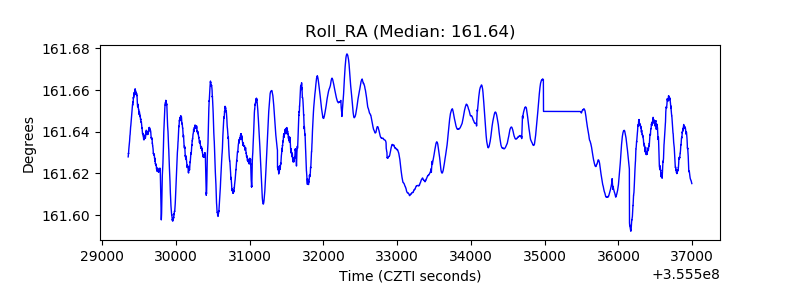 |
| Veto Counter | 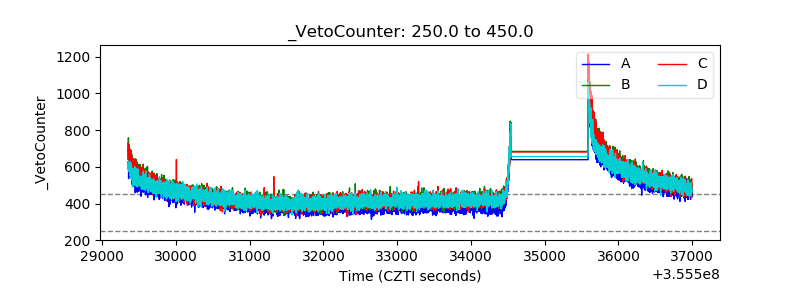 |