| Param | Original file | Final file |
|---|---|---|
| Filename | modeM0/AS1A10_102T10_9000004282_30069cztM0_level2.evt | modeM0/AS1A10_102T10_9000004282_30069cztM0_level2_quad_clean.evt |
| Size (bytes) | 52,151,040 | 13,150,080 |
| Size | 49.7 MB | 12.5 MB |
| Events in quadrant A | 327,422 | 87,454 |
| Events in quadrant B | 482,117 | 88,153 |
| Events in quadrant C | 342,701 | 83,711 |
| Events in quadrant D | 377,466 | 83,040 |
| Mode SS | |||
|---|---|---|---|
| Quadrant | BADHDUFLAG | Total packets | Discarded packets |
| A | 0 | 14 | 0 |
| B | 0 | 14 | 0 |
| C | 0 | 14 | 0 |
| D | 0 | 14 | 0 |
| Mode M0 | |||
|---|---|---|---|
| Quadrant | BADHDUFLAG | Total packets | Discarded packets |
| A | 0 | 1391 | 27 |
| B | 0 | 2073 | 48 |
| C | 0 | 1406 | 30 |
| D | 0 | 1529 | 31 |
| Quadrant | Total seconds | Saturated seconds | Saturation percentage |
|---|---|---|---|
| A | 680 | 0 | 0.000000% |
| B | 678 | 0 | 0.000000% |
| C | 680 | 3 | 0.441176% |
| D | 679 | 4 | 0.589102% |
Noise dominated data is calculated using 1-second bins in cleaned event files. If a bin has >2000 counts, and if more than 50% of those come from <1% of pixels, then it is considered to be noise-dominated and hence unusable.
| Quadrant | # 1 sec bins | Bins with >0 counts | Bins with >2000 counts | High rate bins dominated by noise | Noise dominated (total time) | Noise dominated (detector-on time) | Marked lightcurve |
|---|---|---|---|---|---|---|---|
| A | 688 | 685 | 0 | 0 | 0.00% | 0.00% | 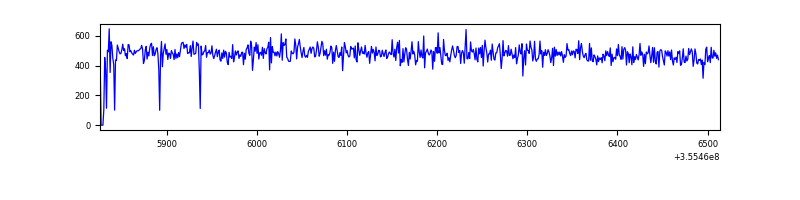 |
| B | 688 | 684 | 0 | 0 | 0.00% | 0.00% | 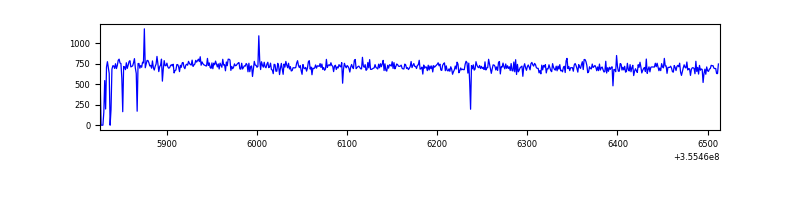 |
| C | 682 | 682 | 0 | 0 | 0.00% | 0.00% | 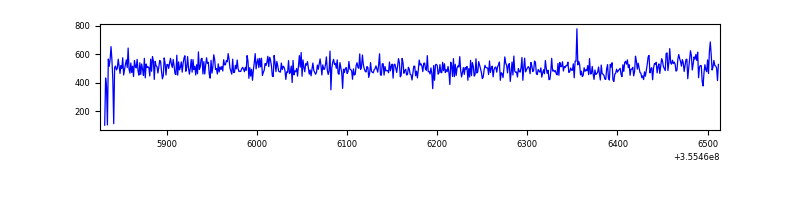 |
| D | 682 | 681 | 2 | 2 | 0.29% | 0.29% | 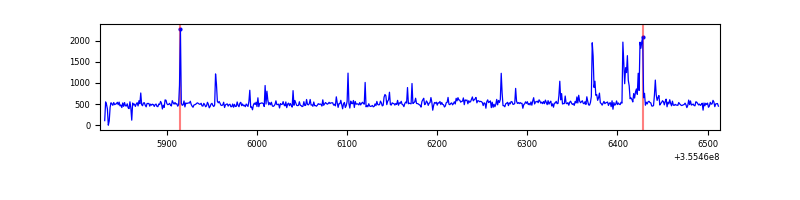 |
Top three noisy pixels from each quadrant. If the there are fewer than three noisy pixels in the level2.evt file, extra rows are filled as -1
| Pixel properties | Quadrant properties | ||||||
|---|---|---|---|---|---|---|---|
| Quadrant | DetID | PixID | Counts | Sigma | Mean | Median | Sigma |
| A | 13 | 254 | 995 | 46.99 | 84 | 82 | 19.4 |
| A | 3 | 137 | 847 | 39.38 | 84 | 82 | 19.4 |
| A | 0 | 226 | 718 | 32.74 | 84 | 82 | 19.4 |
| B | 6 | 159 | 156046 | 8634.34 | 82 | 80 | 18.1 |
| B | 11 | 111 | 1978 | 105.07 | 82 | 80 | 18.1 |
| B | 12 | 111 | 1907 | 101.14 | 82 | 80 | 18.1 |
| C | 14 | 238 | 12462 | 584.09 | 81 | 81 | 21.2 |
| C | 3 | 233 | 10222 | 478.41 | 81 | 81 | 21.2 |
| C | 2 | 114 | 1597 | 71.52 | 81 | 81 | 21.2 |
| D | 2 | 250 | 29487 | 1355.2 | 82 | 79 | 21.7 |
| D | 8 | 195 | 23577 | 1082.85 | 82 | 79 | 21.7 |
| D | 13 | 104 | 5869 | 266.82 | 82 | 79 | 21.7 |
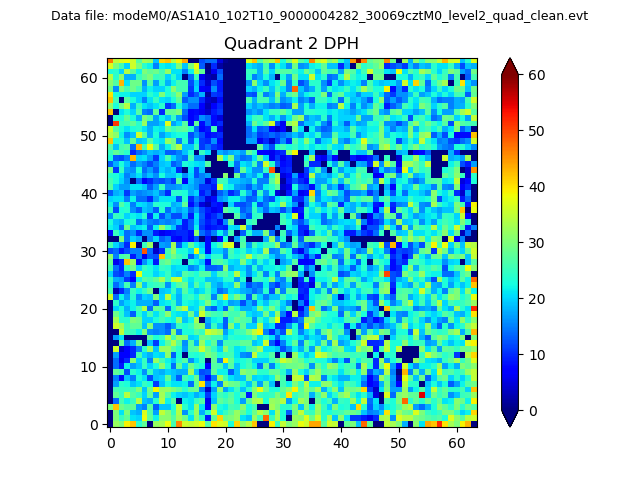
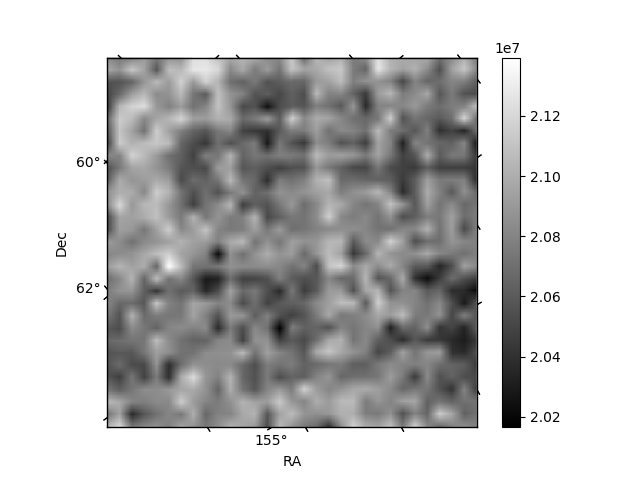
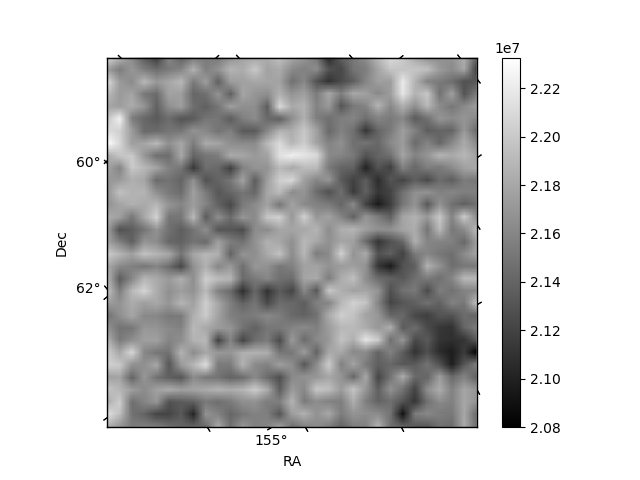
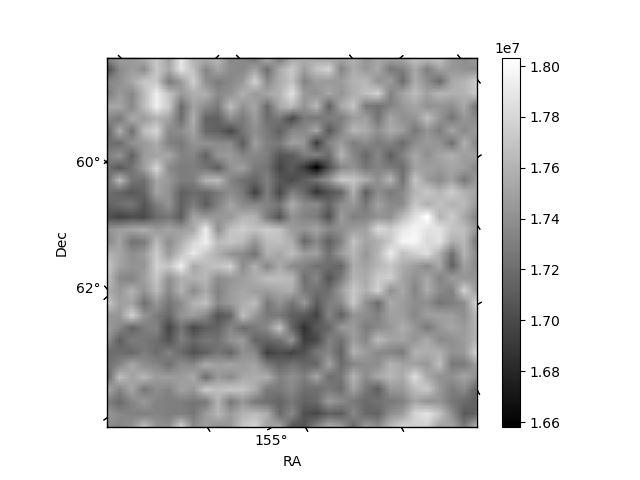
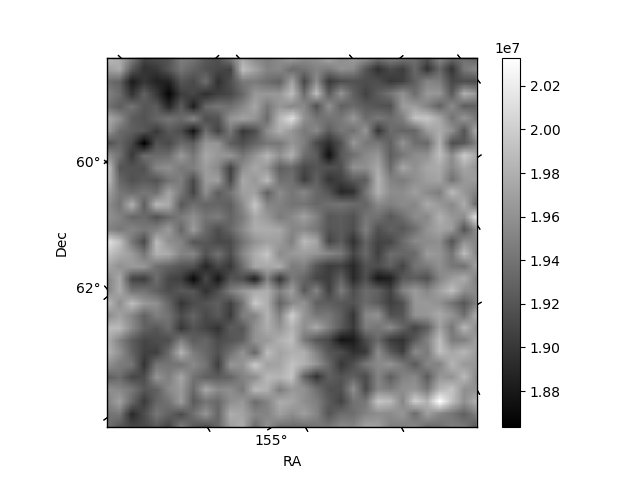
Histogram calculated using DETX and DETY for each event in the final _common_clean file
| Quadrant A | 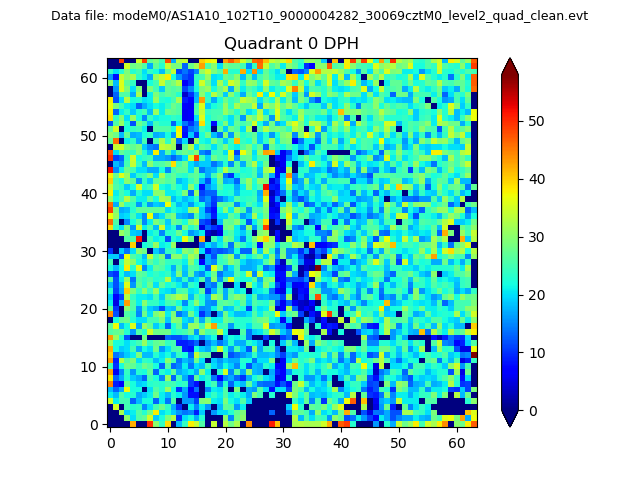 |
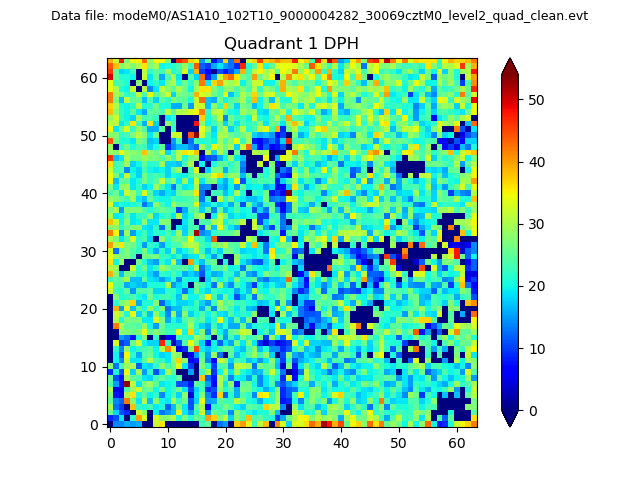 |
Quadrant B |
|---|---|---|---|
| Quadrant D | 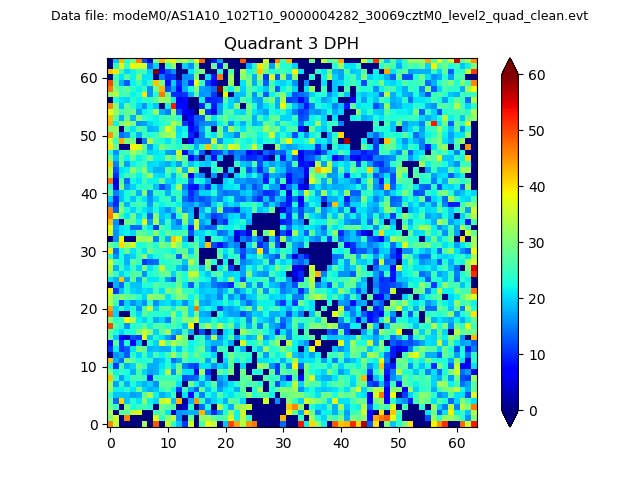 |
 |
Quadrant C |
| Plot type | Count rate plots | Images |
|---|---|---|
| Comparison with Poisson distribution Blue bars denote a histogram of data divided into 1 sec bins. Red curve is a Poisson curve with rate = median count rate of data. |
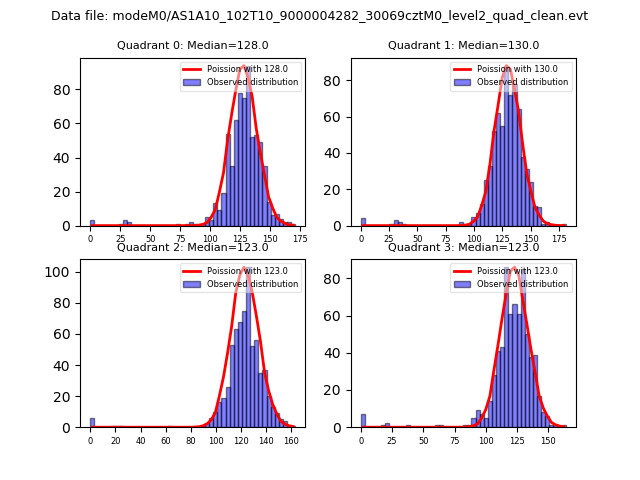 |
 |
| Quadrant-wise count rates Data is divided into 100 sec bins |
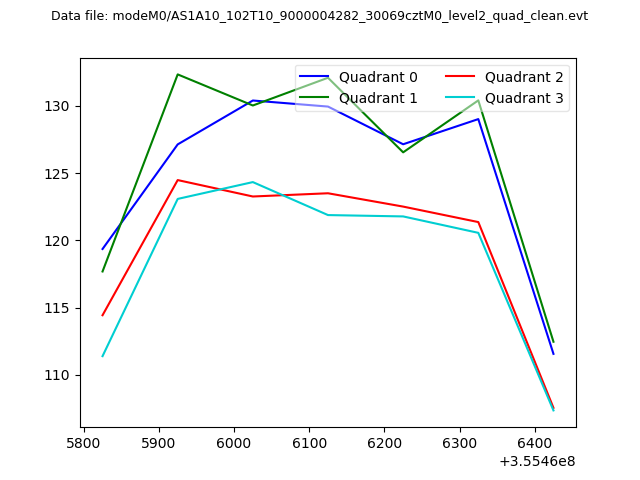 |
|
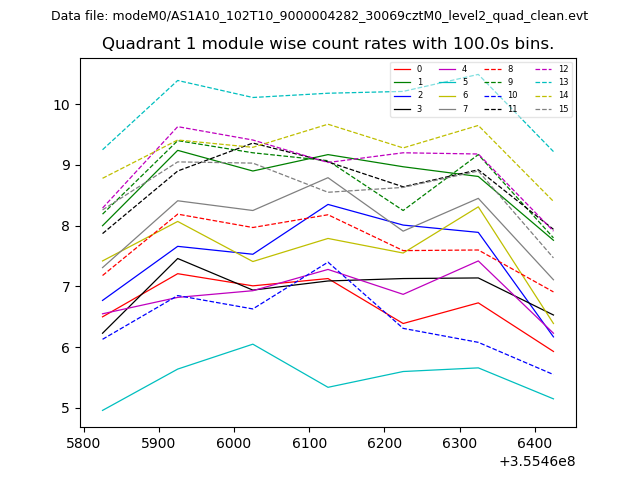
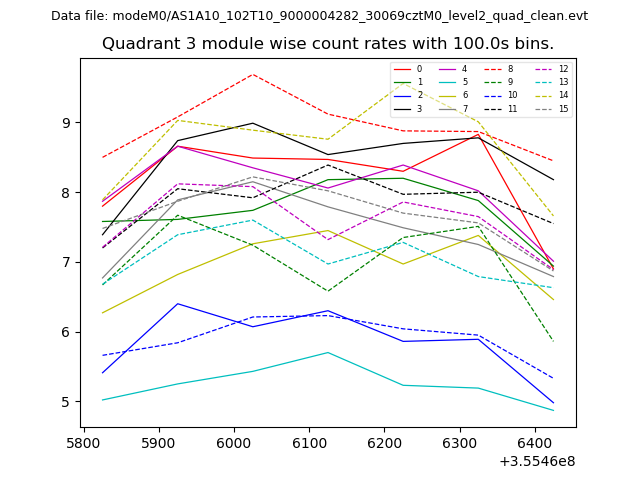
| Module-wise count rates for Quadrant A Data is divided into 100 sec bins |
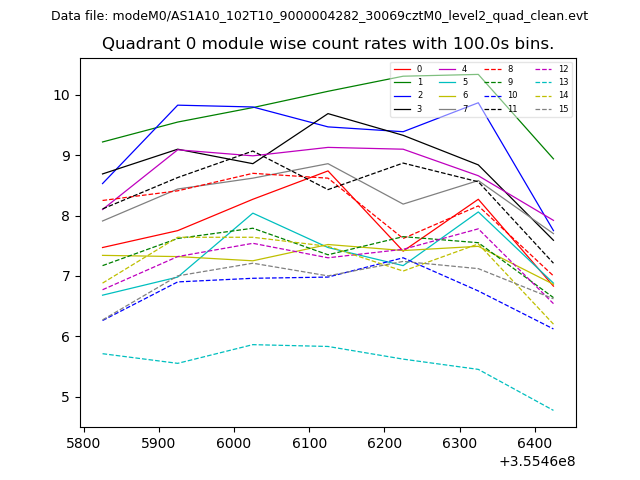 |
 |
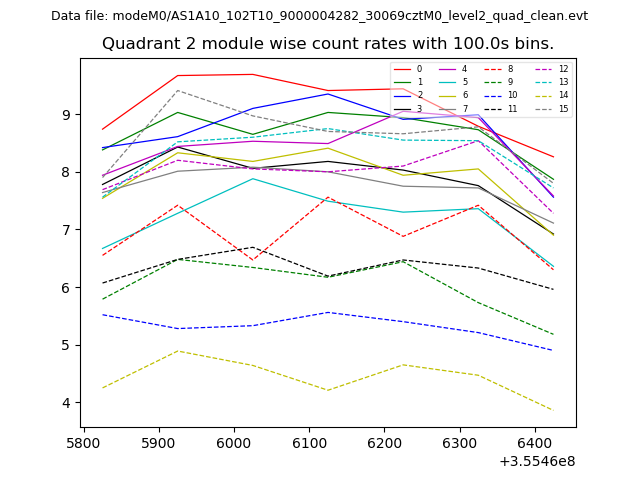
| Module-wise count rates for Quadrant B Data is divided into 100 sec bins |
 |
 |
| Module-wise count rates for Quadrant C Data is divided into 100 sec bins |
 |
 |
| Module-wise count rates for Quadrant D Data is divided into 100 sec bins |
 |
 |
| Parameter | Plot |
|---|---|
| CZT HV Monitor | 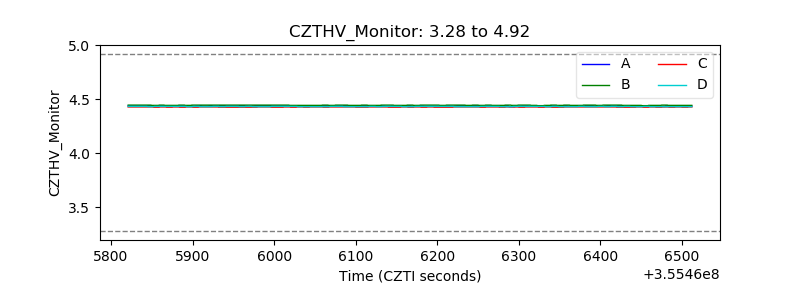 |
| D_VDD | 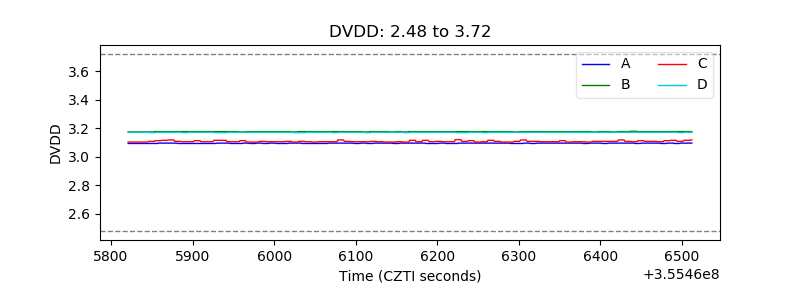 |
| Temperature 1 | 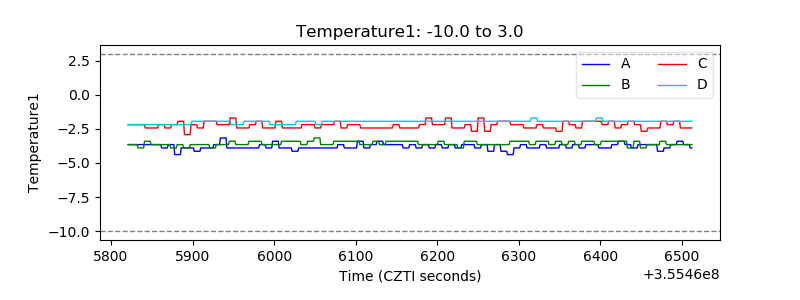 |
| Veto HV Monitor | 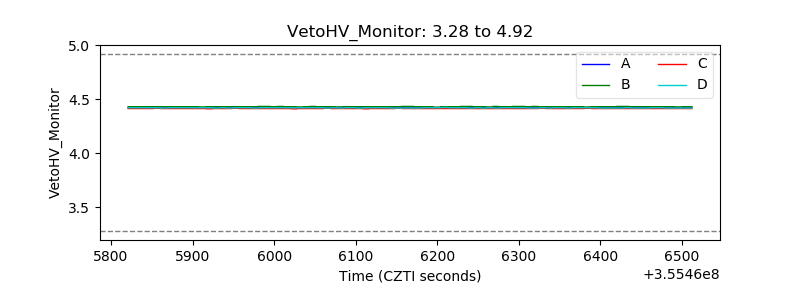 |
| Veto LLD |  |
| Alpha Counter | 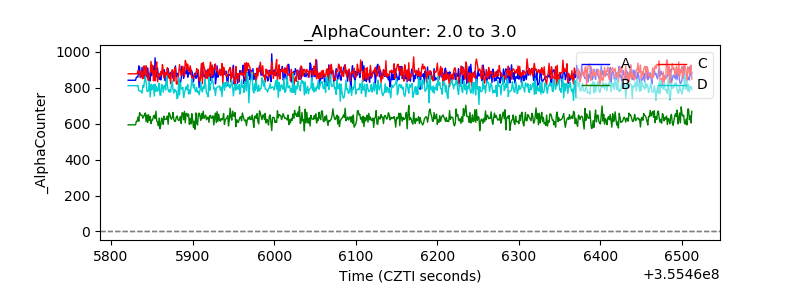 |
| _CPM_Rate | 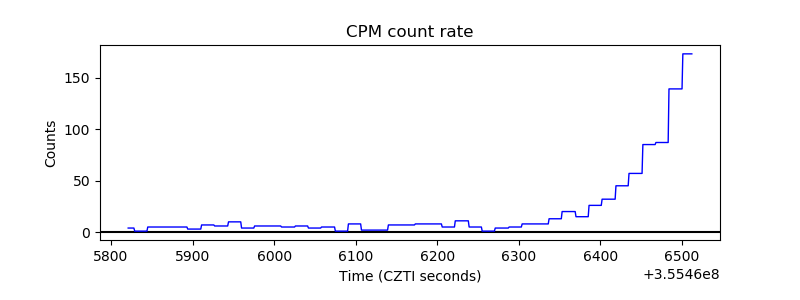 |
| CZT Counter | 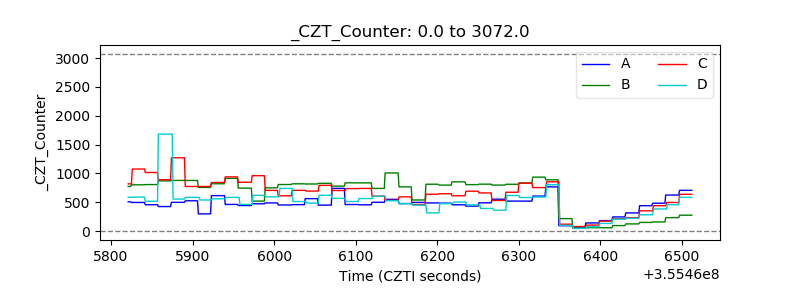 |
| +2.5 Volts monitor |  |
| +5 Volts monitor | 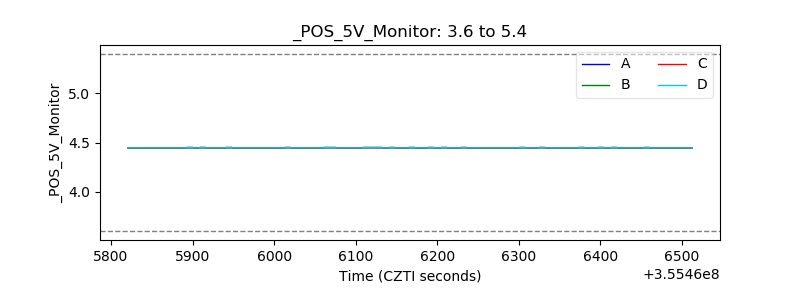 |
| _ROLL_ROT | 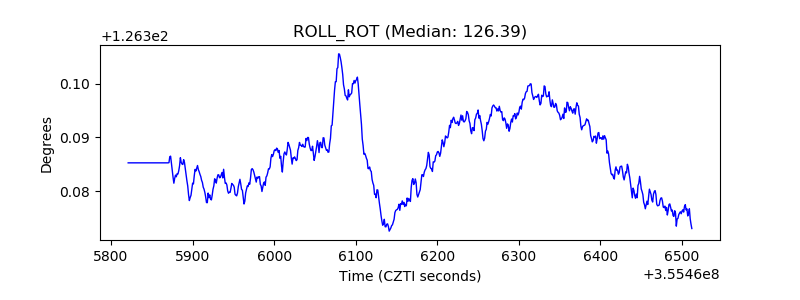 |
| _Roll_DEC | 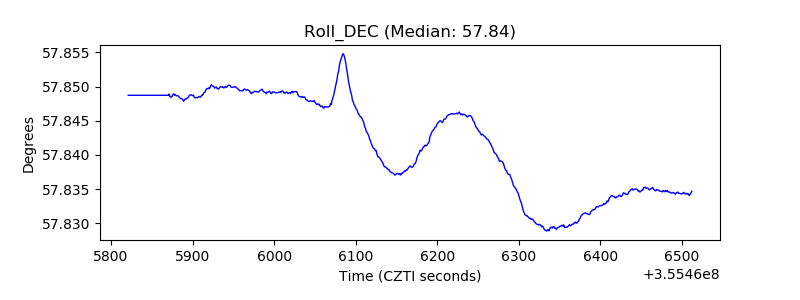 |
| _Roll_RA | 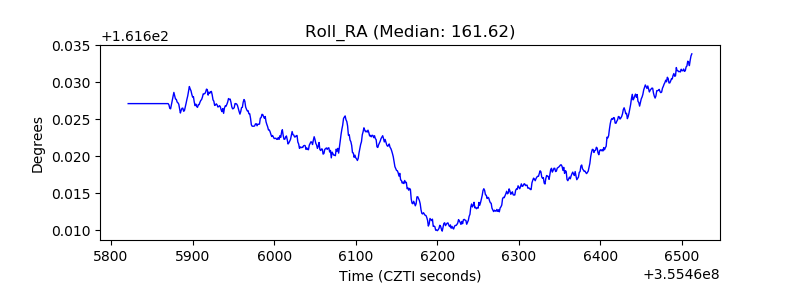 |
| Veto Counter | 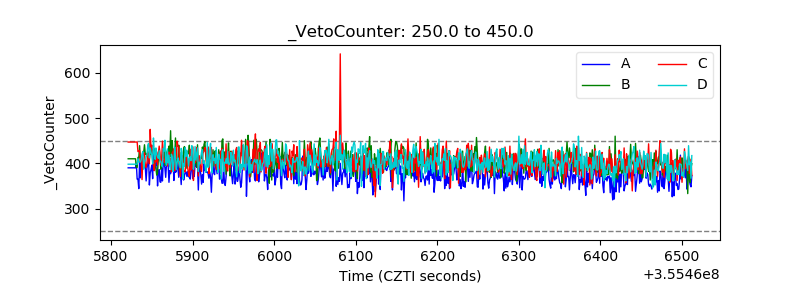 |