| Param | Original file | Final file |
|---|---|---|
| Filename | modeM0/AS1A10_102T12_9000004284cztM0_level2.fits | modeM0/AS1A10_102T12_9000004284cztM0_level2_quad_clean.evt |
| Size (bytes) | 811,448,640 | 521,461,440 |
| Size | 773.9 MB | 497.3 MB |
| Events in quadrant A | 5,157,360 | 2,795,501 |
| Events in quadrant B | 4,853,394 | 2,773,494 |
| Events in quadrant C | 4,916,960 | 2,605,910 |
| Events in quadrant D | 4,349,912 | 2,319,103 |
| Mode M9 | |||
|---|---|---|---|
| Quadrant | BADHDUFLAG | Total packets | Discarded packets |
| A | 1 | 140261552437288 | 140260746985518 |
| B | 1 | 140261552437288 | 140260746985518 |
| C | 1 | 140261552437288 | 140260746985518 |
| D | 1 | 140261552437288 | 140260746985518 |
| Mode M0 | |||
|---|---|---|---|
| Quadrant | BADHDUFLAG | Total packets | Discarded packets |
| A | 0 | 168678 | 0 |
| B | 0 | 236329 | 0 |
| C | 0 | 226818 | 0 |
| D | 0 | 221885 | 0 |
| Mode SS | |||
|---|---|---|---|
| Quadrant | BADHDUFLAG | Total packets | Discarded packets |
| A | 0 | 1570 | 0 |
| B | 0 | 1570 | 0 |
| C | 0 | 1570 | 0 |
| D | 0 | 1570 | 0 |
| Quadrant | Total seconds | Saturated seconds | Saturation percentage |
|---|---|---|---|
| A | 77230 | 1364 | 1.766153% |
| B | 77230 | 1847 | 2.391558% |
| C | 77230 | 4474 | 5.793086% |
| D | 77229 | 4844 | 6.272255% |
Noise dominated data is calculated using 1-second bins in cleaned event files. If a bin has >2000 counts, and if more than 50% of those come from <1% of pixels, then it is considered to be noise-dominated and hence unusable.
| Quadrant | # 1 sec bins | Bins with >0 counts | Bins with >2000 counts | High rate bins dominated by noise | Noise dominated (total time) | Noise dominated (detector-on time) | Marked lightcurve |
|---|---|---|---|---|---|---|---|
| A | 82518 | 71819 | 0 | 0 | 0.00% | 0.00% | 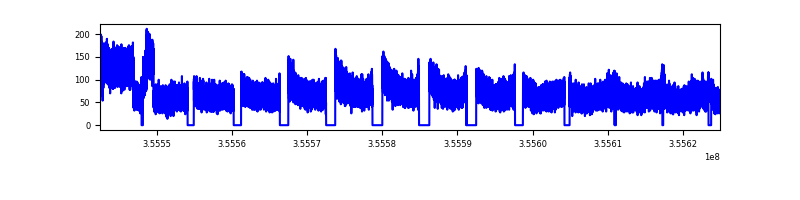 |
| B | 82518 | 71818 | 0 | 0 | 0.00% | 0.00% | 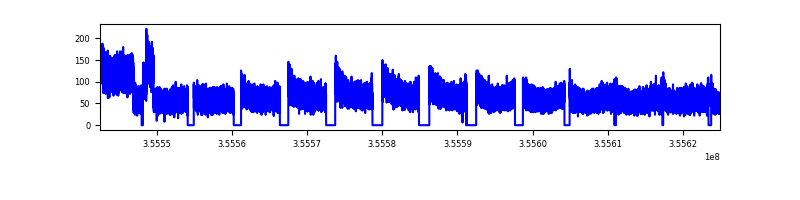 |
| C | 82518 | 71818 | 0 | 0 | 0.00% | 0.00% | 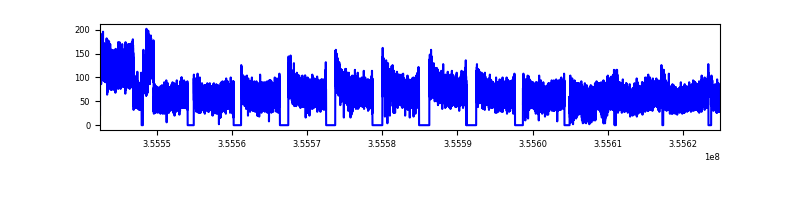 |
| D | 82518 | 71777 | 0 | 0 | 0.00% | 0.00% | 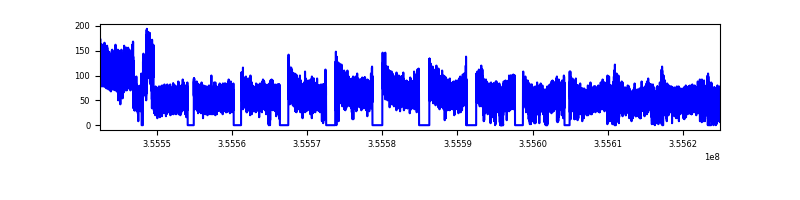 |
Top three noisy pixels from each quadrant. If the there are fewer than three noisy pixels in the level2.evt file, extra rows are filled as -1
| Pixel properties | Quadrant properties | ||||||
|---|---|---|---|---|---|---|---|
| Quadrant | DetID | PixID | Counts | Sigma | Mean | Median | Sigma |
| A | 0 | 29 | 4119 | 8.88 | 1344 | 1265 | 321.2 |
| A | 7 | 110 | 3904 | 8.22 | 1344 | 1265 | 321.2 |
| A | 9 | 19 | 3783 | 7.84 | 1344 | 1265 | 321.2 |
| B | 2 | 9 | 3803 | 10.07 | 1282 | 1227 | 255.8 |
| B | 5 | 232 | 3258 | 7.94 | 1282 | 1227 | 255.8 |
| B | 3 | 80 | 3184 | 7.65 | 1282 | 1227 | 255.8 |
| C | 1 | 81 | 3747 | 7.74 | 1297 | 1218 | 326.9 |
| C | 1 | 80 | 3741 | 7.72 | 1297 | 1218 | 326.9 |
| C | 3 | 202 | 3714 | 7.64 | 1297 | 1218 | 326.9 |
| D | 15 | 46 | 3126 | 6.09 | 1244 | 1139 | 326.5 |
| D | 10 | 189 | 3059 | 5.88 | 1244 | 1139 | 326.5 |
| D | 6 | 67 | 2989 | 5.67 | 1244 | 1139 | 326.5 |
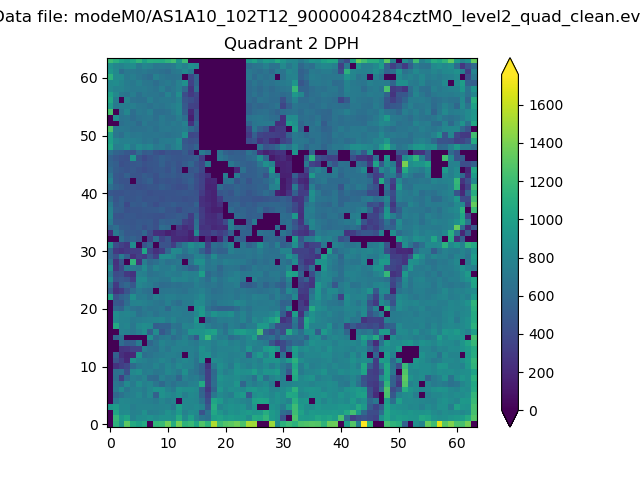
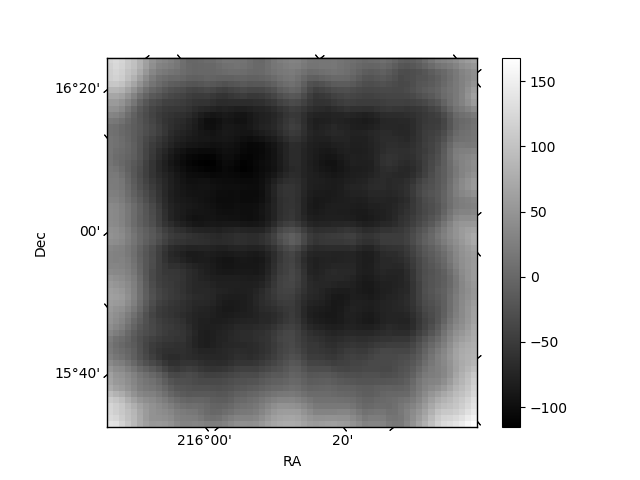
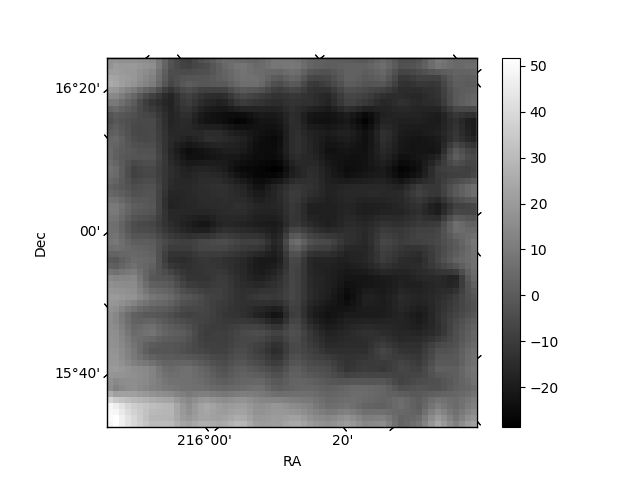
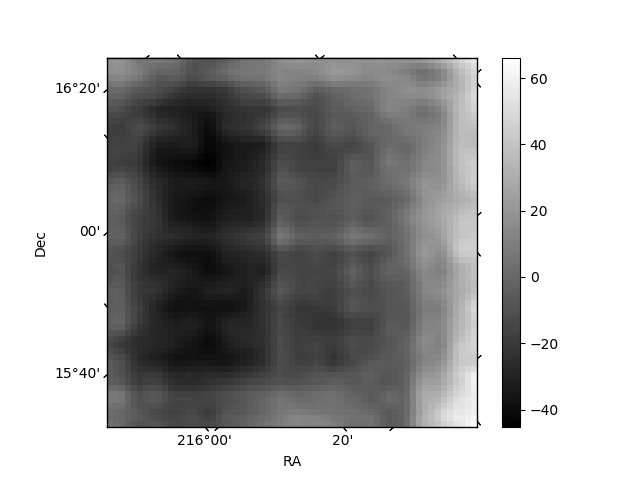
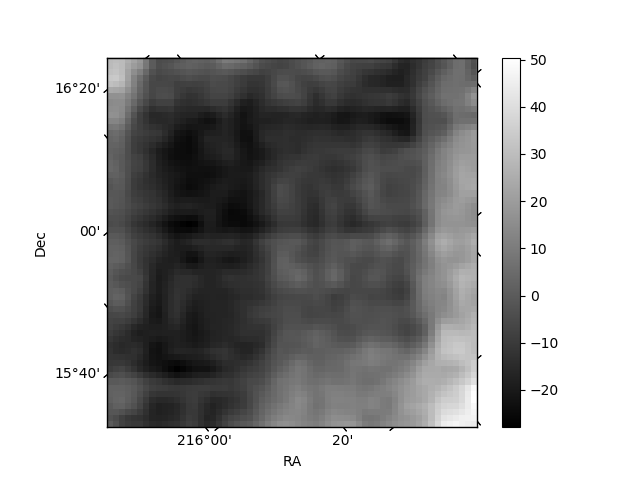
Histogram calculated using DETX and DETY for each event in the final _common_clean file
| Quadrant A | 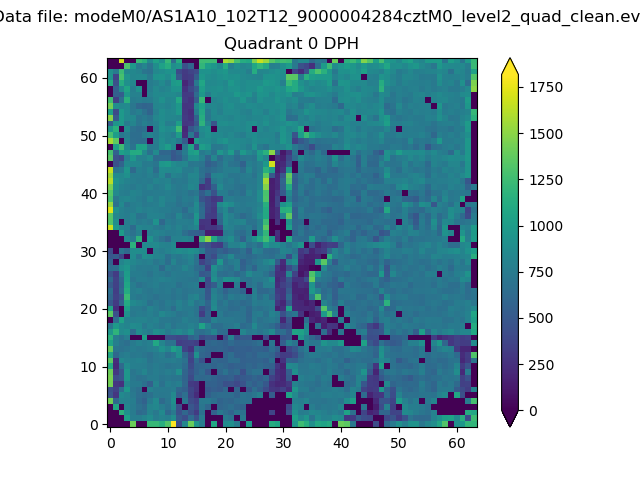 |
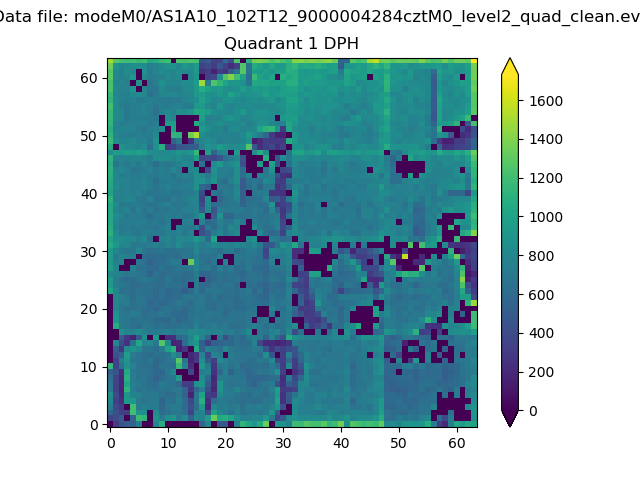 |
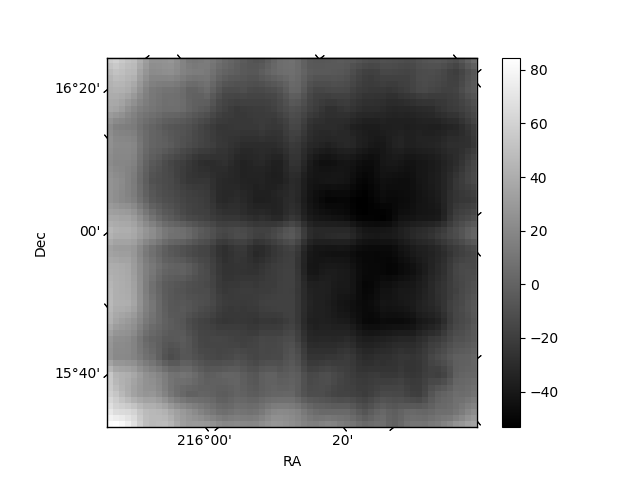
Quadrant B |
|---|---|---|---|
| Quadrant D | 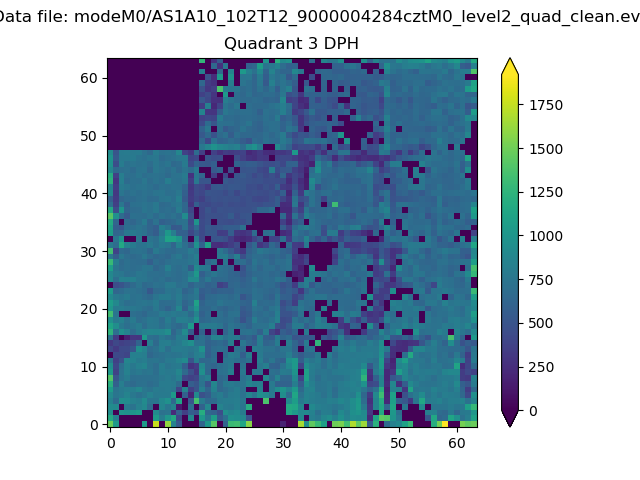 |
 |
Quadrant C |
| Plot type | Count rate plots | Images |
|---|---|---|
| Comparison with Poisson distribution Blue bars denote a histogram of data divided into 1 sec bins. Red curve is a Poisson curve with rate = median count rate of data. |
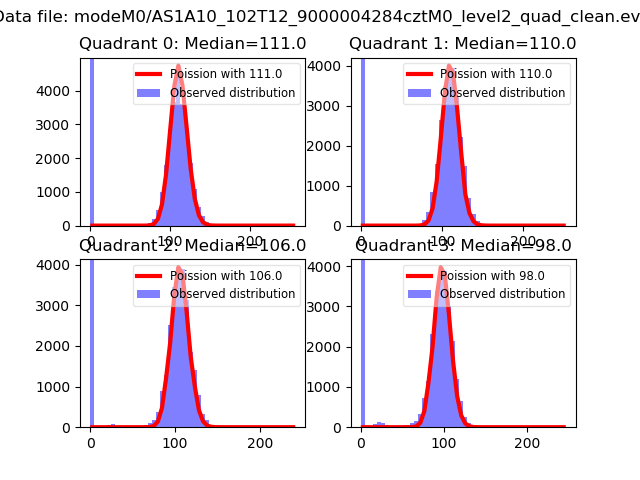 |
 |
| Quadrant-wise count rates Data is divided into 100 sec bins |
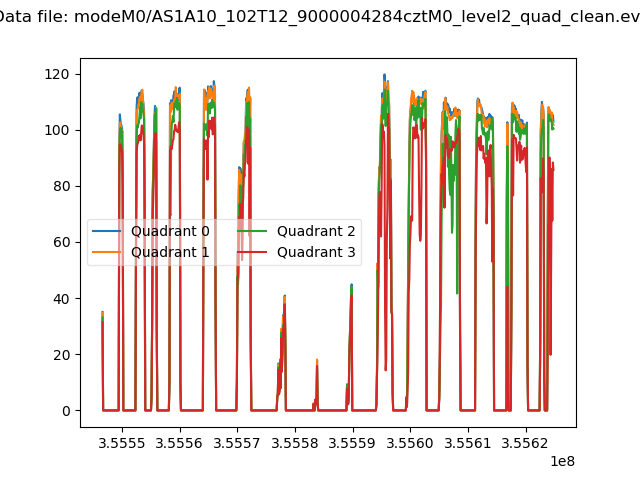 |
|
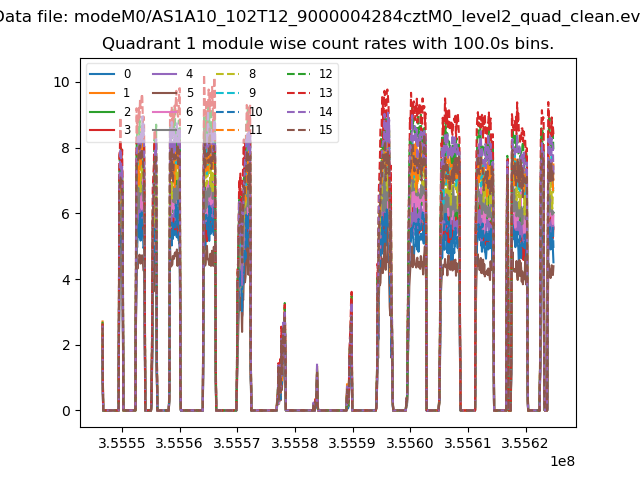
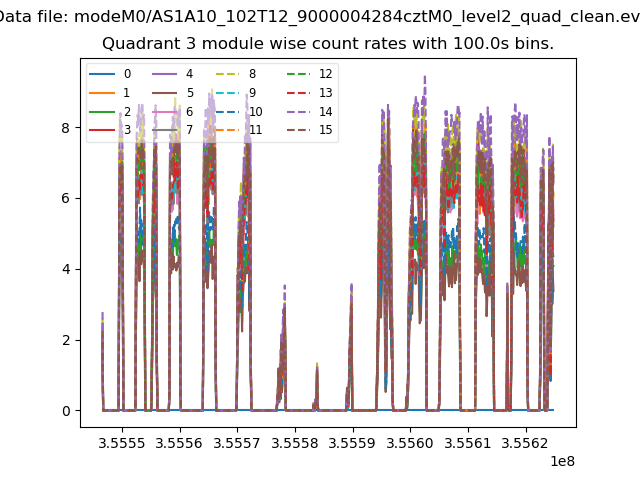
| Module-wise count rates for Quadrant A Data is divided into 100 sec bins |
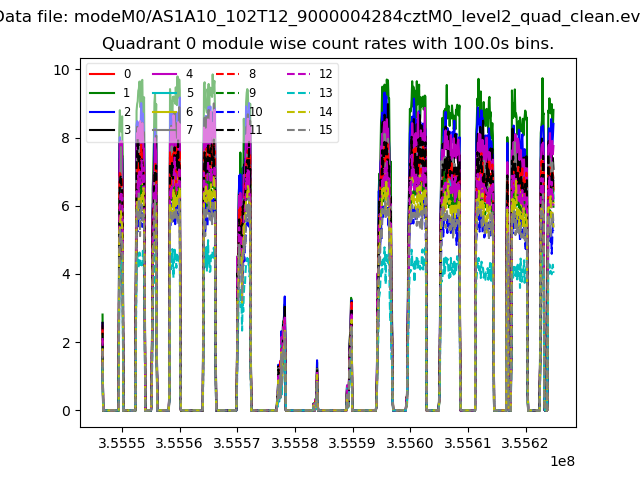 |
 |
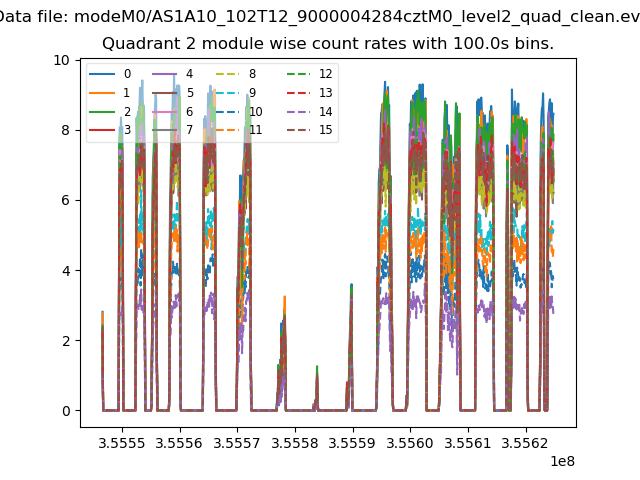
| Module-wise count rates for Quadrant B Data is divided into 100 sec bins |
 |
 |
| Module-wise count rates for Quadrant C Data is divided into 100 sec bins |
 |
 |
| Module-wise count rates for Quadrant D Data is divided into 100 sec bins |
 |
 |
| Parameter | Plot |
|---|---|
| CZT HV Monitor | 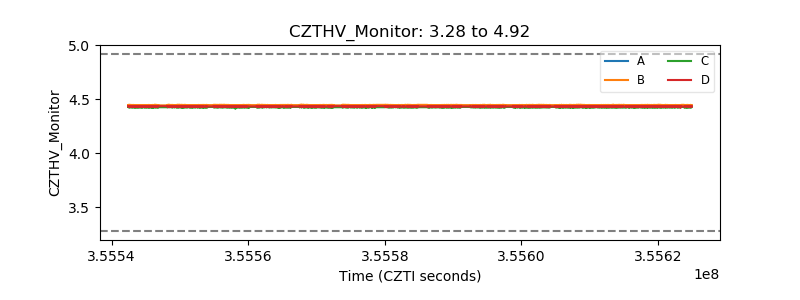 |
| D_VDD | 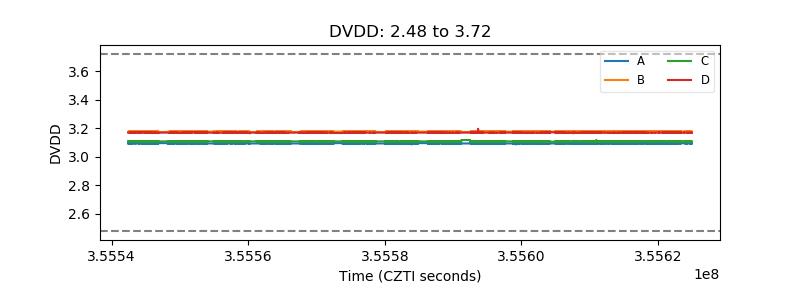 |
| Temperature 1 | 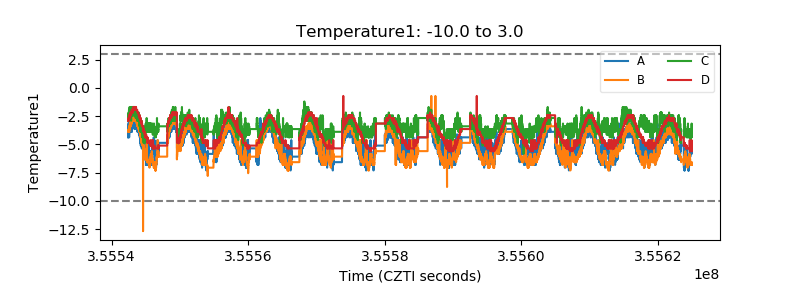 |
| Veto HV Monitor | 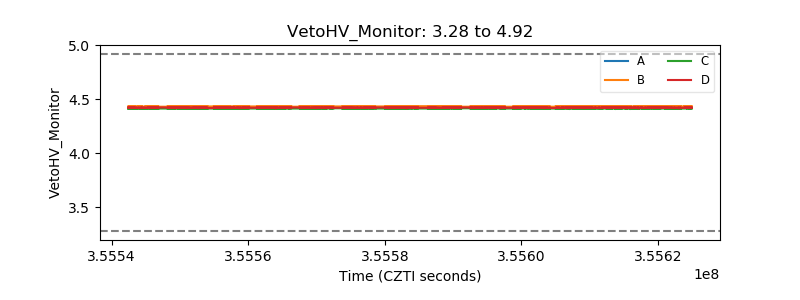 |
| Veto LLD | 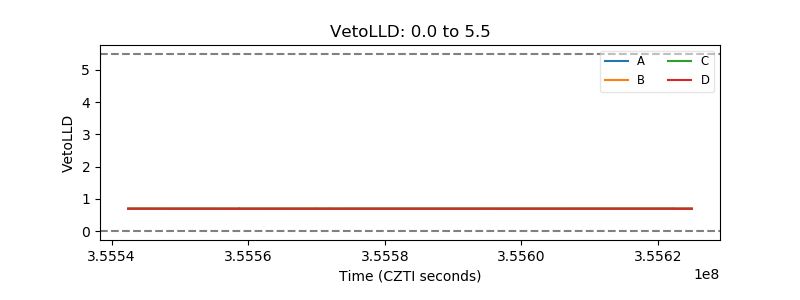 |
| Alpha Counter | 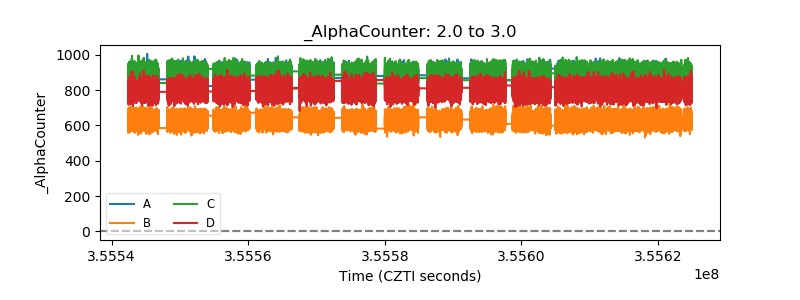 |
| _CPM_Rate | 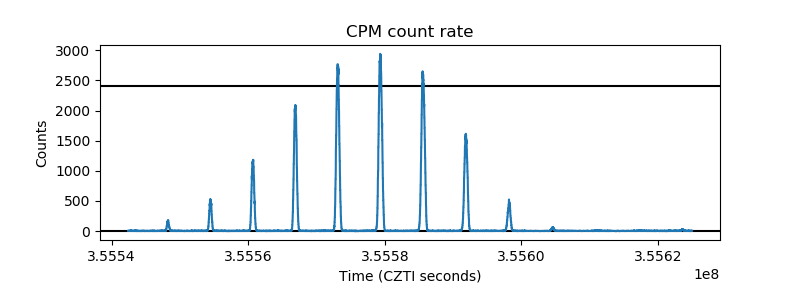 |
| CZT Counter | 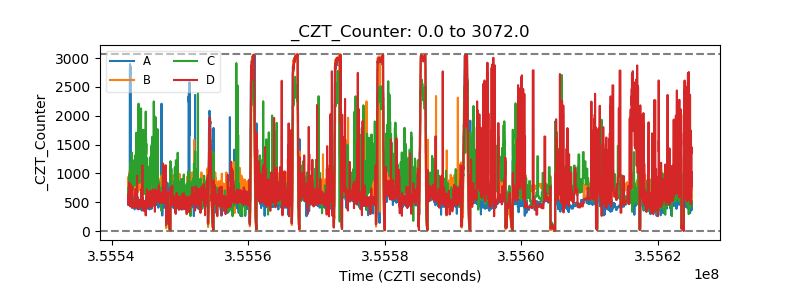 |
| +2.5 Volts monitor | 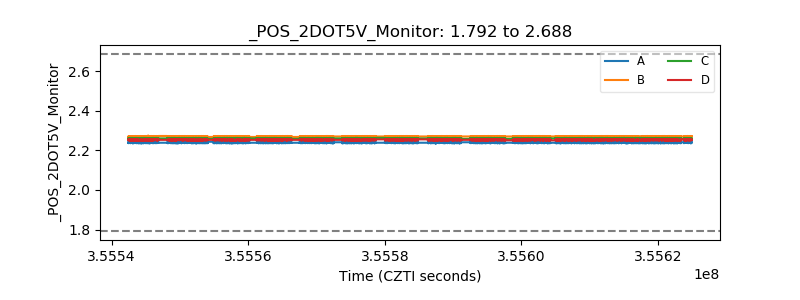 |
| +5 Volts monitor | 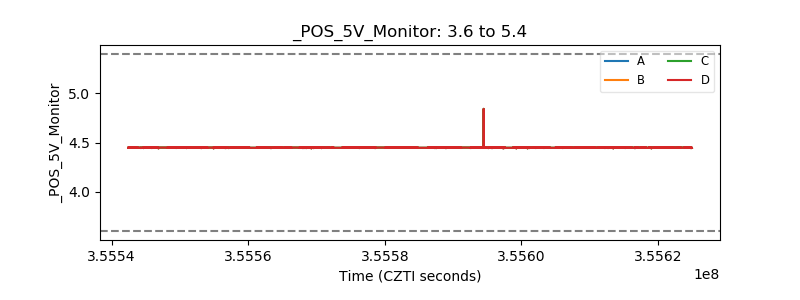 |
| _ROLL_ROT | 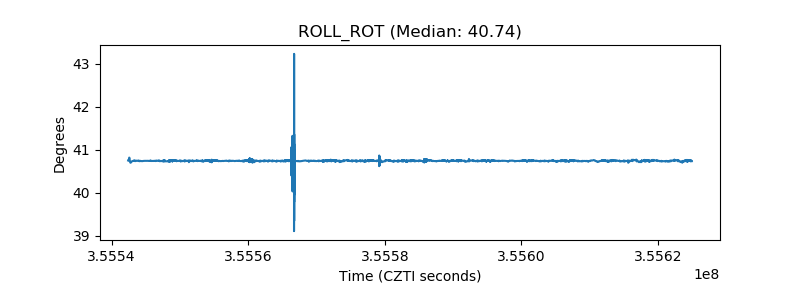 |
| _Roll_DEC | 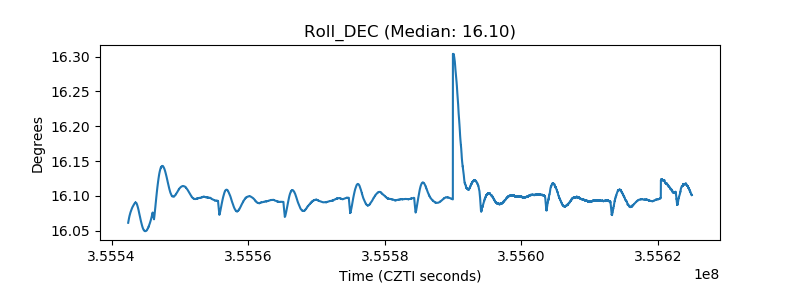 |
| _Roll_RA | 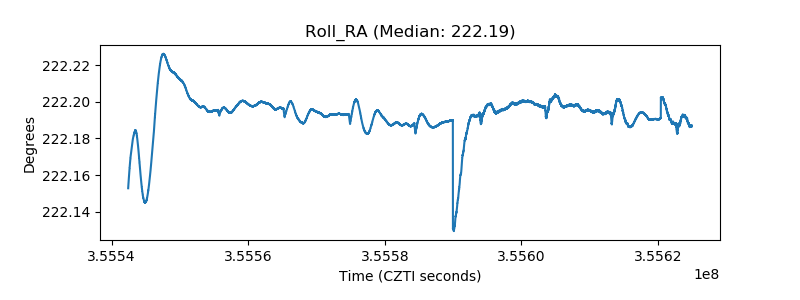 |
| Veto Counter | 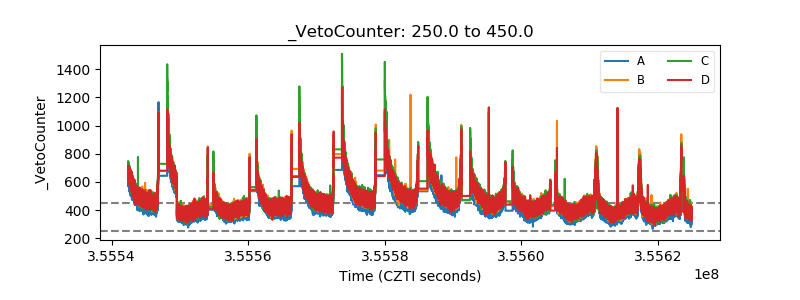 |