| Param | Original file | Final file |
|---|---|---|
| Filename | modeM0/AS1A10_102T12_9000004284_29884cztM0_level2.evt | modeM0/AS1A10_102T12_9000004284_29884cztM0_level2_quad_clean.evt |
| Size (bytes) | 647,784,000 | 96,350,400 |
| Size | 617.8 MB | 91.9 MB |
| Events in quadrant A | 3,780,083 | 601,016 |
| Events in quadrant B | 5,344,702 | 623,512 |
| Events in quadrant C | 6,311,077 | 598,602 |
| Events in quadrant D | 3,703,665 | 601,220 |
| Mode M9 | |||
|---|---|---|---|
| Quadrant | BADHDUFLAG | Total packets | Discarded packets |
| A | 0 | 7 | 0 |
| B | 0 | 7 | 0 |
| C | 0 | 7 | 0 |
| D | 0 | 7 | 0 |
| Mode M0 | |||
|---|---|---|---|
| Quadrant | BADHDUFLAG | Total packets | Discarded packets |
| A | 0 | 15692 | 1 |
| B | 0 | 21324 | 2 |
| C | 0 | 23836 | 1 |
| D | 0 | 15374 | 1 |
| Mode SS | |||
|---|---|---|---|
| Quadrant | BADHDUFLAG | Total packets | Discarded packets |
| A | 0 | 142 | 0 |
| B | 0 | 142 | 0 |
| C | 0 | 142 | 0 |
| D | 0 | 142 | 0 |
| Quadrant | Total seconds | Saturated seconds | Saturation percentage |
|---|---|---|---|
| A | 7093 | 235 | 3.313126% |
| B | 7092 | 83 | 1.170333% |
| C | 7092 | 279 | 3.934010% |
| D | 7092 | 36 | 0.507614% |
Noise dominated data is calculated using 1-second bins in cleaned event files. If a bin has >2000 counts, and if more than 50% of those come from <1% of pixels, then it is considered to be noise-dominated and hence unusable.
| Quadrant | # 1 sec bins | Bins with >0 counts | Bins with >2000 counts | High rate bins dominated by noise | Noise dominated (total time) | Noise dominated (detector-on time) | Marked lightcurve |
|---|---|---|---|---|---|---|---|
| A | 7733 | 7094 | 167 | 167 | 2.16% | 2.35% | 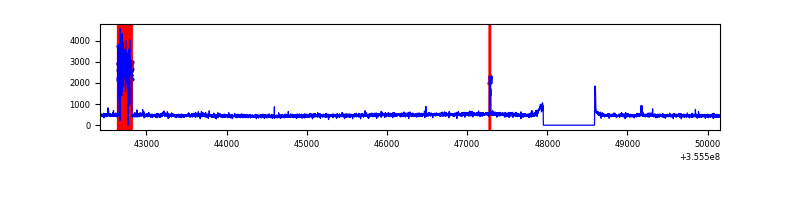 |
| B | 7732 | 7093 | 3 | 3 | 0.04% | 0.04% | 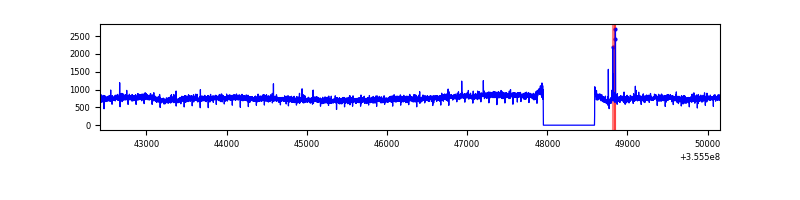 |
| C | 7732 | 7093 | 73 | 73 | 0.94% | 1.03% | 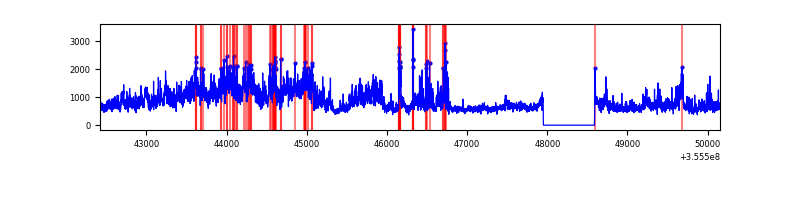 |
| D | 7732 | 7093 | 7 | 7 | 0.09% | 0.10% | 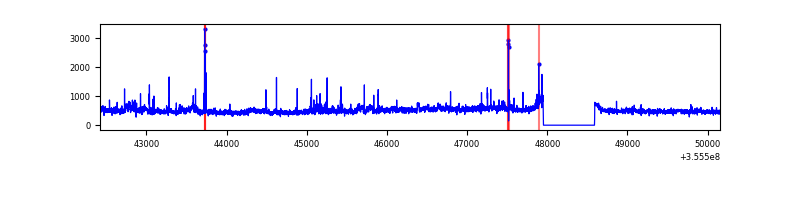 |
Top three noisy pixels from each quadrant. If the there are fewer than three noisy pixels in the level2.evt file, extra rows are filled as -1
| Pixel properties | Quadrant properties | ||||||
|---|---|---|---|---|---|---|---|
| Quadrant | DetID | PixID | Counts | Sigma | Mean | Median | Sigma |
| A | 15 | 174 | 490562 | 2921.15 | 835 | 816 | 167.7 |
| A | 1 | 113 | 51931 | 304.88 | 835 | 816 | 167.7 |
| A | 8 | 192 | 16935 | 96.14 | 835 | 816 | 167.7 |
| B | 6 | 159 | 2009155 | 12261.09 | 841 | 819 | 163.8 |
| B | 0 | 229 | 22764 | 133.98 | 841 | 819 | 163.8 |
| B | 12 | 111 | 20713 | 121.45 | 841 | 819 | 163.8 |
| C | 3 | 233 | 2788061 | 14510.14 | 812 | 816 | 192.1 |
| C | 10 | 22 | 217344 | 1127.22 | 812 | 816 | 192.1 |
| C | 14 | 238 | 130106 | 673.07 | 812 | 816 | 192.1 |
| D | 8 | 195 | 438480 | 2235.5 | 825 | 806 | 195.8 |
| D | 13 | 104 | 39551 | 197.9 | 825 | 806 | 195.8 |
| D | 2 | 250 | 37968 | 189.81 | 825 | 806 | 195.8 |
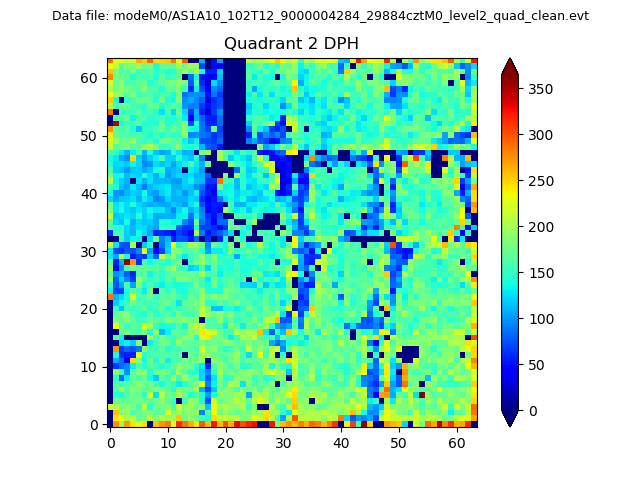
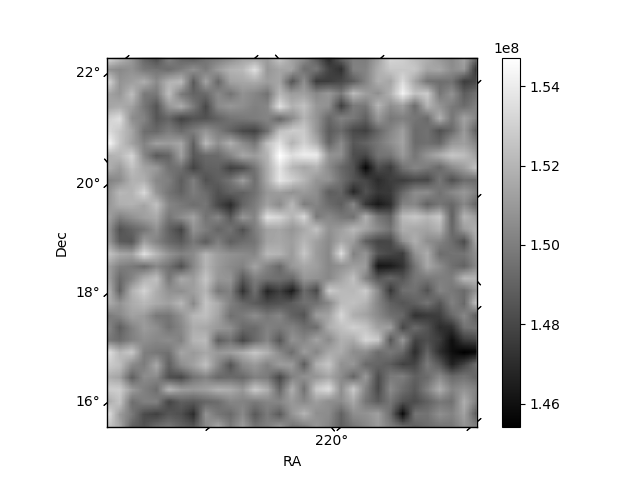
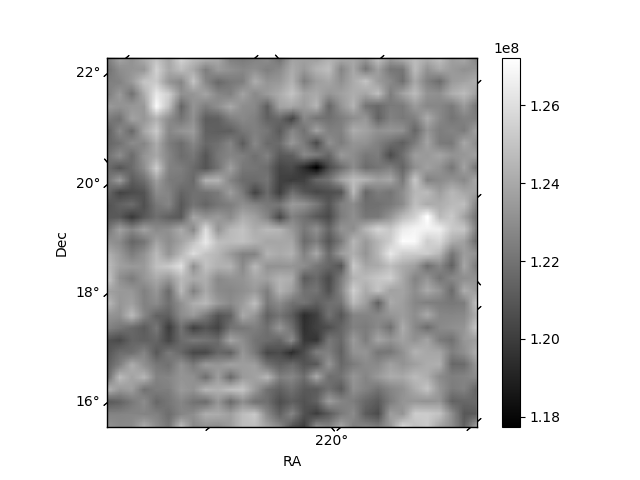
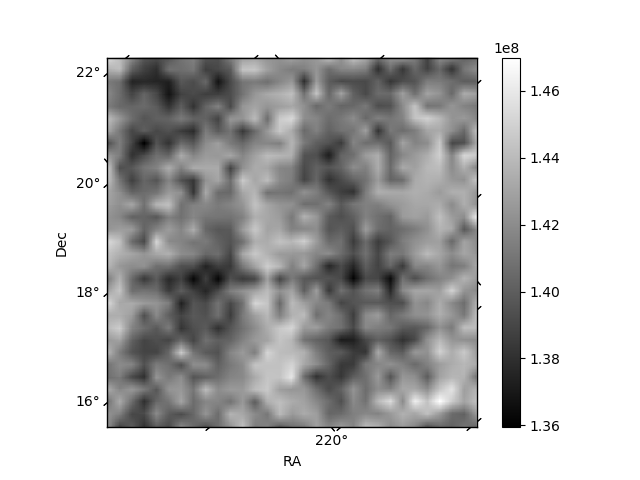
Histogram calculated using DETX and DETY for each event in the final _common_clean file
| Quadrant A | 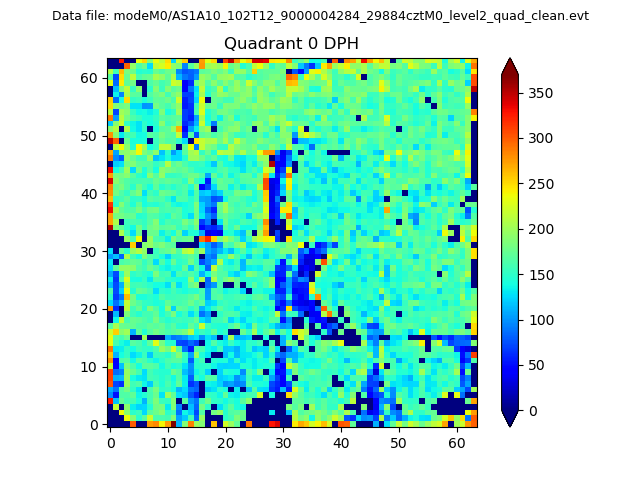 |
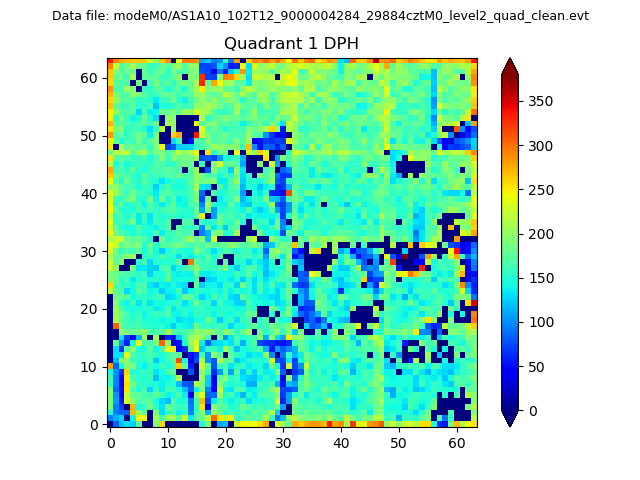 |
Quadrant B |
|---|---|---|---|
| Quadrant D | 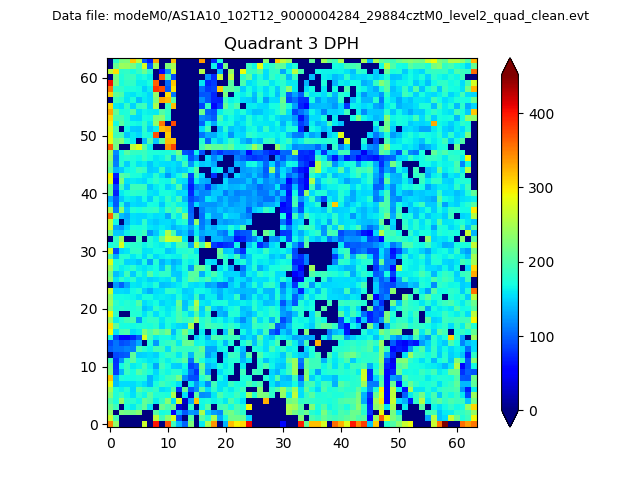 |
 |
Quadrant C |
| Plot type | Count rate plots | Images |
|---|---|---|
| Comparison with Poisson distribution Blue bars denote a histogram of data divided into 1 sec bins. Red curve is a Poisson curve with rate = median count rate of data. |
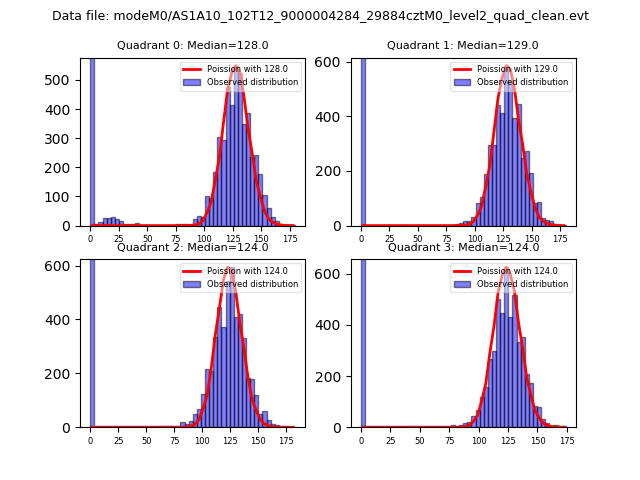 |
 |
| Quadrant-wise count rates Data is divided into 100 sec bins |
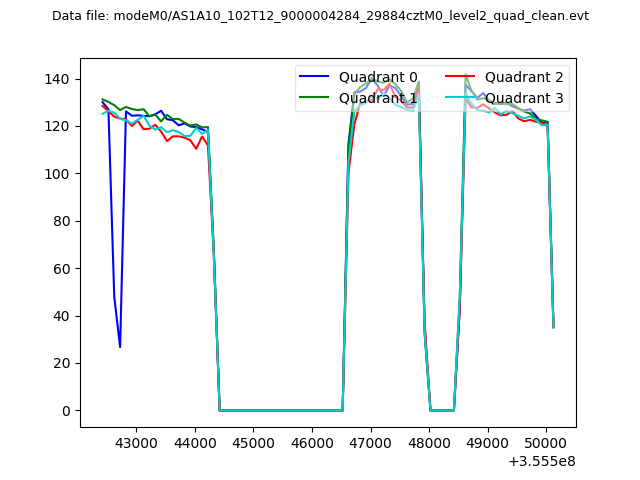 |
|
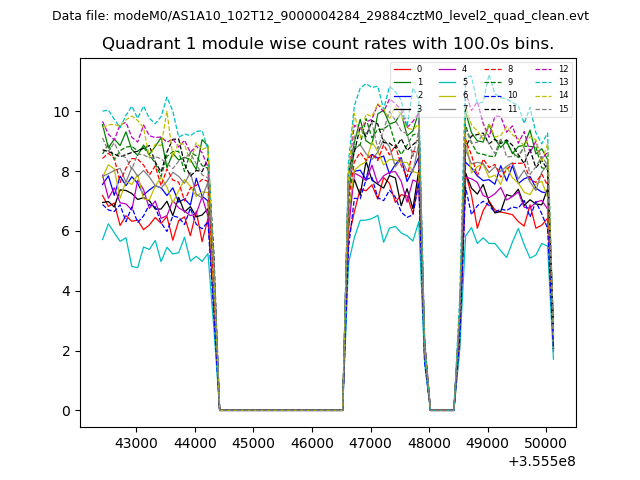
| Module-wise count rates for Quadrant A Data is divided into 100 sec bins |
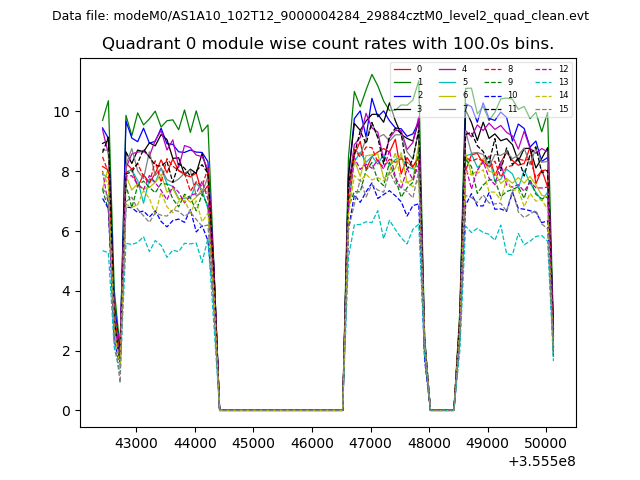 |
 |
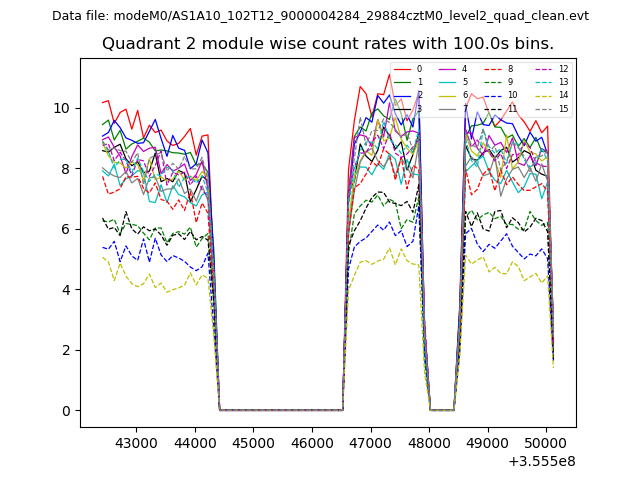
| Module-wise count rates for Quadrant B Data is divided into 100 sec bins |
 |
 |
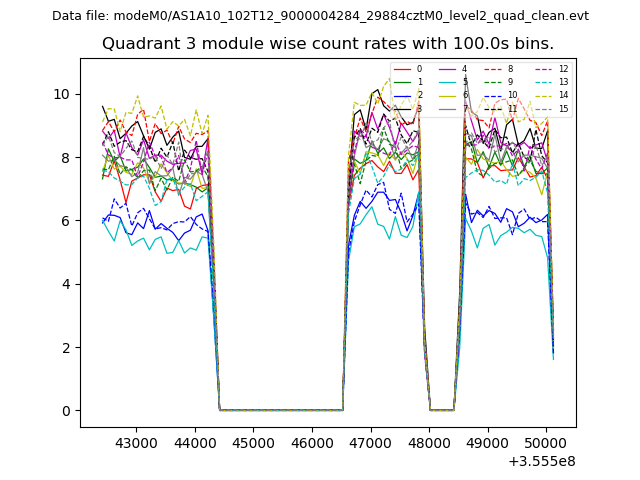
| Module-wise count rates for Quadrant C Data is divided into 100 sec bins |
 |
 |
| Module-wise count rates for Quadrant D Data is divided into 100 sec bins |
 |
 |
| Parameter | Plot |
|---|---|
| CZT HV Monitor | 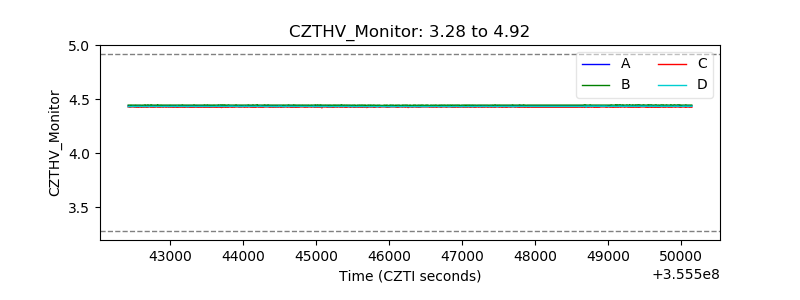 |
| D_VDD | 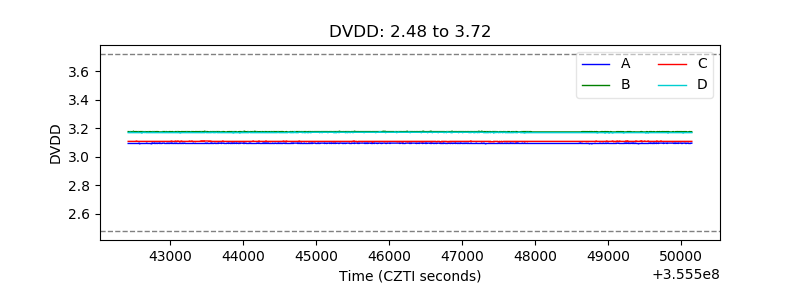 |
| Temperature 1 |  |
| Veto HV Monitor | 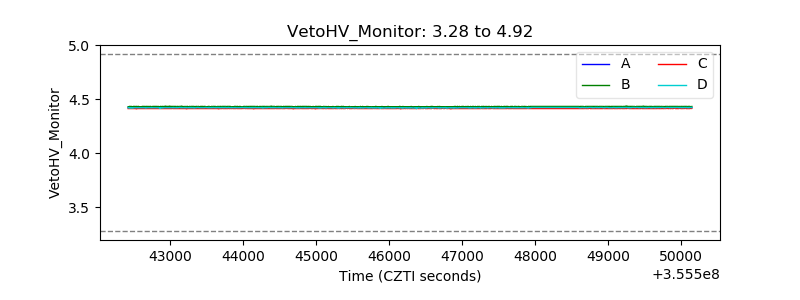 |
| Veto LLD | 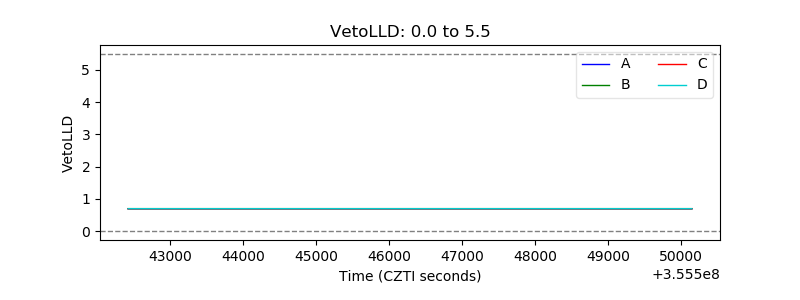 |
| Alpha Counter | 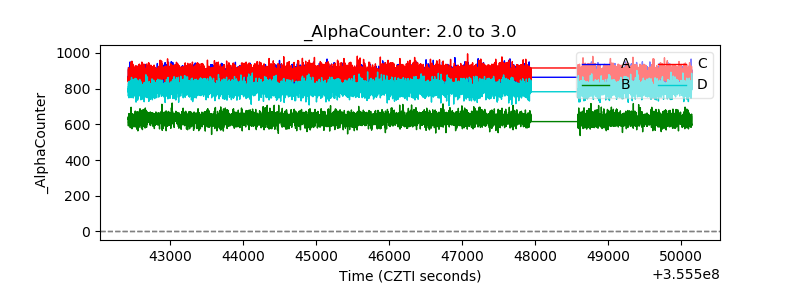 |
| _CPM_Rate | 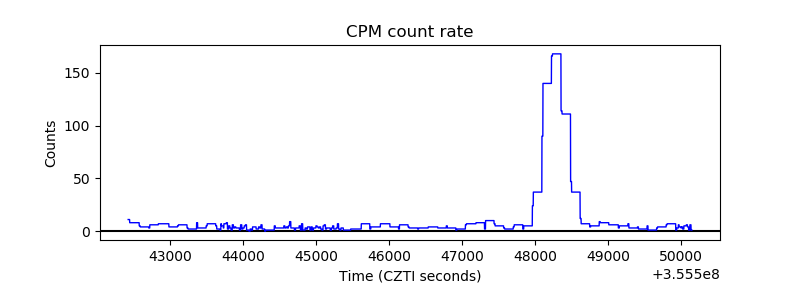 |
| CZT Counter | 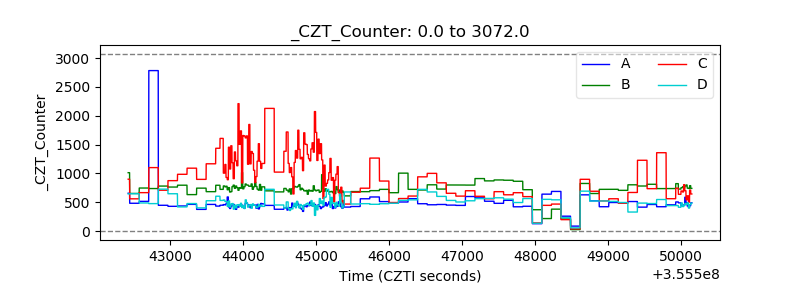 |
| +2.5 Volts monitor |  |
| +5 Volts monitor |  |
| _ROLL_ROT | 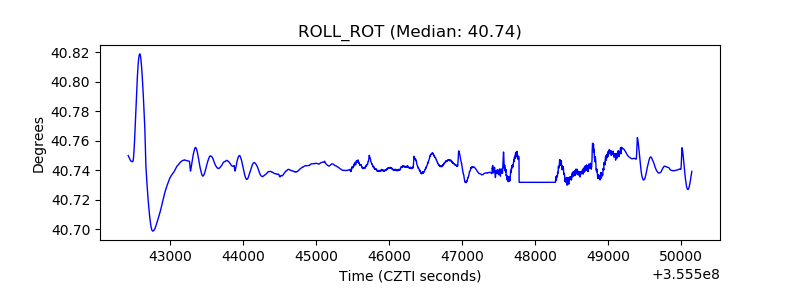 |
| _Roll_DEC | 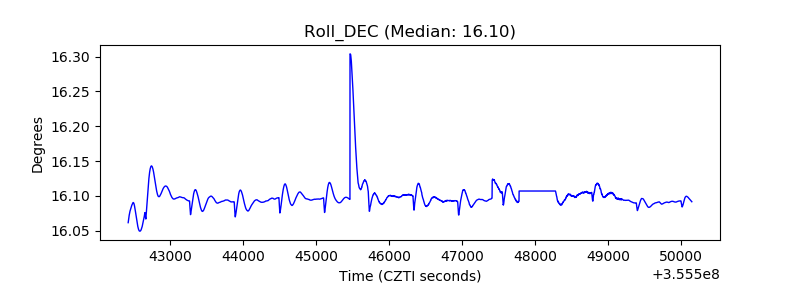 |
| _Roll_RA |  |
| Veto Counter | 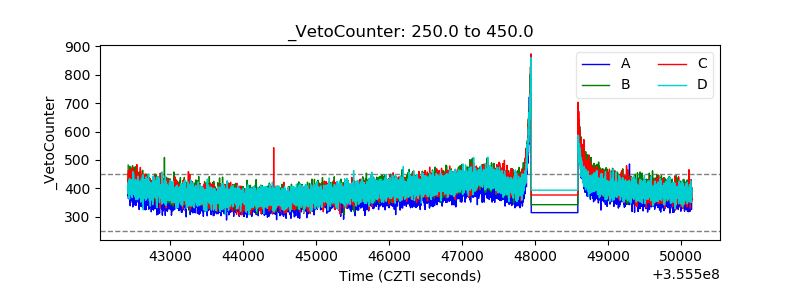 |