| Param | Original file | Final file |
|---|---|---|
| Filename | modeM0/AS1A10_102T12_9000004284_29885cztM0_level2.evt | modeM0/AS1A10_102T12_9000004284_29885cztM0_level2_quad_clean.evt |
| Size (bytes) | 545,699,520 | 84,559,680 |
| Size | 520.4 MB | 80.6 MB |
| Events in quadrant A | 3,386,669 | 534,783 |
| Events in quadrant B | 5,002,400 | 536,132 |
| Events in quadrant C | 4,205,421 | 521,175 |
| Events in quadrant D | 3,492,104 | 515,575 |
| Mode M9 | |||
|---|---|---|---|
| Quadrant | BADHDUFLAG | Total packets | Discarded packets |
| A | 0 | 8 | 0 |
| B | 0 | 8 | 0 |
| C | 0 | 8 | 0 |
| D | 0 | 8 | 0 |
| Mode M0 | |||
|---|---|---|---|
| Quadrant | BADHDUFLAG | Total packets | Discarded packets |
| A | 0 | 14068 | 1 |
| B | 0 | 19621 | 1 |
| C | 0 | 16973 | 1 |
| D | 0 | 14448 | 1 |
| Mode SS | |||
|---|---|---|---|
| Quadrant | BADHDUFLAG | Total packets | Discarded packets |
| A | 0 | 134 | 0 |
| B | 0 | 134 | 0 |
| C | 0 | 134 | 0 |
| D | 0 | 134 | 0 |
| Quadrant | Total seconds | Saturated seconds | Saturation percentage |
|---|---|---|---|
| A | 6487 | 194 | 2.990597% |
| B | 6488 | 102 | 1.572133% |
| C | 6488 | 122 | 1.880395% |
| D | 6488 | 39 | 0.601110% |
Noise dominated data is calculated using 1-second bins in cleaned event files. If a bin has >2000 counts, and if more than 50% of those come from <1% of pixels, then it is considered to be noise-dominated and hence unusable.
| Quadrant | # 1 sec bins | Bins with >0 counts | Bins with >2000 counts | High rate bins dominated by noise | Noise dominated (total time) | Noise dominated (detector-on time) | Marked lightcurve |
|---|---|---|---|---|---|---|---|
| A | 7307 | 6488 | 124 | 124 | 1.70% | 1.91% | 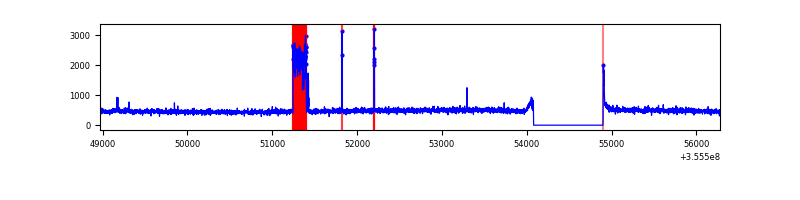 |
| B | 7308 | 6489 | 7 | 7 | 0.10% | 0.11% | 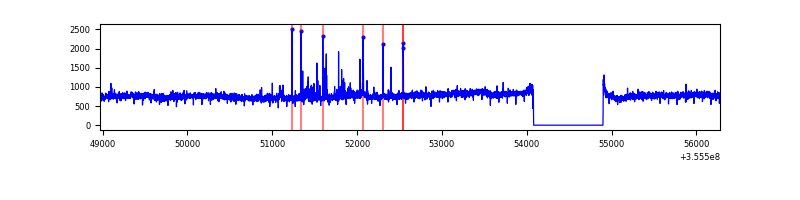 |
| C | 7308 | 6489 | 3 | 3 | 0.04% | 0.05% | 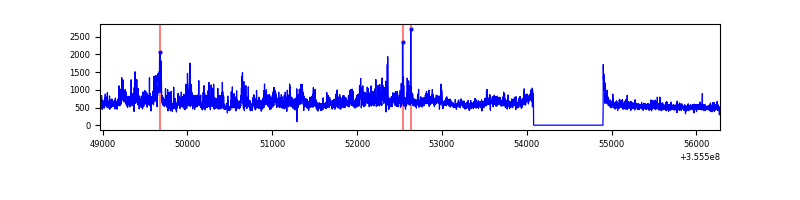 |
| D | 7308 | 6489 | 4 | 4 | 0.05% | 0.06% | 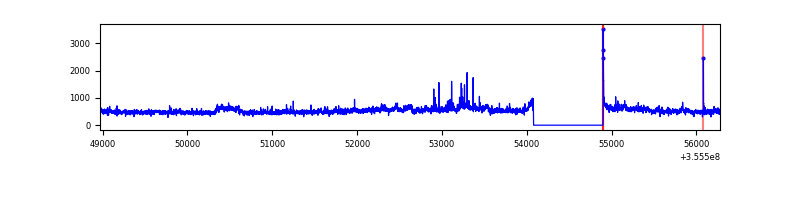 |
Top three noisy pixels from each quadrant. If the there are fewer than three noisy pixels in the level2.evt file, extra rows are filled as -1
| Pixel properties | Quadrant properties | ||||||
|---|---|---|---|---|---|---|---|
| Quadrant | DetID | PixID | Counts | Sigma | Mean | Median | Sigma |
| A | 15 | 174 | 321449 | 2013.95 | 790 | 774 | 159.2 |
| A | 8 | 192 | 16713 | 100.1 | 790 | 774 | 159.2 |
| A | 13 | 254 | 11525 | 67.52 | 790 | 774 | 159.2 |
| B | 6 | 159 | 1816028 | 11976.31 | 782 | 763 | 151.6 |
| B | 0 | 229 | 100236 | 656.28 | 782 | 763 | 151.6 |
| B | 12 | 111 | 19228 | 121.82 | 782 | 763 | 151.6 |
| C | 3 | 233 | 1073718 | 6051.31 | 757 | 762 | 177.3 |
| C | 14 | 238 | 123911 | 694.54 | 757 | 762 | 177.3 |
| C | 10 | 22 | 42621 | 236.08 | 757 | 762 | 177.3 |
| D | 8 | 195 | 451890 | 2450.85 | 770 | 750 | 184.1 |
| D | 7 | 238 | 60595 | 325.11 | 770 | 750 | 184.1 |
| D | 2 | 250 | 27089 | 143.09 | 770 | 750 | 184.1 |
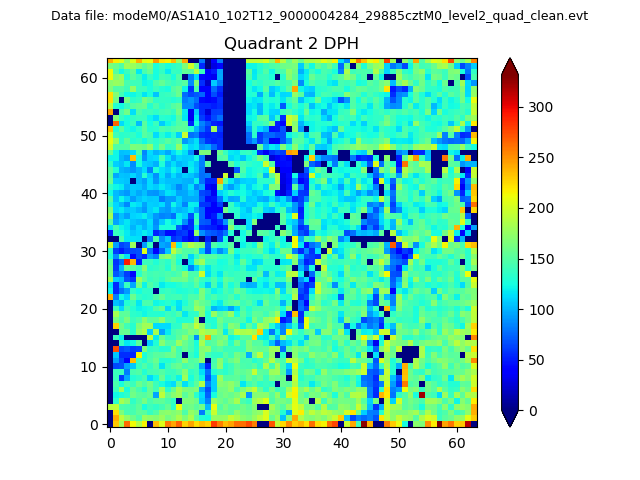
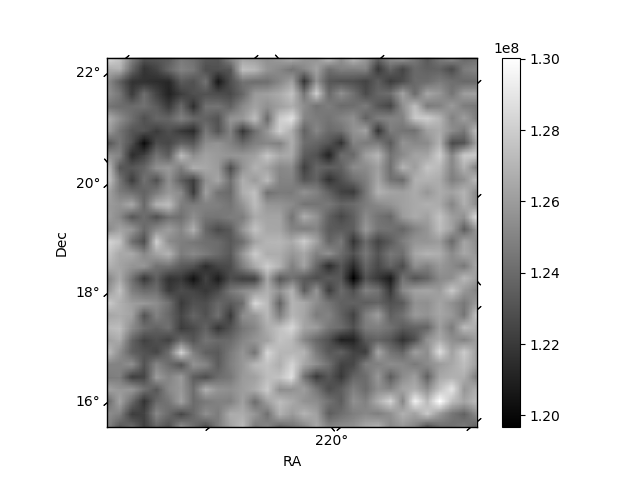
Histogram calculated using DETX and DETY for each event in the final _common_clean file
| Quadrant A | 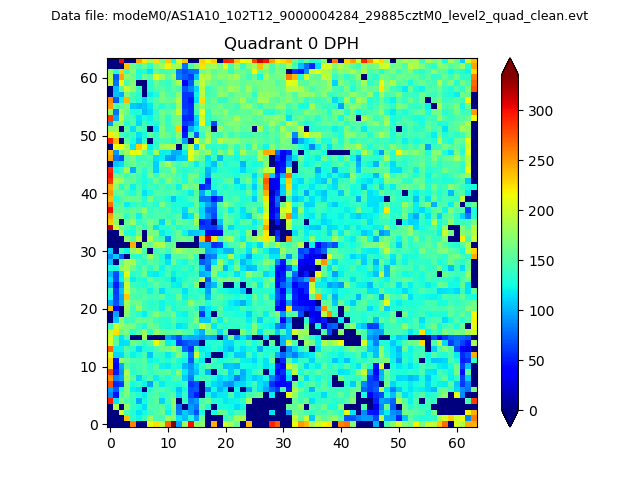 |
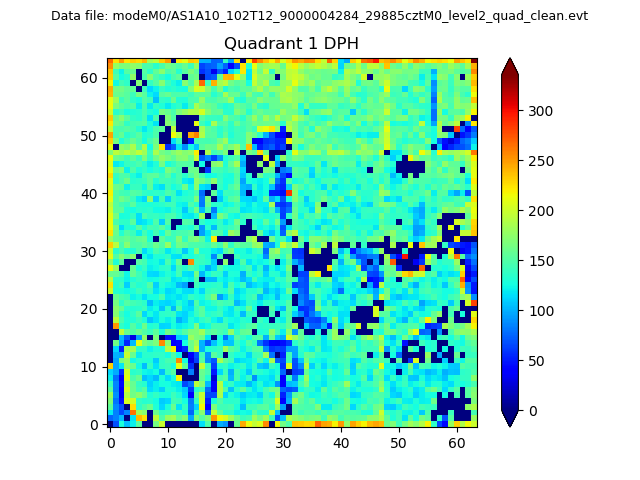 |
Quadrant B |
|---|---|---|---|
| Quadrant D | 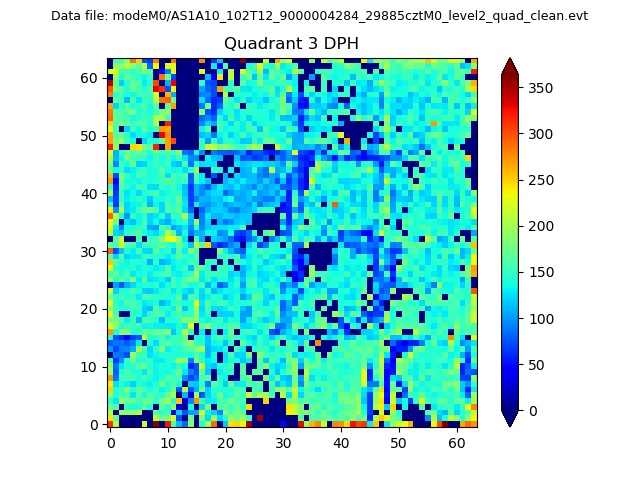 |
 |
Quadrant C |
| Plot type | Count rate plots | Images |
|---|---|---|
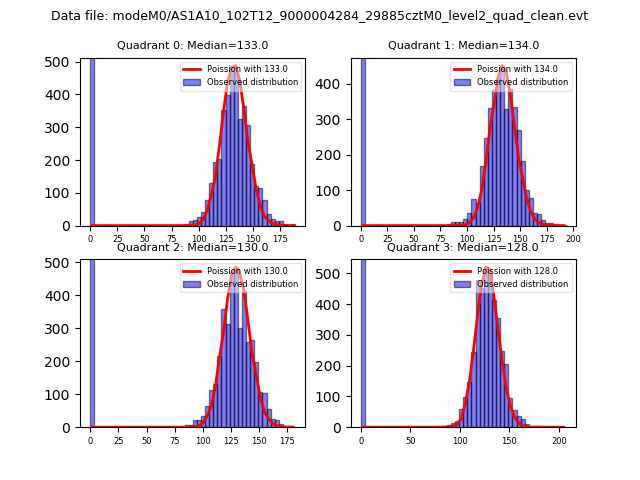
| Comparison with Poisson distribution Blue bars denote a histogram of data divided into 1 sec bins. Red curve is a Poisson curve with rate = median count rate of data. |
 |
 |
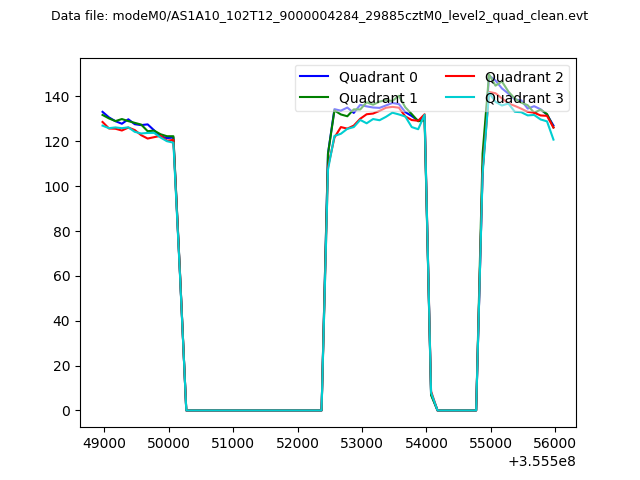
| Quadrant-wise count rates Data is divided into 100 sec bins |
 |
|
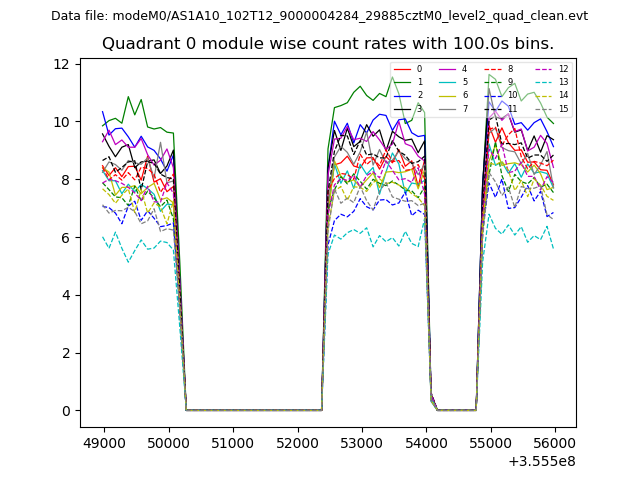
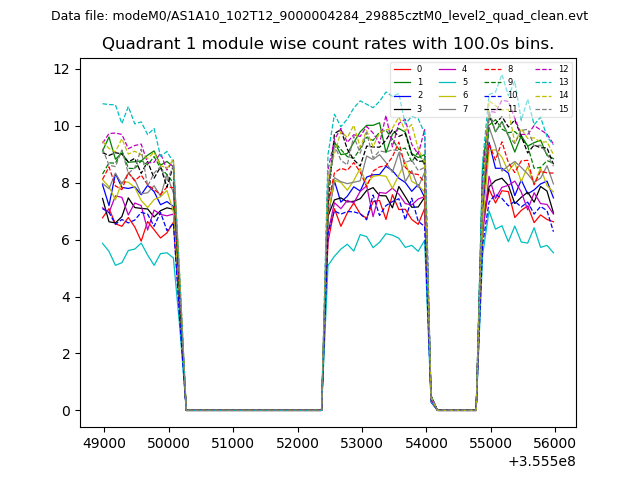
| Module-wise count rates for Quadrant A Data is divided into 100 sec bins |
 |
 |
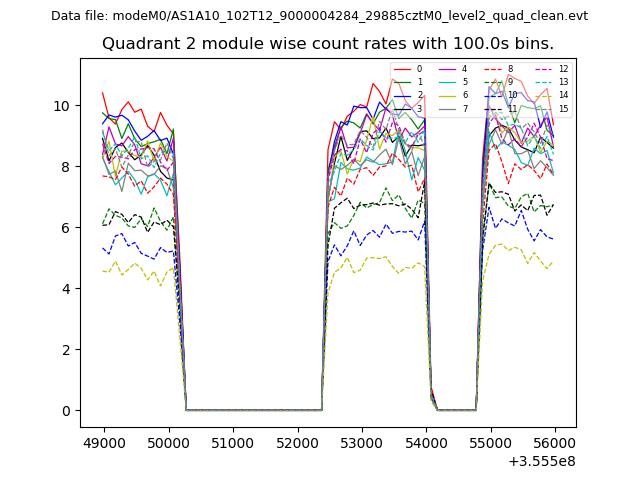
| Module-wise count rates for Quadrant B Data is divided into 100 sec bins |
 |
 |
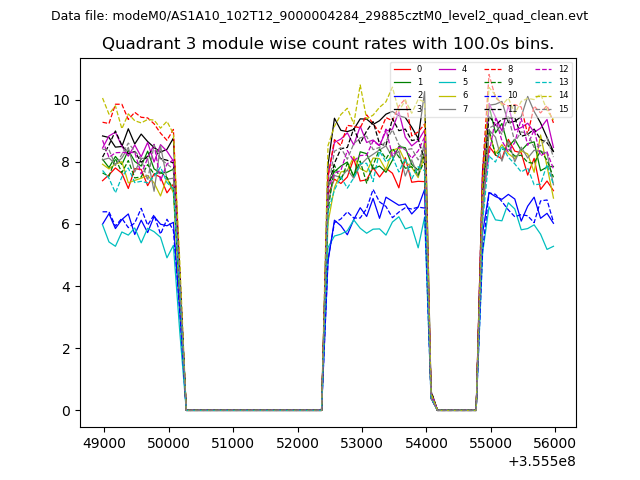
| Module-wise count rates for Quadrant C Data is divided into 100 sec bins |
 |
 |
| Module-wise count rates for Quadrant D Data is divided into 100 sec bins |
 |
 |
| Parameter | Plot |
|---|---|
| CZT HV Monitor | 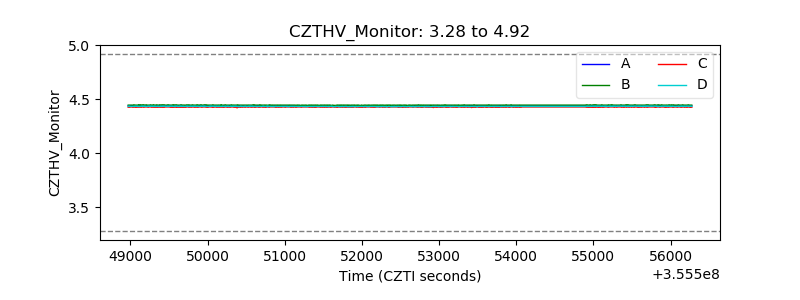 |
| D_VDD | 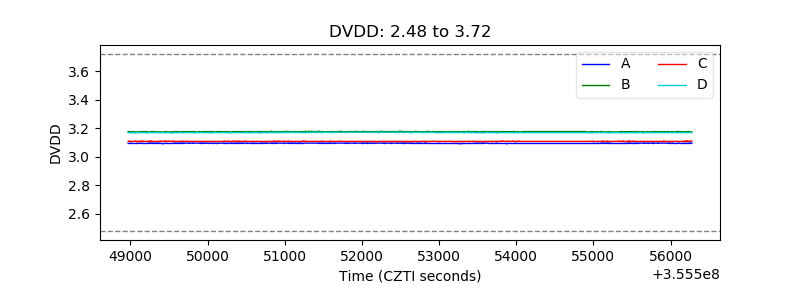 |
| Temperature 1 | 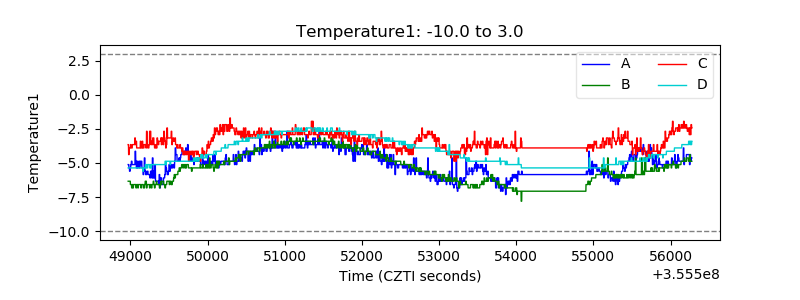 |
| Veto HV Monitor | 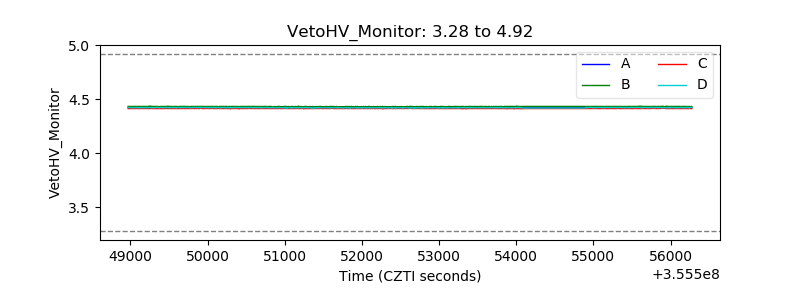 |
| Veto LLD | 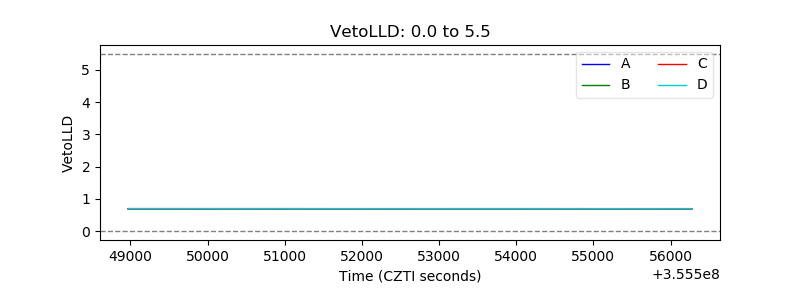 |
| Alpha Counter | 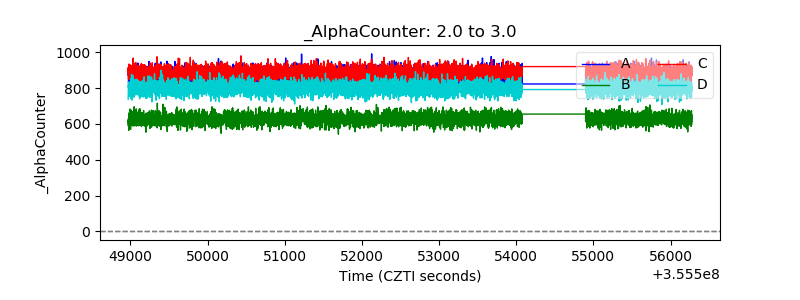 |
| _CPM_Rate | 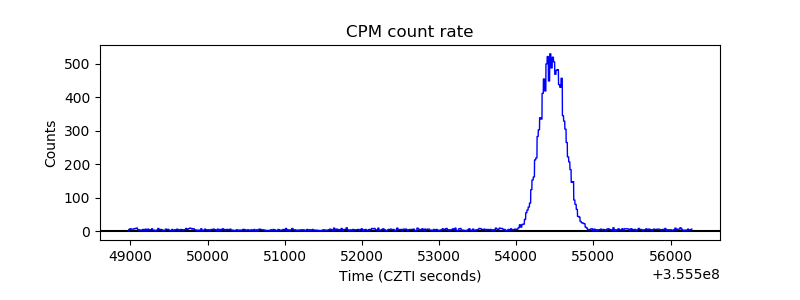 |
| CZT Counter | 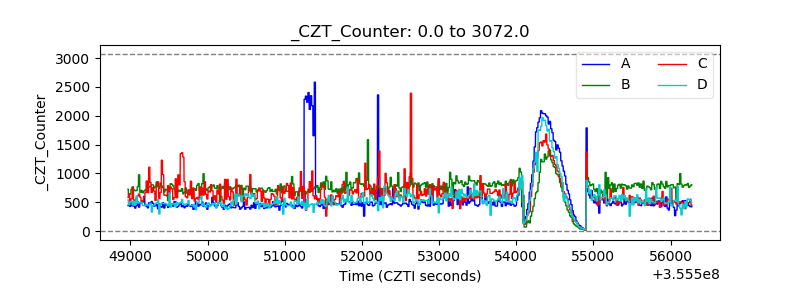 |
| +2.5 Volts monitor |  |
| +5 Volts monitor |  |
| _ROLL_ROT | 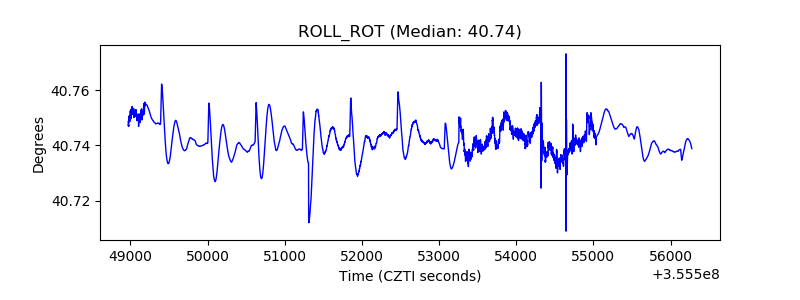 |
| _Roll_DEC | 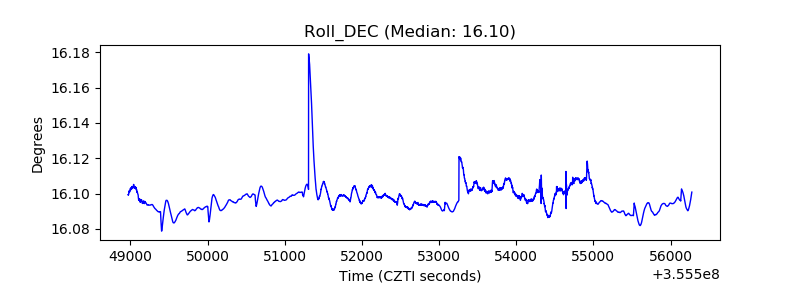 |
| _Roll_RA |  |
| Veto Counter | 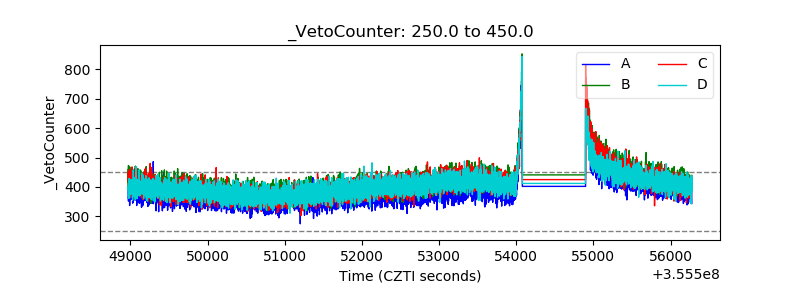 |