| Param | Original file | Final file |
|---|---|---|
| Filename | modeM0/AS1A10_102T12_9000004284_29886cztM0_level2.evt | modeM0/AS1A10_102T12_9000004284_29886cztM0_level2_quad_clean.evt |
| Size (bytes) | 525,216,960 | 73,172,160 |
| Size | 500.9 MB | 69.8 MB |
| Events in quadrant A | 3,147,297 | 456,072 |
| Events in quadrant B | 4,824,017 | 456,734 |
| Events in quadrant C | 3,764,621 | 439,063 |
| Events in quadrant D | 3,755,541 | 436,023 |
| Mode M9 | |||
|---|---|---|---|
| Quadrant | BADHDUFLAG | Total packets | Discarded packets |
| A | 0 | 10 | 0 |
| B | 0 | 10 | 0 |
| C | 0 | 10 | 0 |
| D | 0 | 10 | 0 |
| Mode M0 | |||
|---|---|---|---|
| Quadrant | BADHDUFLAG | Total packets | Discarded packets |
| A | 0 | 13064 | 1 |
| B | 0 | 18589 | 1 |
| C | 0 | 14950 | 1 |
| D | 0 | 14956 | 1 |
| Mode SS | |||
|---|---|---|---|
| Quadrant | BADHDUFLAG | Total packets | Discarded packets |
| A | 0 | 124 | 0 |
| B | 0 | 124 | 0 |
| C | 0 | 124 | 0 |
| D | 0 | 124 | 0 |
| Quadrant | Total seconds | Saturated seconds | Saturation percentage |
|---|---|---|---|
| A | 6126 | 62 | 1.012080% |
| B | 6127 | 94 | 1.534193% |
| C | 6127 | 198 | 3.231598% |
| D | 6127 | 51 | 0.832381% |
Noise dominated data is calculated using 1-second bins in cleaned event files. If a bin has >2000 counts, and if more than 50% of those come from <1% of pixels, then it is considered to be noise-dominated and hence unusable.
| Quadrant | # 1 sec bins | Bins with >0 counts | Bins with >2000 counts | High rate bins dominated by noise | Noise dominated (total time) | Noise dominated (detector-on time) | Marked lightcurve |
|---|---|---|---|---|---|---|---|
| A | 7116 | 6127 | 6 | 6 | 0.08% | 0.10% | 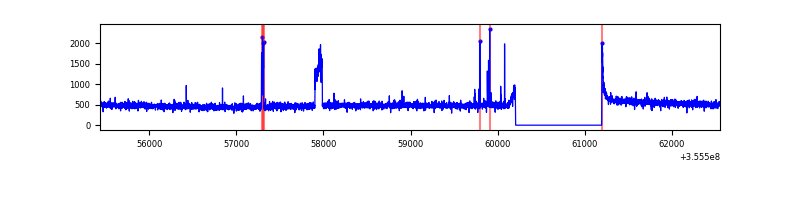 |
| B | 7117 | 6128 | 7 | 7 | 0.10% | 0.11% | 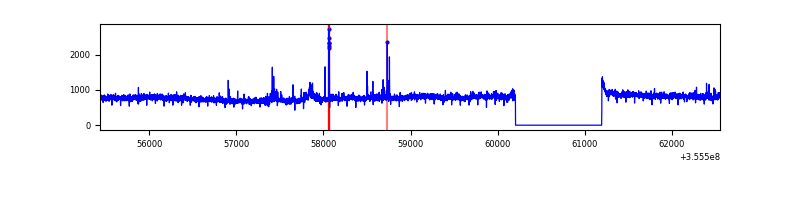 |
| C | 7117 | 6128 | 56 | 56 | 0.79% | 0.91% | 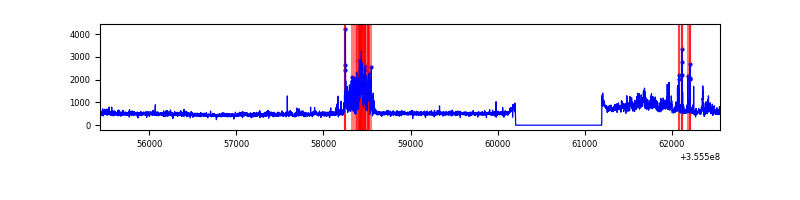 |
| D | 7117 | 6128 | 2 | 2 | 0.03% | 0.03% | 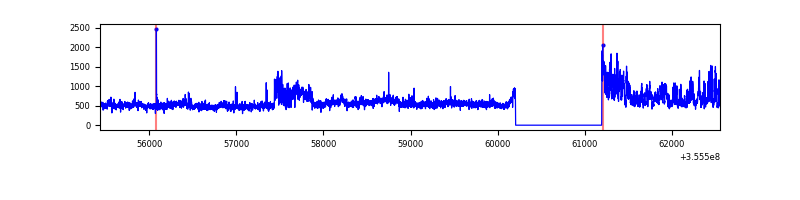 |
Top three noisy pixels from each quadrant. If the there are fewer than three noisy pixels in the level2.evt file, extra rows are filled as -1
| Pixel properties | Quadrant properties | ||||||
|---|---|---|---|---|---|---|---|
| Quadrant | DetID | PixID | Counts | Sigma | Mean | Median | Sigma |
| A | 1 | 113 | 111252 | 712.49 | 777 | 763 | 155.1 |
| A | 0 | 13 | 23141 | 144.3 | 777 | 763 | 155.1 |
| A | 8 | 192 | 14823 | 90.66 | 777 | 763 | 155.1 |
| B | 6 | 159 | 1713118 | 11537.11 | 763 | 743 | 148.4 |
| B | 0 | 229 | 76440 | 510.01 | 763 | 743 | 148.4 |
| B | 0 | 183 | 25119 | 164.23 | 763 | 743 | 148.4 |
| C | 10 | 22 | 396742 | 2305.17 | 733 | 737 | 171.8 |
| C | 3 | 233 | 375585 | 2182.02 | 733 | 737 | 171.8 |
| C | 14 | 238 | 121101 | 700.65 | 733 | 737 | 171.8 |
| D | 7 | 238 | 472052 | 2655.39 | 750 | 731 | 177.5 |
| D | 8 | 195 | 396233 | 2228.23 | 750 | 731 | 177.5 |
| D | 2 | 234 | 22084 | 120.3 | 750 | 731 | 177.5 |
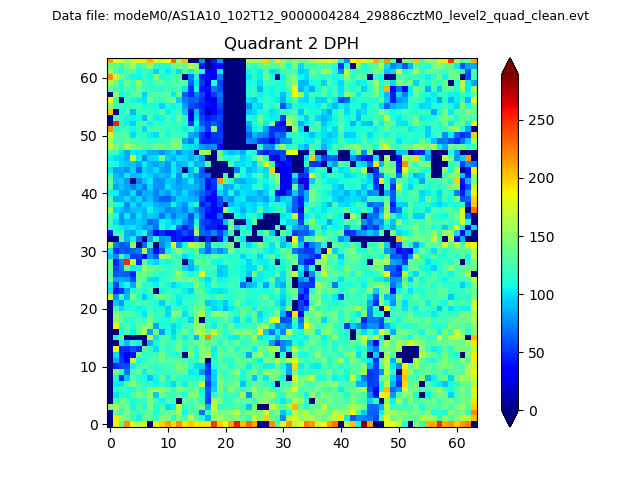
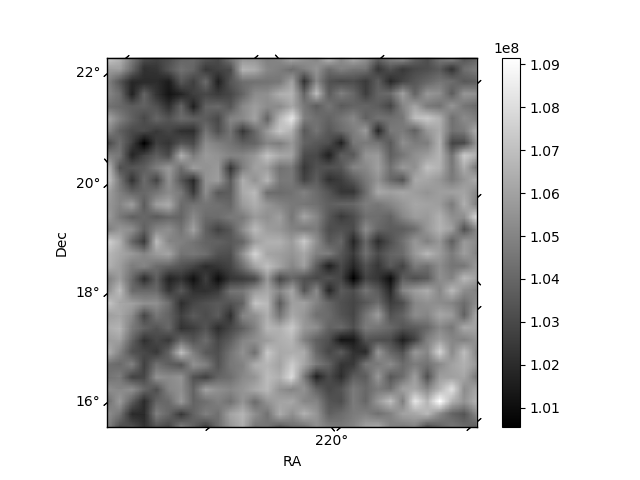
Histogram calculated using DETX and DETY for each event in the final _common_clean file
| Quadrant A | 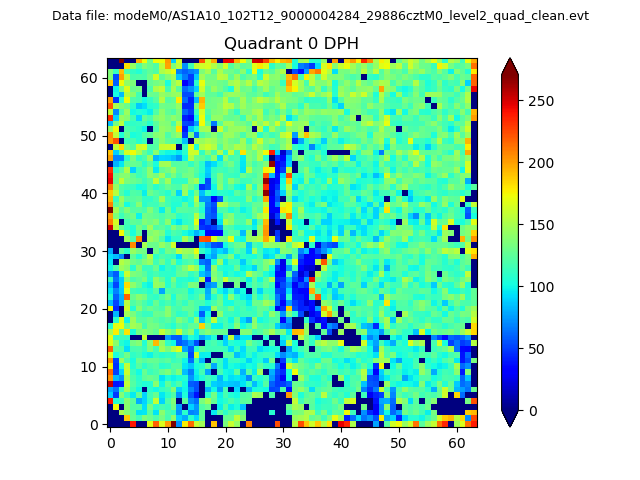 |
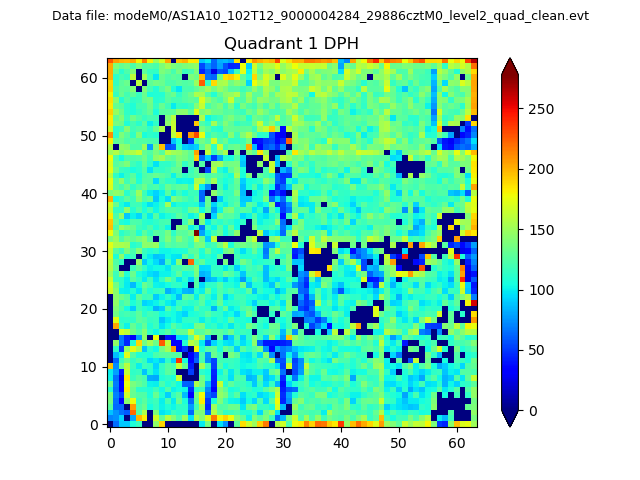 |
Quadrant B |
|---|---|---|---|
| Quadrant D | 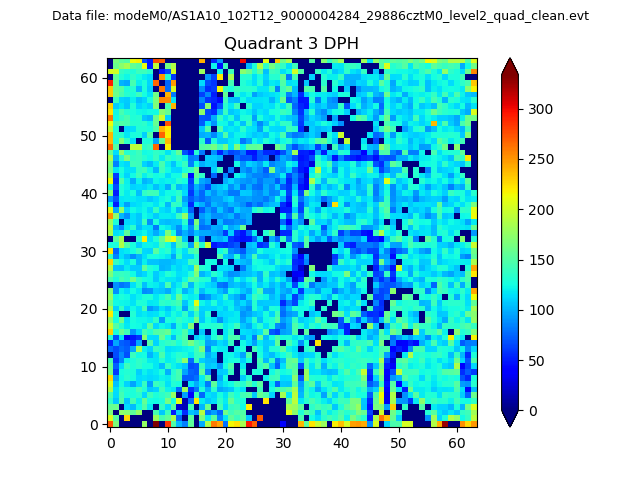 |
 |
Quadrant C |
| Plot type | Count rate plots | Images |
|---|---|---|
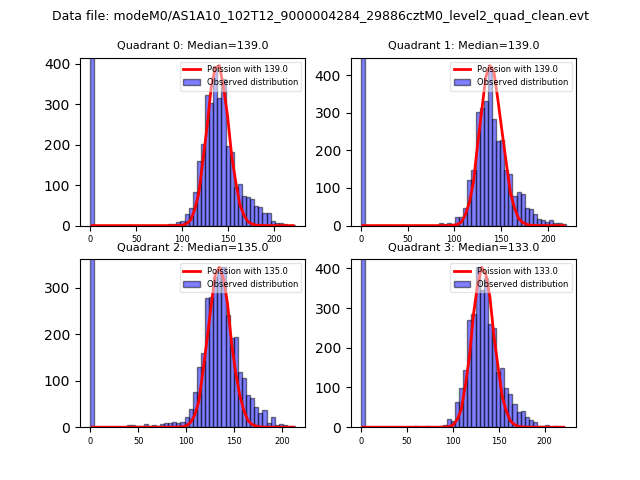
| Comparison with Poisson distribution Blue bars denote a histogram of data divided into 1 sec bins. Red curve is a Poisson curve with rate = median count rate of data. |
 |
 |
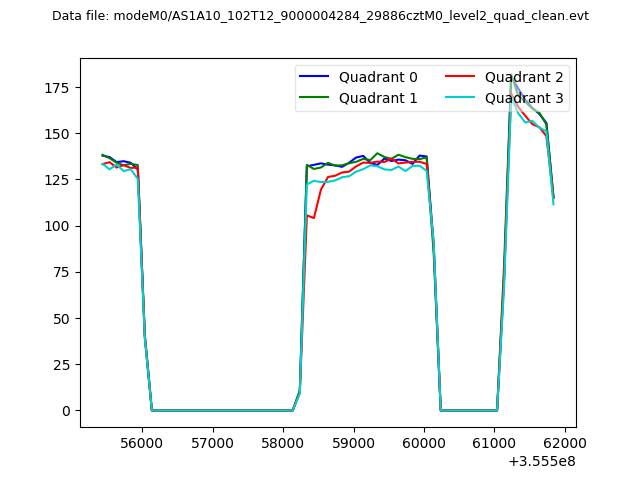
| Quadrant-wise count rates Data is divided into 100 sec bins |
 |
|
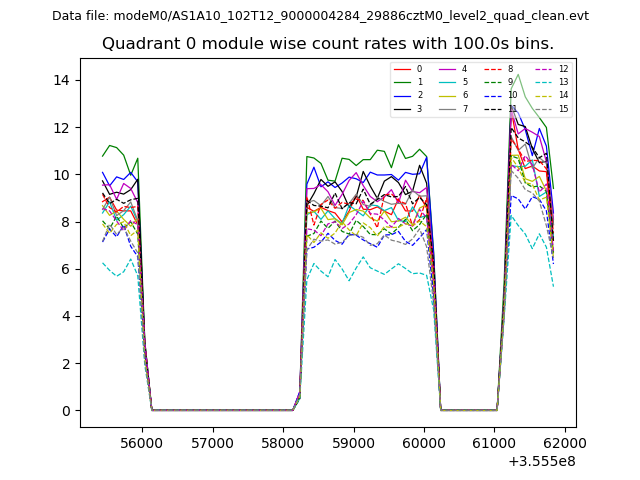
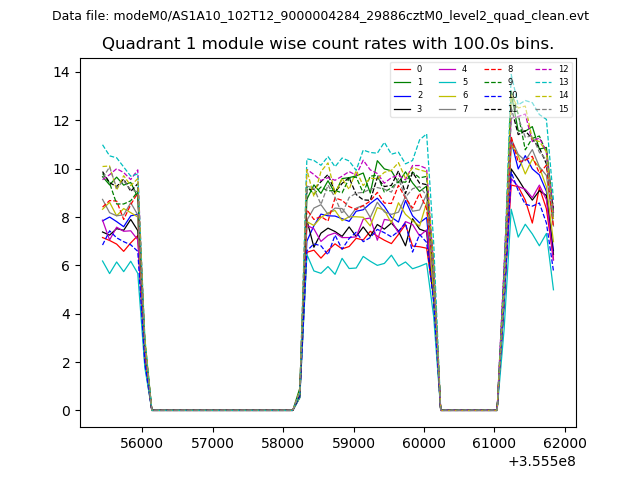
| Module-wise count rates for Quadrant A Data is divided into 100 sec bins |
 |
 |
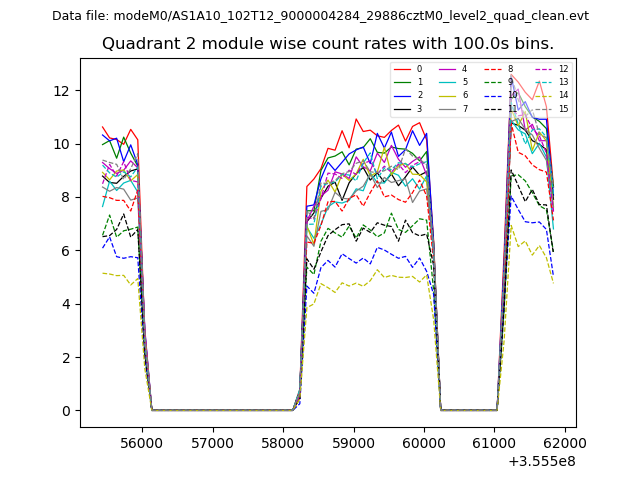
| Module-wise count rates for Quadrant B Data is divided into 100 sec bins |
 |
 |
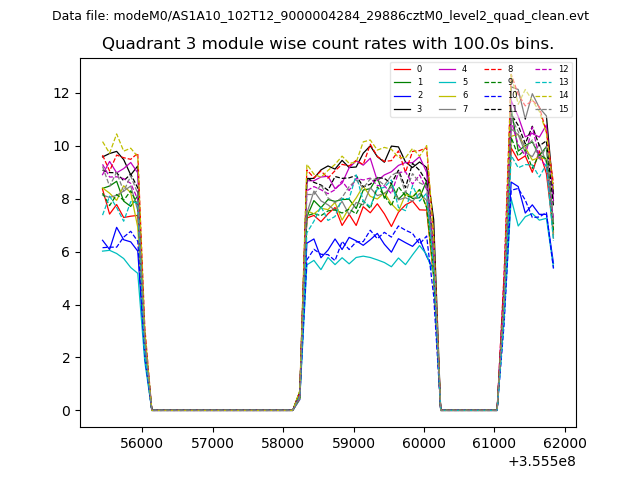
| Module-wise count rates for Quadrant C Data is divided into 100 sec bins |
 |
 |
| Module-wise count rates for Quadrant D Data is divided into 100 sec bins |
 |
 |
| Parameter | Plot |
|---|---|
| CZT HV Monitor | 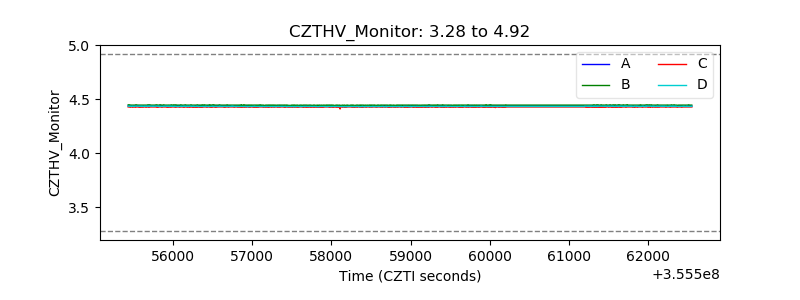 |
| D_VDD | 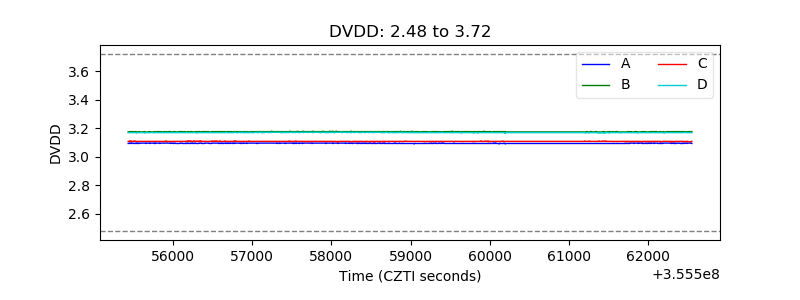 |
| Temperature 1 | 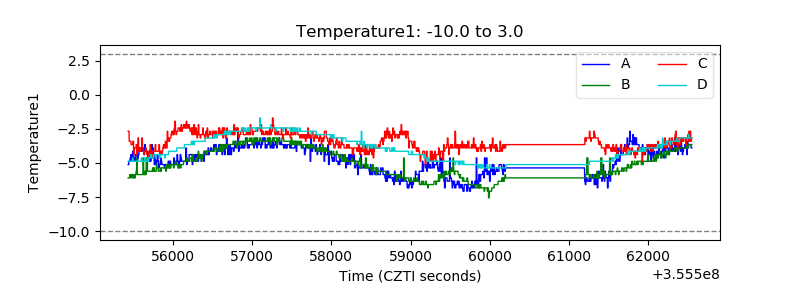 |
| Veto HV Monitor | 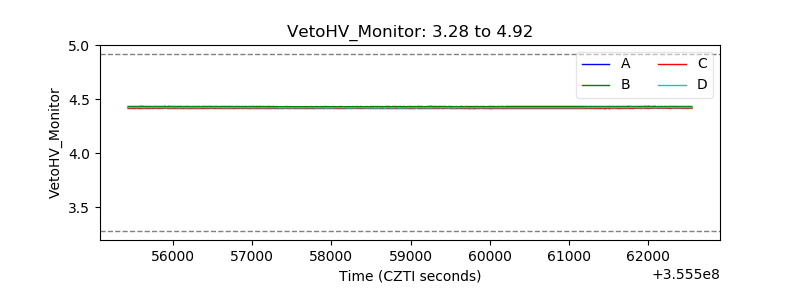 |
| Veto LLD | 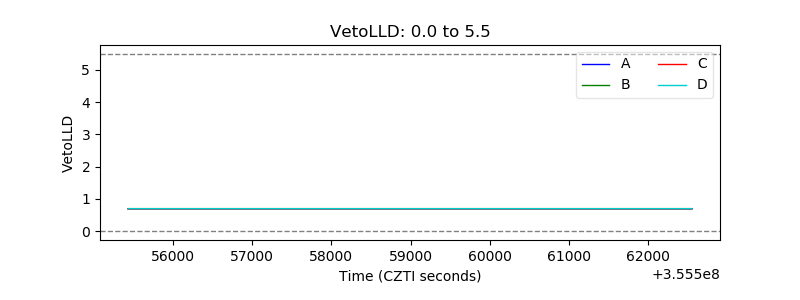 |
| Alpha Counter | 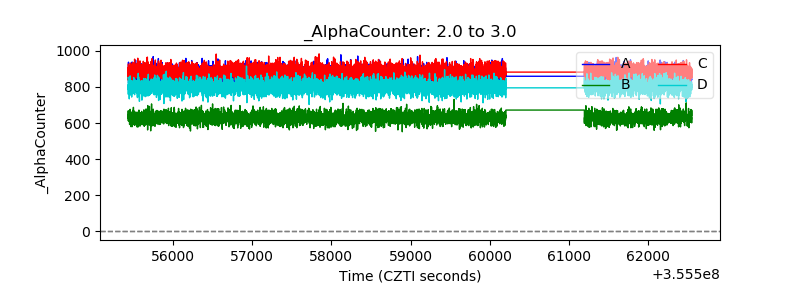 |
| _CPM_Rate | 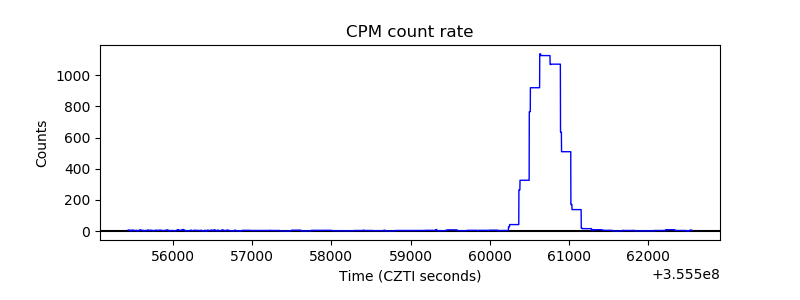 |
| CZT Counter |  |
| +2.5 Volts monitor |  |
| +5 Volts monitor |  |
| _ROLL_ROT | 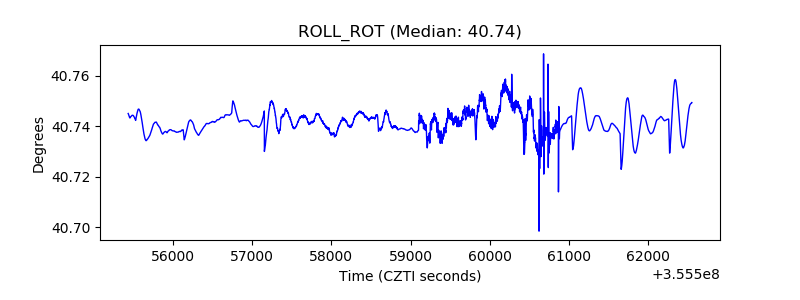 |
| _Roll_DEC | 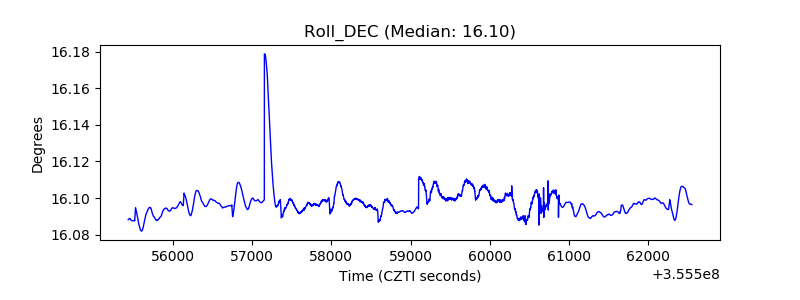 |
| _Roll_RA |  |
| Veto Counter | 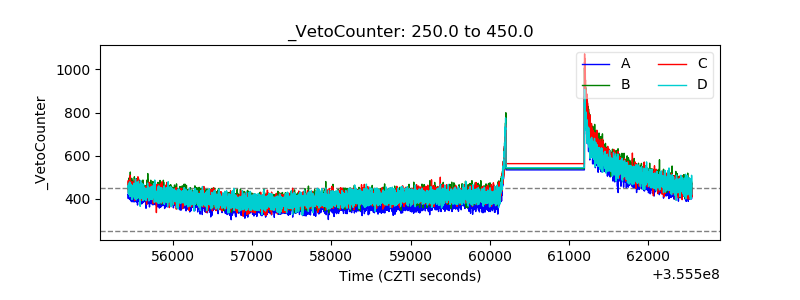 |