| Param | Original file | Final file |
|---|---|---|
| Filename | modeM0/AS1A10_102T12_9000004284_29888cztM0_level2.evt | modeM0/AS1A10_102T12_9000004284_29888cztM0_level2_quad_clean.evt |
| Size (bytes) | 615,323,520 | 76,360,320 |
| Size | 586.8 MB | 72.8 MB |
| Events in quadrant A | 3,502,333 | 476,079 |
| Events in quadrant B | 5,305,379 | 475,789 |
| Events in quadrant C | 4,776,067 | 455,945 |
| Events in quadrant D | 4,607,327 | 446,007 |
| Mode M9 | |||
|---|---|---|---|
| Quadrant | BADHDUFLAG | Total packets | Discarded packets |
| A | 0 | 17 | 0 |
| B | 0 | 18 | 0 |
| C | 0 | 18 | 0 |
| D | 0 | 18 | 0 |
| Mode M0 | |||
|---|---|---|---|
| Quadrant | BADHDUFLAG | Total packets | Discarded packets |
| A | 0 | 14435 | 2 |
| B | 0 | 20200 | 2 |
| C | 0 | 18810 | 2 |
| D | 0 | 18190 | 2 |
| Mode SS | |||
|---|---|---|---|
| Quadrant | BADHDUFLAG | Total packets | Discarded packets |
| A | 0 | 132 | 0 |
| B | 0 | 132 | 0 |
| C | 0 | 132 | 0 |
| D | 0 | 132 | 0 |
| Quadrant | Total seconds | Saturated seconds | Saturation percentage |
|---|---|---|---|
| A | 6577 | 93 | 1.414019% |
| B | 6577 | 121 | 1.839745% |
| C | 6577 | 240 | 3.649080% |
| D | 6576 | 132 | 2.007299% |
Noise dominated data is calculated using 1-second bins in cleaned event files. If a bin has >2000 counts, and if more than 50% of those come from <1% of pixels, then it is considered to be noise-dominated and hence unusable.
| Quadrant | # 1 sec bins | Bins with >0 counts | Bins with >2000 counts | High rate bins dominated by noise | Noise dominated (total time) | Noise dominated (detector-on time) | Marked lightcurve |
|---|---|---|---|---|---|---|---|
| A | 7702 | 6578 | 7 | 7 | 0.09% | 0.11% | 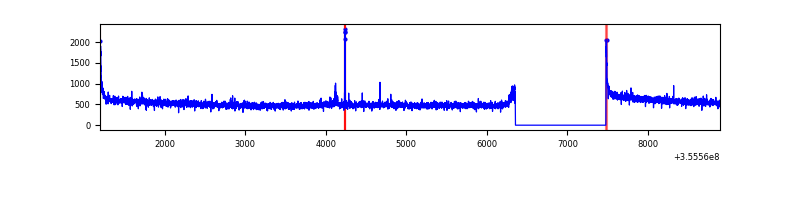 |
| B | 7702 | 6578 | 0 | 0 | 0.00% | 0.00% | 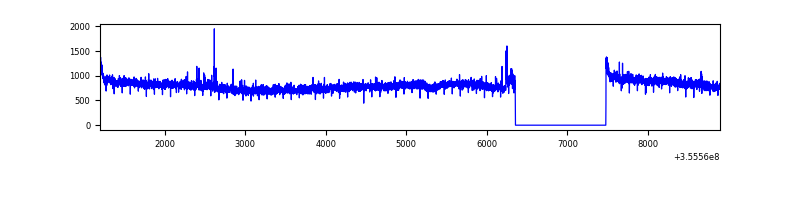 |
| C | 7702 | 6578 | 51 | 51 | 0.66% | 0.78% | 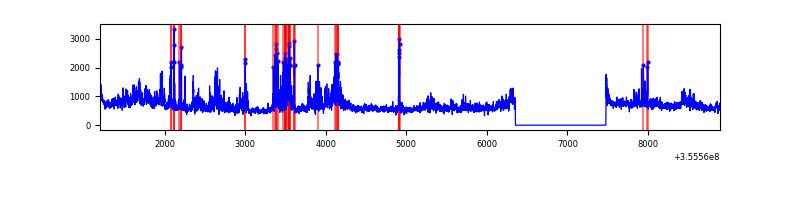 |
| D | 7701 | 6577 | 41 | 41 | 0.53% | 0.62% | 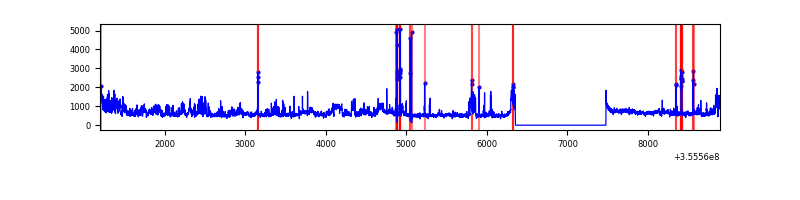 |
Top three noisy pixels from each quadrant. If the there are fewer than three noisy pixels in the level2.evt file, extra rows are filled as -1
| Pixel properties | Quadrant properties | ||||||
|---|---|---|---|---|---|---|---|
| Quadrant | DetID | PixID | Counts | Sigma | Mean | Median | Sigma |
| A | 8 | 192 | 27832 | 152.15 | 894 | 879 | 177.1 |
| A | 15 | 174 | 21775 | 117.96 | 894 | 879 | 177.1 |
| A | 13 | 254 | 11805 | 61.68 | 894 | 879 | 177.1 |
| B | 6 | 159 | 1822299 | 10957.92 | 873 | 852 | 166.2 |
| B | 0 | 229 | 46780 | 276.31 | 873 | 852 | 166.2 |
| B | 12 | 111 | 20438 | 117.83 | 873 | 852 | 166.2 |
| C | 3 | 233 | 825842 | 4244.75 | 838 | 846 | 194.4 |
| C | 10 | 22 | 536446 | 2755.76 | 838 | 846 | 194.4 |
| C | 14 | 238 | 135682 | 693.75 | 838 | 846 | 194.4 |
| D | 8 | 195 | 442986 | 2220.32 | 852 | 833 | 199.1 |
| D | 7 | 238 | 416898 | 2089.32 | 852 | 833 | 199.1 |
| D | 13 | 104 | 191895 | 959.44 | 852 | 833 | 199.1 |
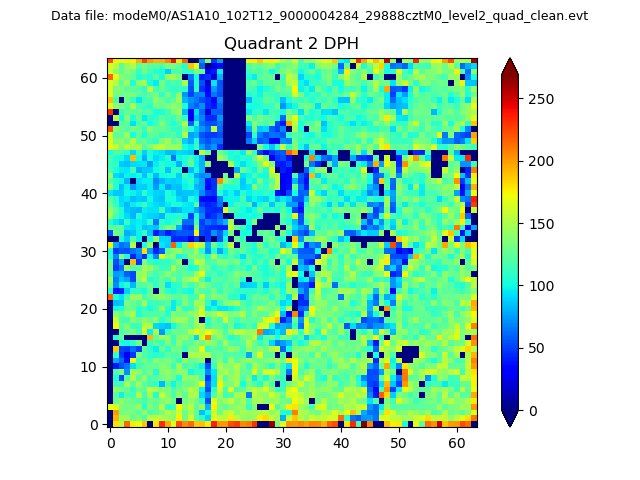
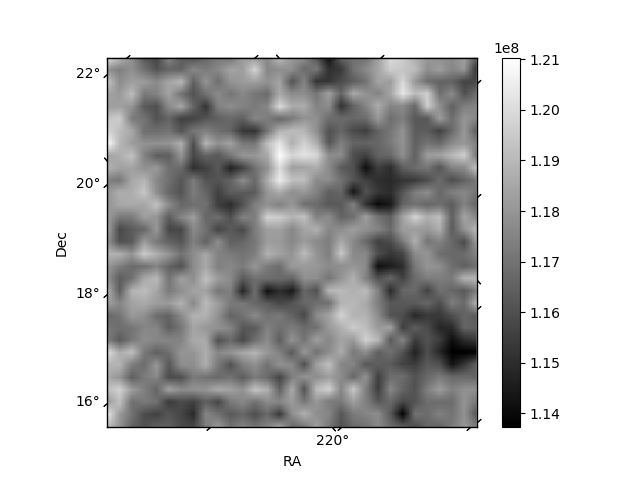
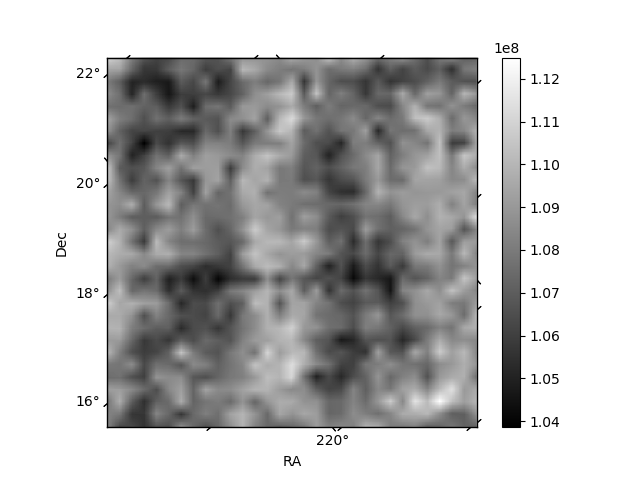
Histogram calculated using DETX and DETY for each event in the final _common_clean file
| Quadrant A | 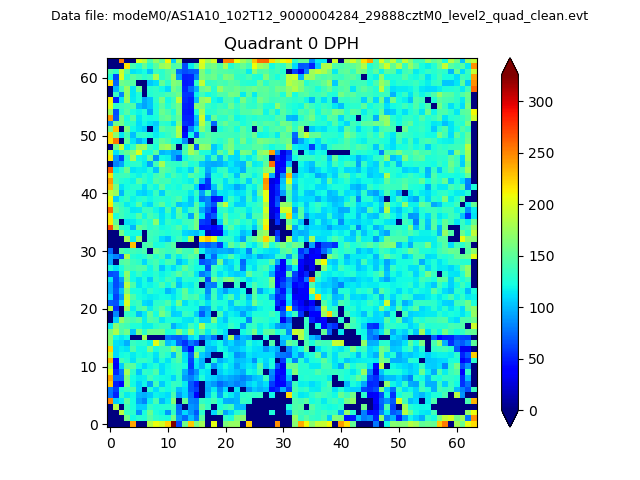 |
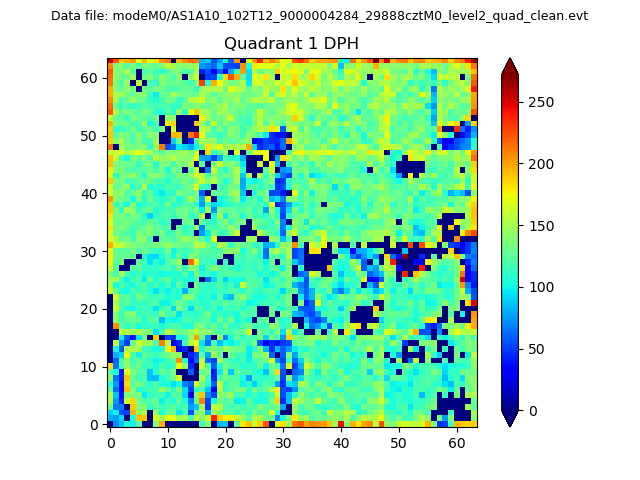 |
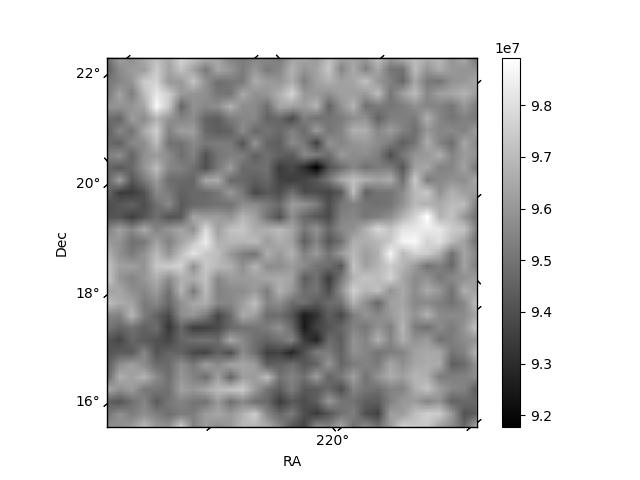
Quadrant B |
|---|---|---|---|
| Quadrant D | 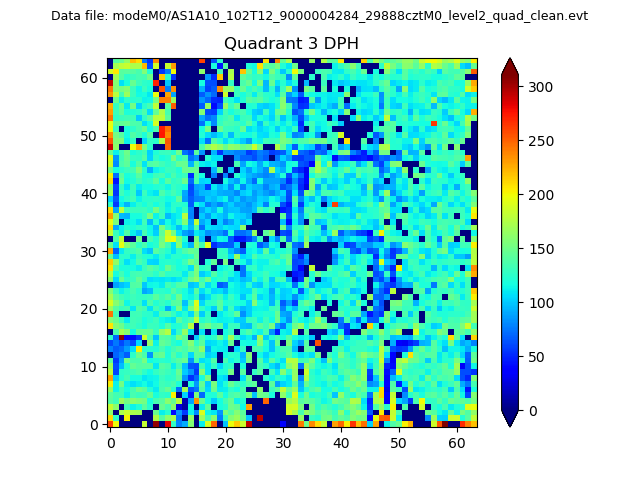 |
 |
Quadrant C |
| Plot type | Count rate plots | Images |
|---|---|---|
| Comparison with Poisson distribution Blue bars denote a histogram of data divided into 1 sec bins. Red curve is a Poisson curve with rate = median count rate of data. |
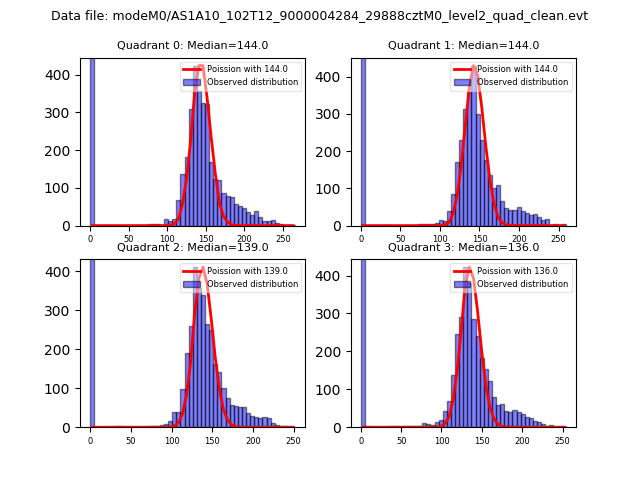 |
 |
| Quadrant-wise count rates Data is divided into 100 sec bins |
 |
|
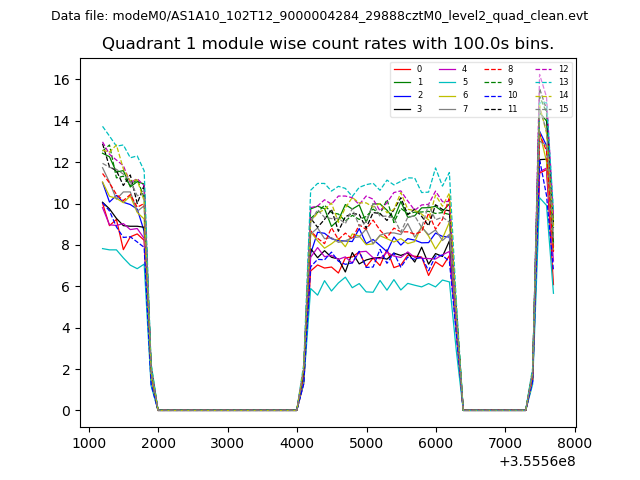
| Module-wise count rates for Quadrant A Data is divided into 100 sec bins |
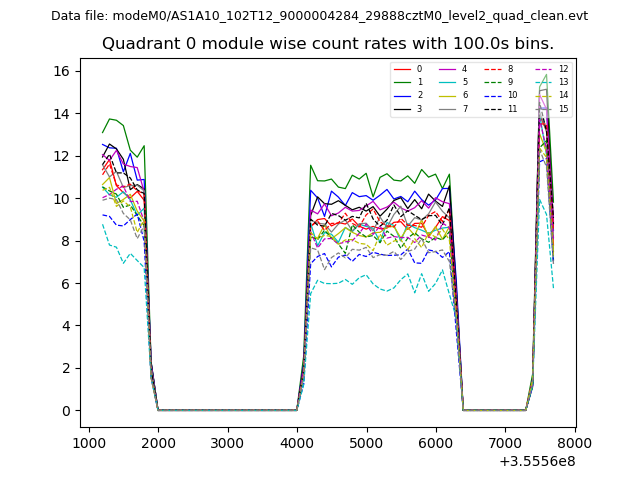 |
 |
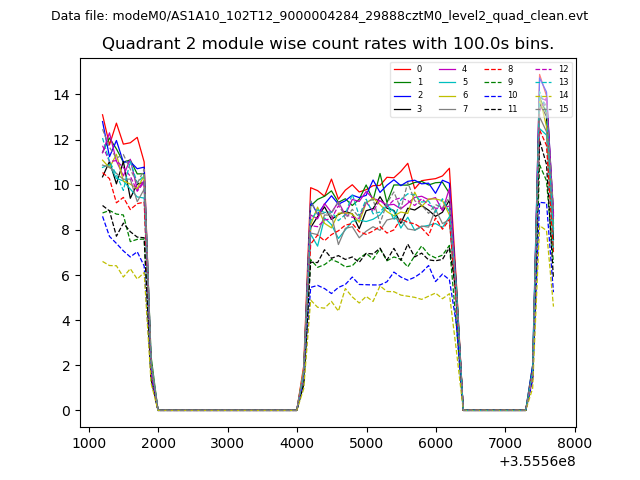
| Module-wise count rates for Quadrant B Data is divided into 100 sec bins |
 |
 |
| Module-wise count rates for Quadrant C Data is divided into 100 sec bins |
 |
 |
| Module-wise count rates for Quadrant D Data is divided into 100 sec bins |
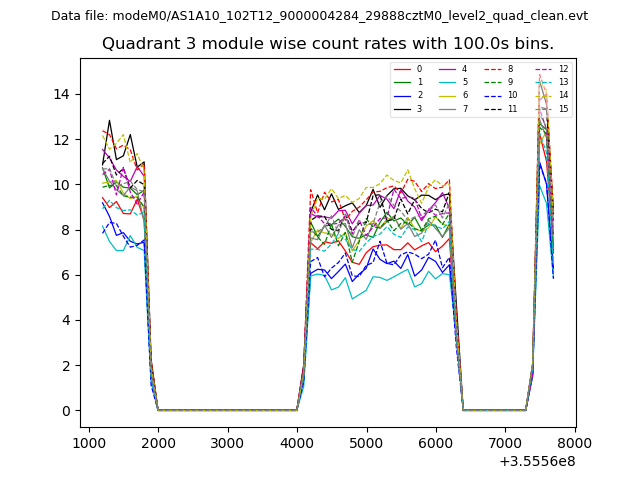 |
 |
| Parameter | Plot |
|---|---|
| CZT HV Monitor | 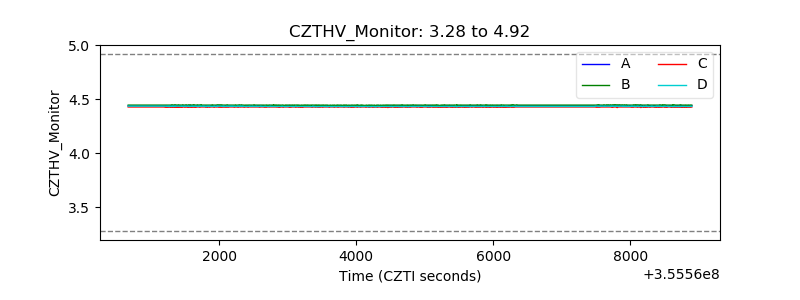 |
| D_VDD | 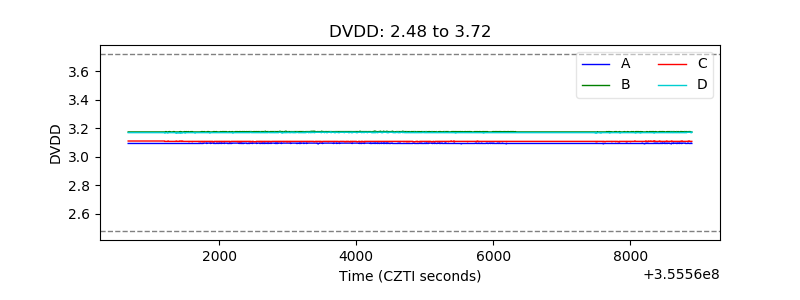 |
| Temperature 1 | 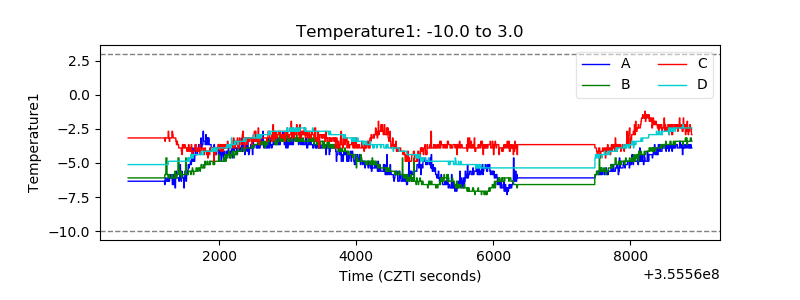 |
| Veto HV Monitor | 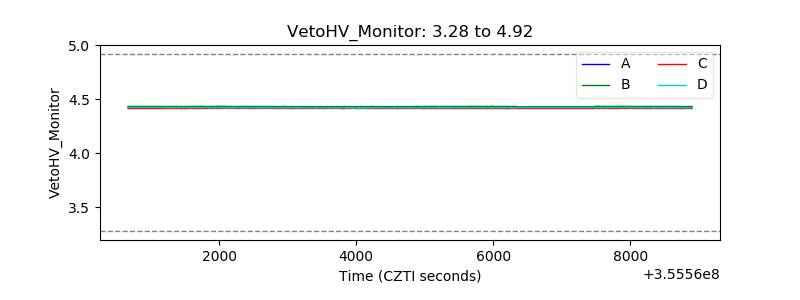 |
| Veto LLD | 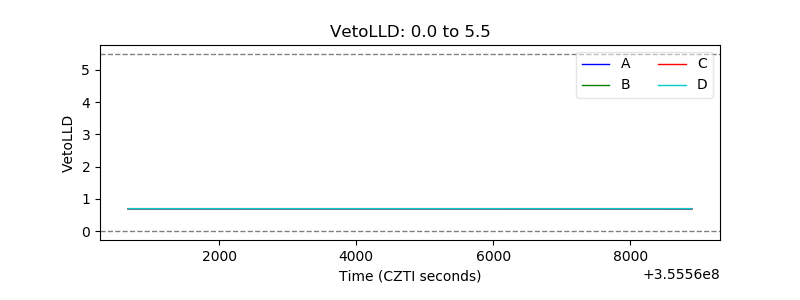 |
| Alpha Counter | 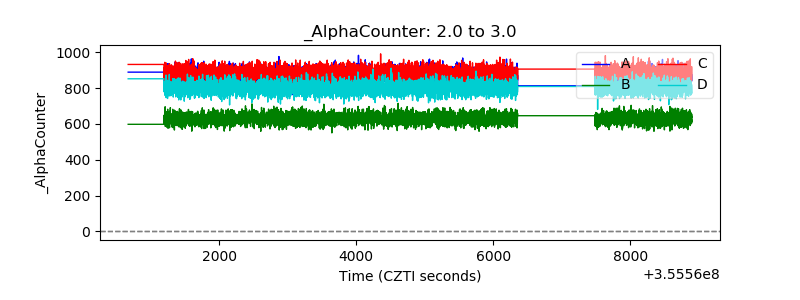 |
| _CPM_Rate | 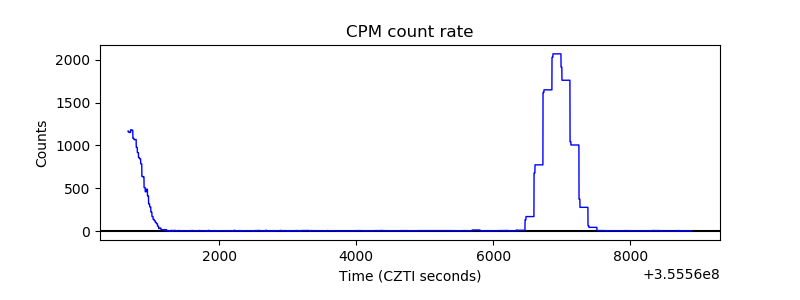 |
| CZT Counter |  |
| +2.5 Volts monitor |  |
| +5 Volts monitor |  |
| _ROLL_ROT | 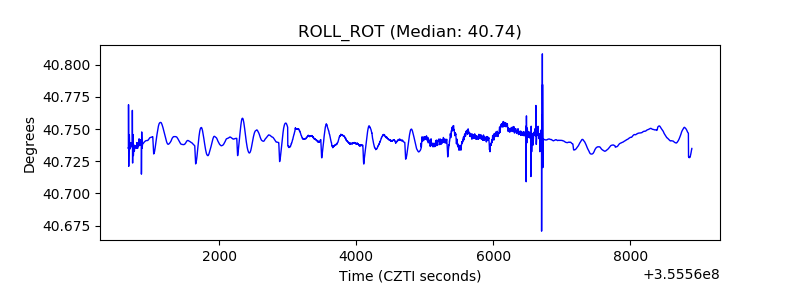 |
| _Roll_DEC | 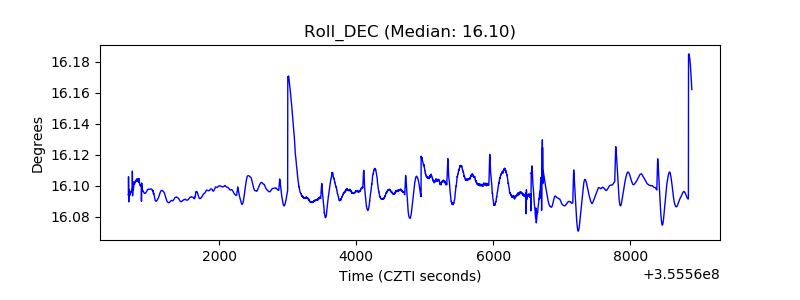 |
| _Roll_RA | 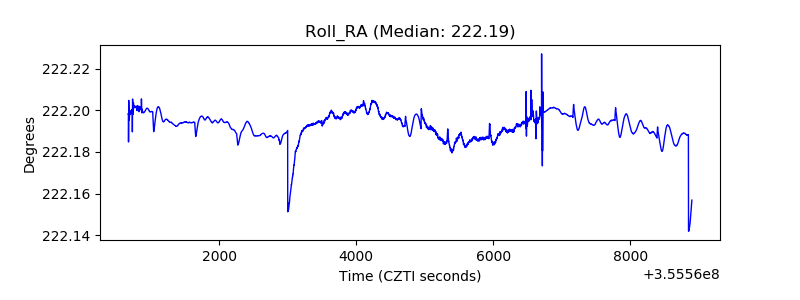 |
| Veto Counter | 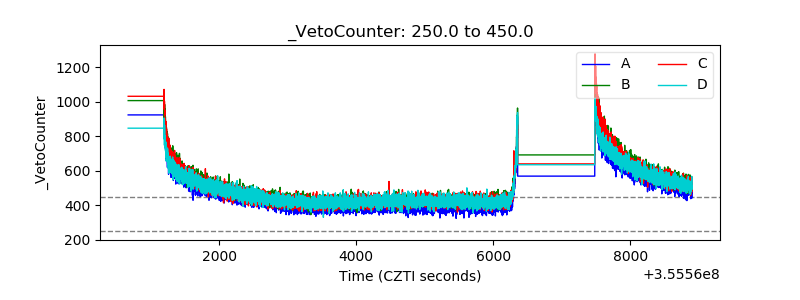 |