| Param | Original file | Final file |
|---|---|---|
| Filename | modeM0/AS1A10_102T12_9000004284_29889cztM0_level2.evt | modeM0/AS1A10_102T12_9000004284_29889cztM0_level2_quad_clean.evt |
| Size (bytes) | 616,034,880 | 68,630,400 |
| Size | 587.5 MB | 65.5 MB |
| Events in quadrant A | 3,645,258 | 419,529 |
| Events in quadrant B | 5,423,759 | 416,380 |
| Events in quadrant C | 4,702,641 | 398,119 |
| Events in quadrant D | 4,448,966 | 393,565 |
| Mode M9 | |||
|---|---|---|---|
| Quadrant | BADHDUFLAG | Total packets | Discarded packets |
| A | 0 | 18 | 0 |
| B | 0 | 19 | 0 |
| C | 0 | 19 | 0 |
| D | 0 | 19 | 0 |
| Mode M0 | |||
|---|---|---|---|
| Quadrant | BADHDUFLAG | Total packets | Discarded packets |
| A | 0 | 14970 | 2 |
| B | 0 | 20392 | 2 |
| C | 0 | 18477 | 2 |
| D | 0 | 17757 | 2 |
| Mode SS | |||
|---|---|---|---|
| Quadrant | BADHDUFLAG | Total packets | Discarded packets |
| A | 0 | 130 | 0 |
| B | 0 | 130 | 0 |
| C | 0 | 130 | 0 |
| D | 0 | 130 | 0 |
| Quadrant | Total seconds | Saturated seconds | Saturation percentage |
|---|---|---|---|
| A | 6459 | 101 | 1.563710% |
| B | 6459 | 157 | 2.430717% |
| C | 6459 | 252 | 3.901533% |
| D | 6459 | 196 | 3.034525% |
Noise dominated data is calculated using 1-second bins in cleaned event files. If a bin has >2000 counts, and if more than 50% of those come from <1% of pixels, then it is considered to be noise-dominated and hence unusable.
| Quadrant | # 1 sec bins | Bins with >0 counts | Bins with >2000 counts | High rate bins dominated by noise | Noise dominated (total time) | Noise dominated (detector-on time) | Marked lightcurve |
|---|---|---|---|---|---|---|---|
| A | 7679 | 6460 | 3 | 3 | 0.04% | 0.05% | 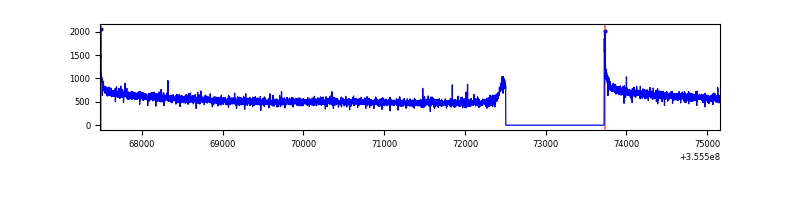 |
| B | 7679 | 6460 | 1 | 1 | 0.01% | 0.02% |  |
| C | 7679 | 6460 | 44 | 44 | 0.57% | 0.68% | 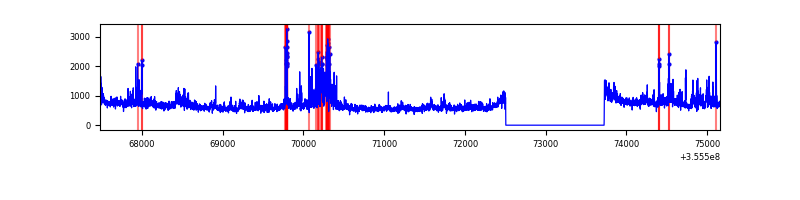 |
| D | 7679 | 6460 | 106 | 106 | 1.38% | 1.64% | 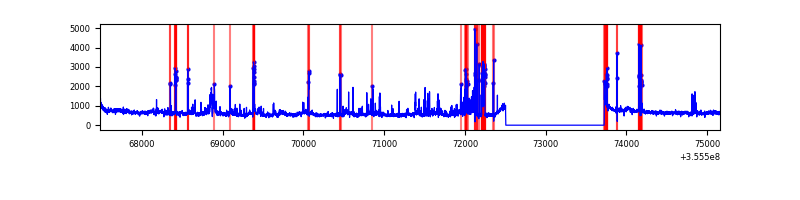 |
Top three noisy pixels from each quadrant. If the there are fewer than three noisy pixels in the level2.evt file, extra rows are filled as -1
| Pixel properties | Quadrant properties | ||||||
|---|---|---|---|---|---|---|---|
| Quadrant | DetID | PixID | Counts | Sigma | Mean | Median | Sigma |
| A | 8 | 192 | 25557 | 133.72 | 939 | 925 | 184.2 |
| A | 13 | 254 | 11151 | 55.51 | 939 | 925 | 184.2 |
| A | 3 | 137 | 8462 | 40.92 | 939 | 925 | 184.2 |
| B | 6 | 159 | 1739978 | 10116.27 | 915 | 893 | 171.9 |
| B | 0 | 229 | 87342 | 502.87 | 915 | 893 | 171.9 |
| B | 12 | 111 | 20511 | 114.12 | 915 | 893 | 171.9 |
| C | 3 | 233 | 737656 | 3612.81 | 882 | 892 | 203.9 |
| C | 10 | 22 | 372773 | 1823.56 | 882 | 892 | 203.9 |
| C | 14 | 238 | 145296 | 708.1 | 882 | 892 | 203.9 |
| D | 7 | 80 | 461490 | 2205.1 | 898 | 878 | 208.9 |
| D | 8 | 195 | 388222 | 1854.34 | 898 | 878 | 208.9 |
| D | 7 | 238 | 89876 | 426.06 | 898 | 878 | 208.9 |
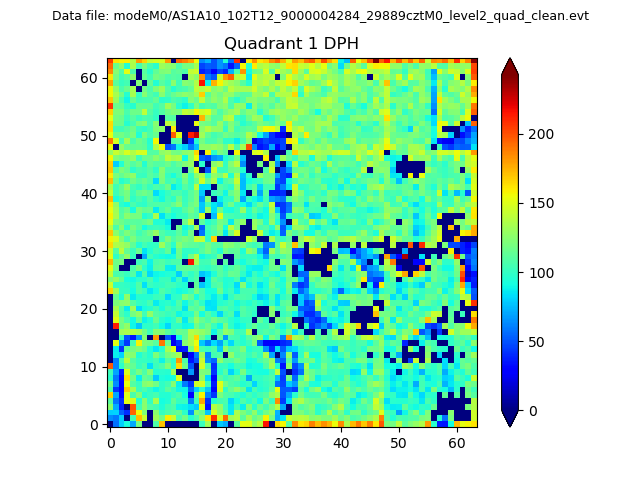
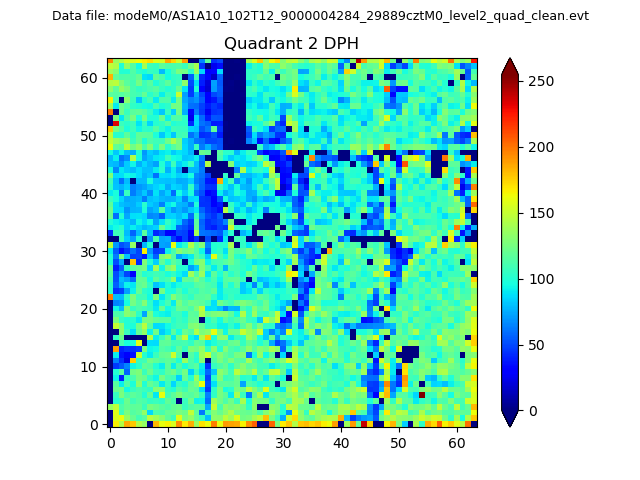
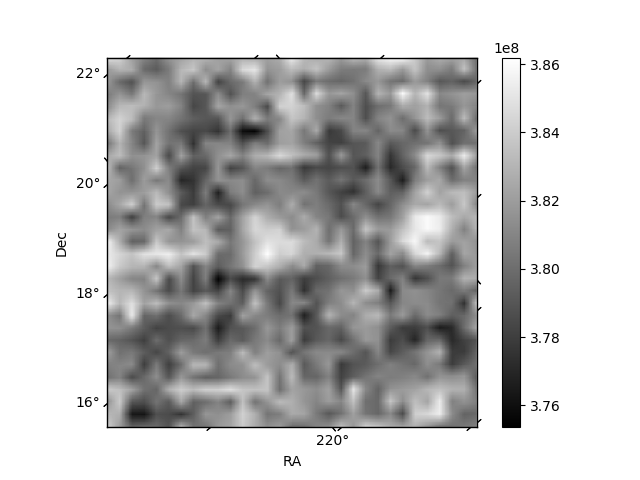
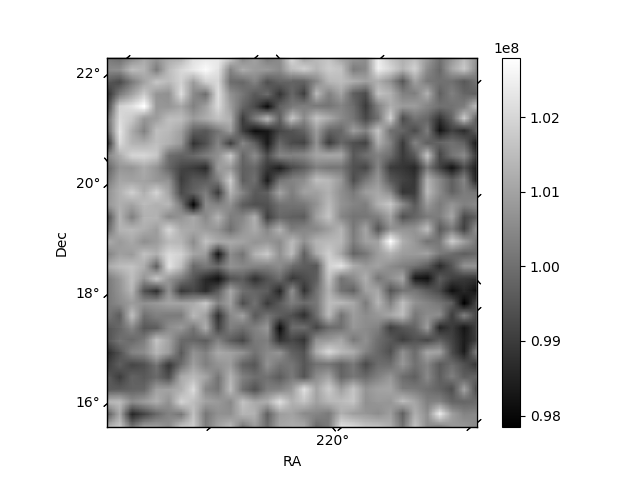
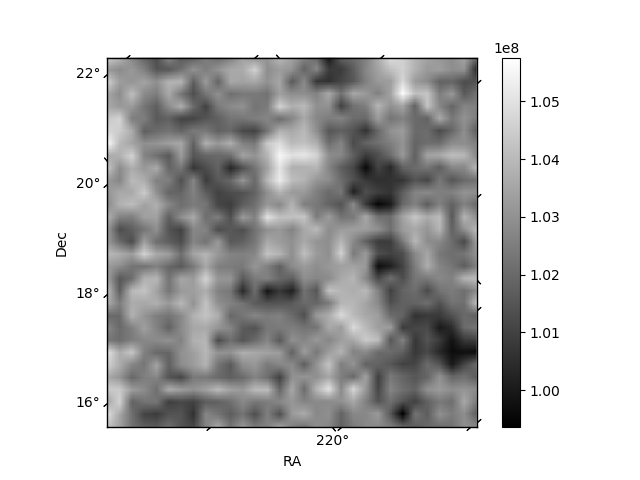
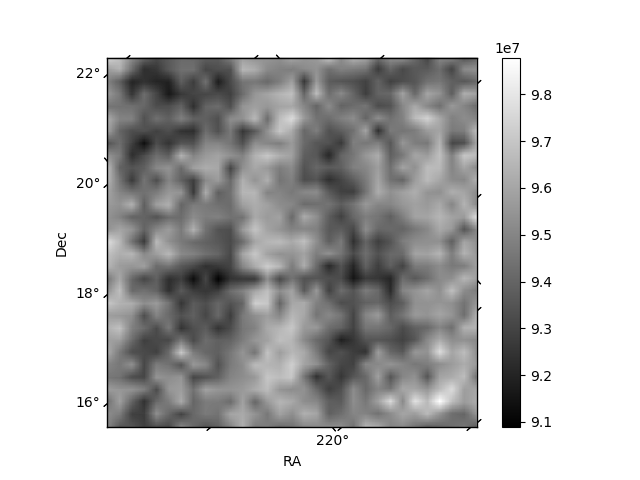
Histogram calculated using DETX and DETY for each event in the final _common_clean file
| Quadrant A | 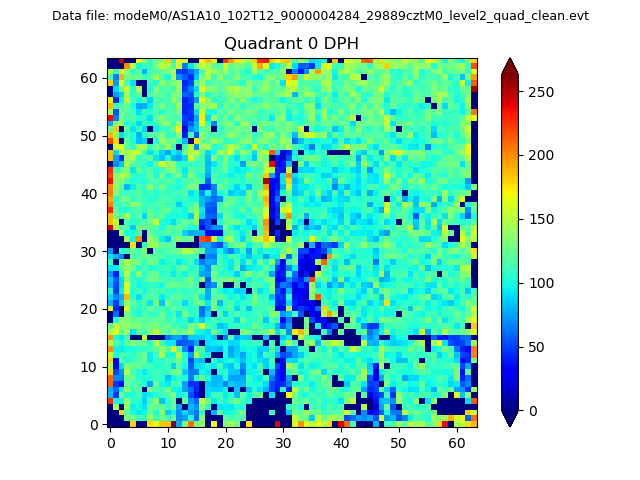 |
 |
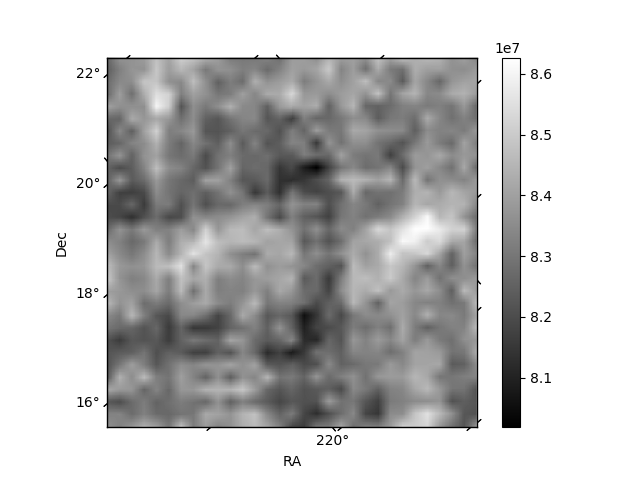
Quadrant B |
|---|---|---|---|
| Quadrant D | 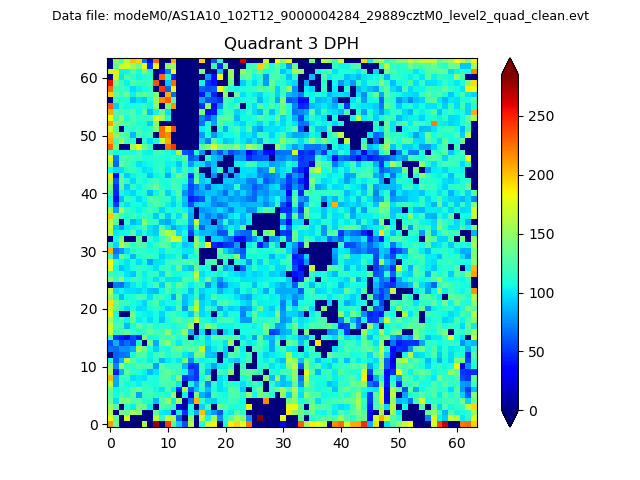 |
 |
Quadrant C |
| Plot type | Count rate plots | Images |
|---|---|---|
| Comparison with Poisson distribution Blue bars denote a histogram of data divided into 1 sec bins. Red curve is a Poisson curve with rate = median count rate of data. |
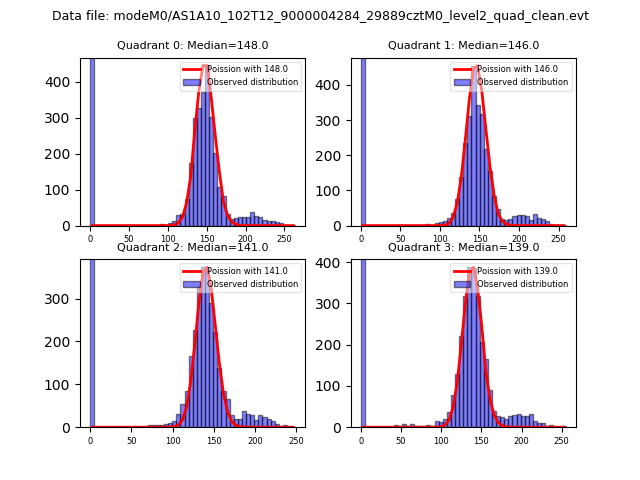 |
 |
| Quadrant-wise count rates Data is divided into 100 sec bins |
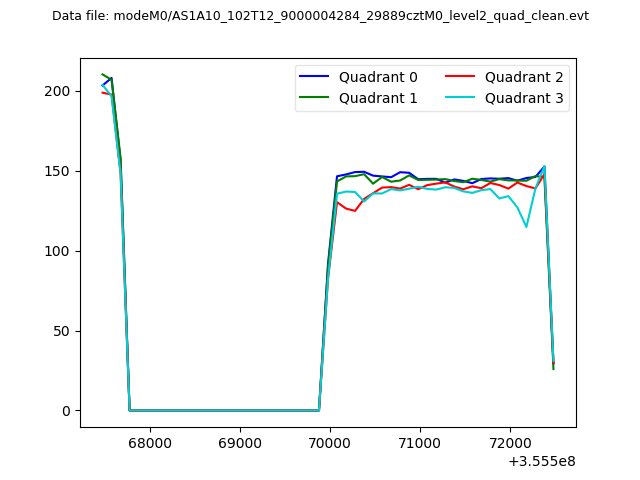 |
|
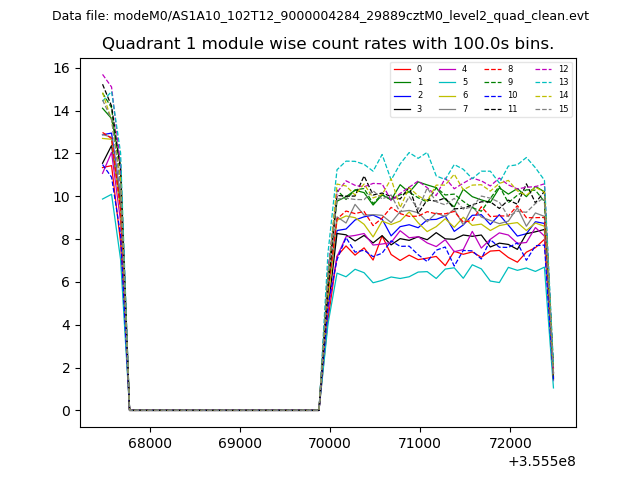
| Module-wise count rates for Quadrant A Data is divided into 100 sec bins |
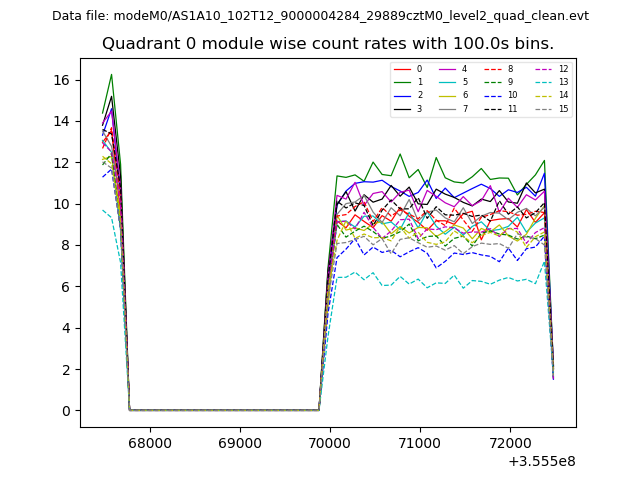 |
 |
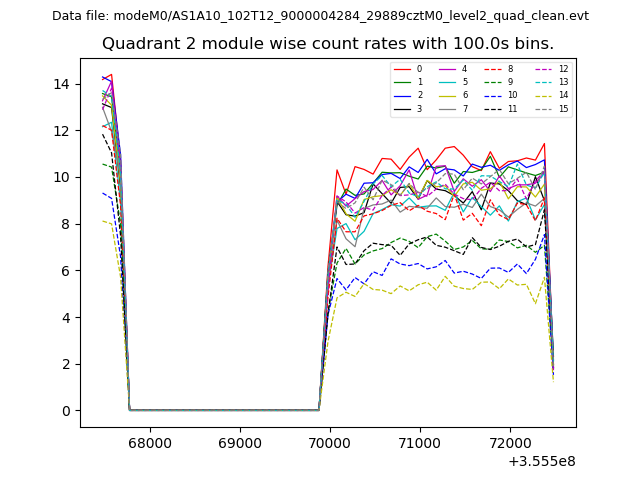
| Module-wise count rates for Quadrant B Data is divided into 100 sec bins |
 |
 |
| Module-wise count rates for Quadrant C Data is divided into 100 sec bins |
 |
 |
| Module-wise count rates for Quadrant D Data is divided into 100 sec bins |
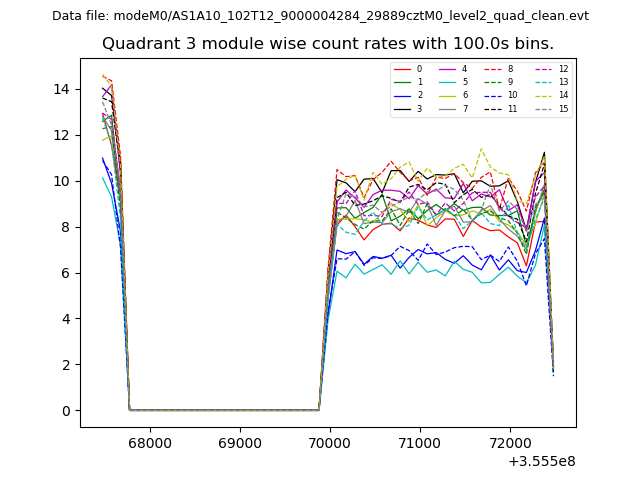 |
 |
| Parameter | Plot |
|---|---|
| CZT HV Monitor | 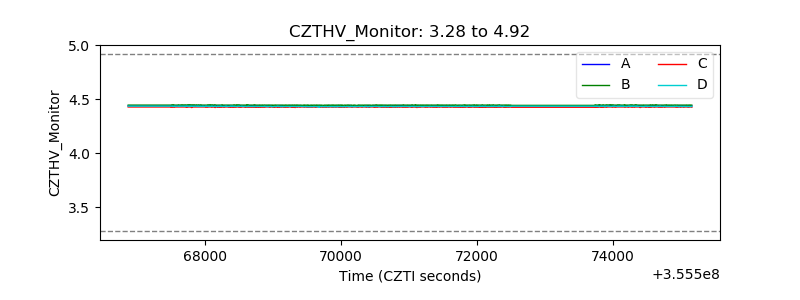 |
| D_VDD | 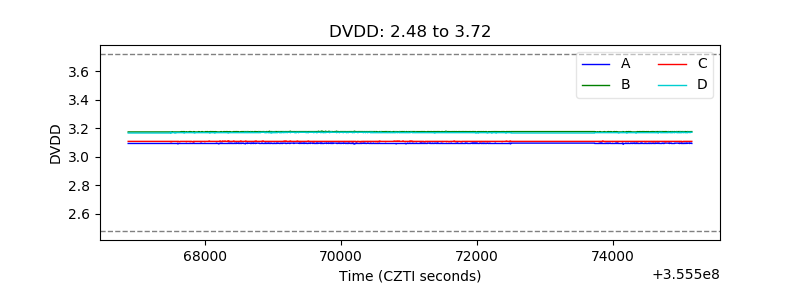 |
| Temperature 1 | 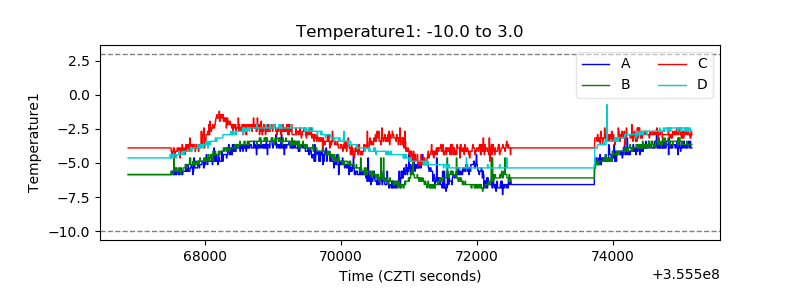 |
| Veto HV Monitor |  |
| Veto LLD |  |
| Alpha Counter | 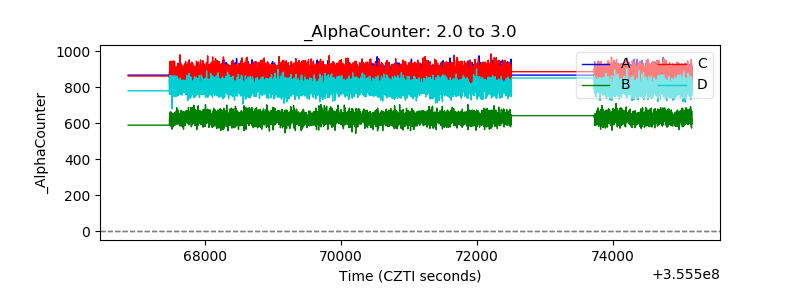 |
| _CPM_Rate | 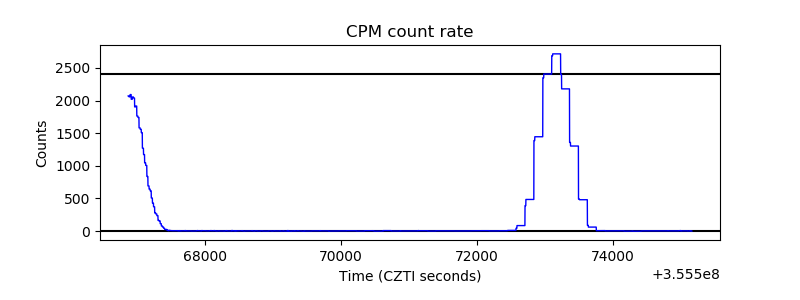 |
| CZT Counter | 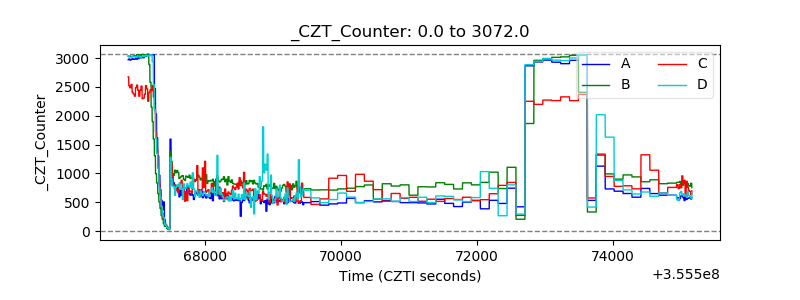 |
| +2.5 Volts monitor |  |
| +5 Volts monitor |  |
| _ROLL_ROT | 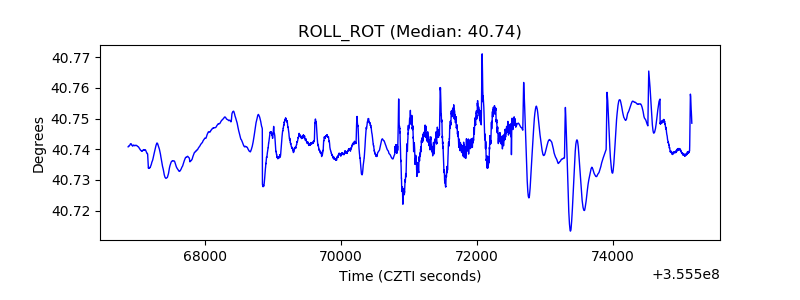 |
| _Roll_DEC | 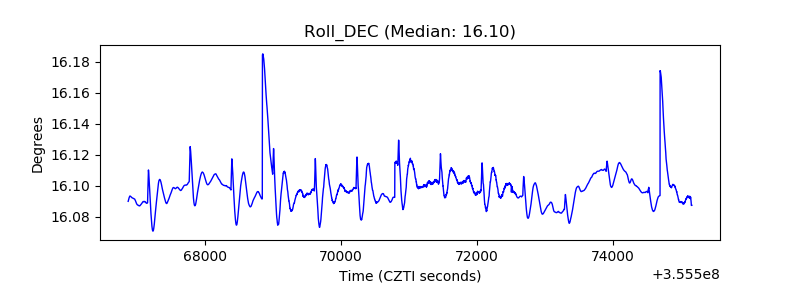 |
| _Roll_RA | 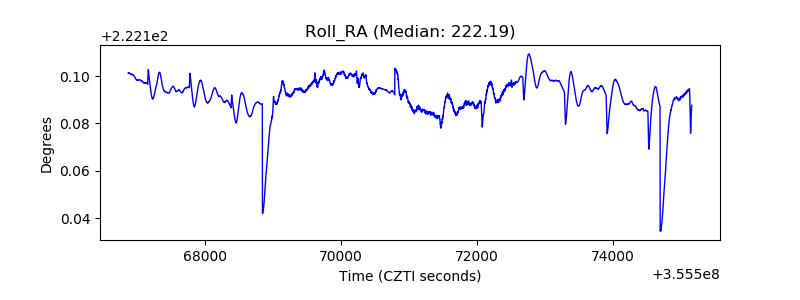 |
| Veto Counter | 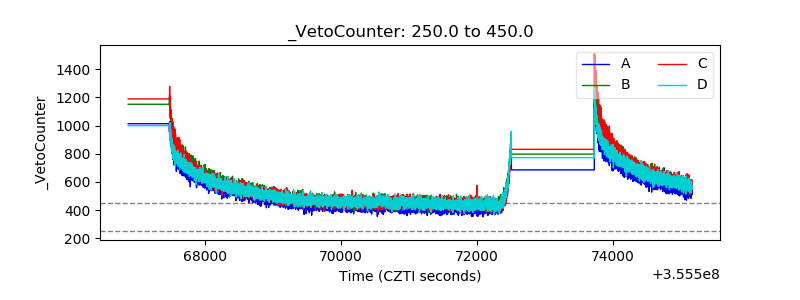 |